. 2015 May 20;35(20):7964-76.
doi: 10.1523/JNEUROSCI.3884-14.2015.

Basolateral amygdala response to food cues in the absence of hunger is associated with weight gain susceptibility

Affiliations

Basolateral amygdala response to food cues in the absence of hunger is associated with weight gain susceptibility

Xue Sun et al. J Neurosci. .

Abstract

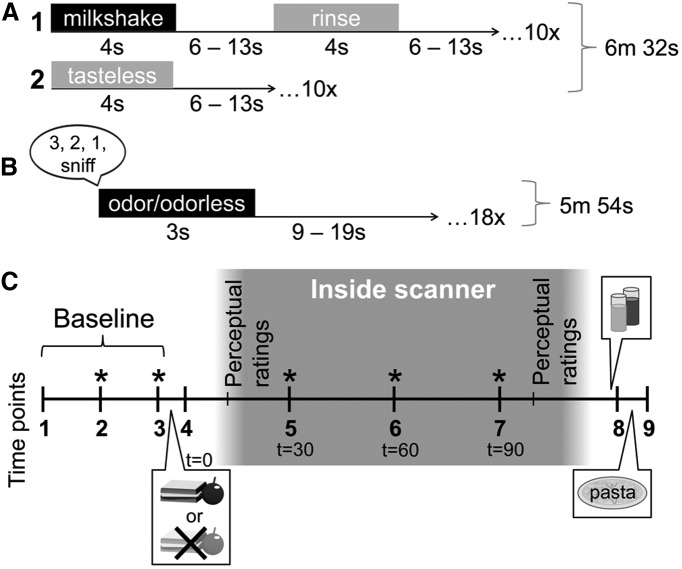
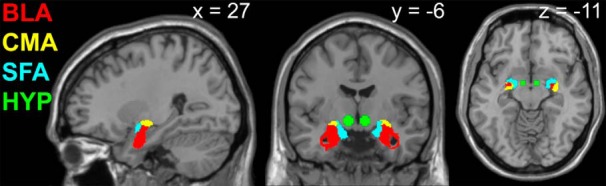
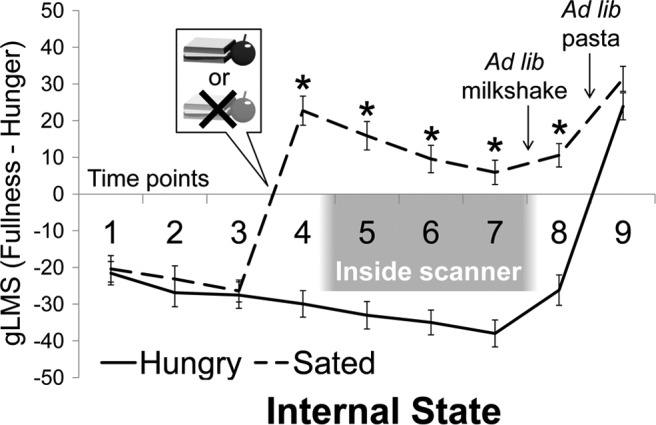
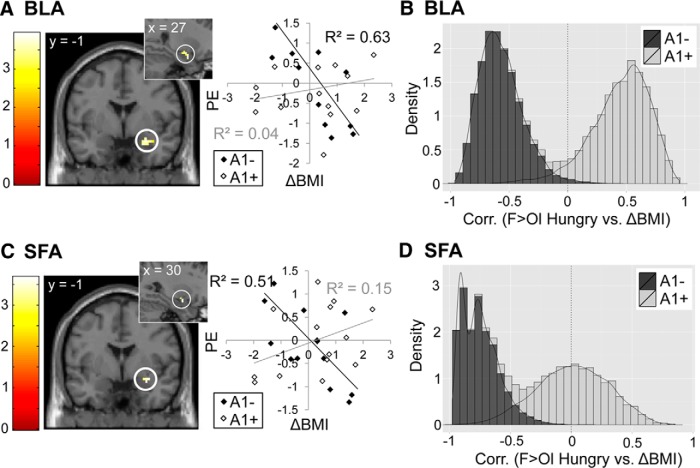
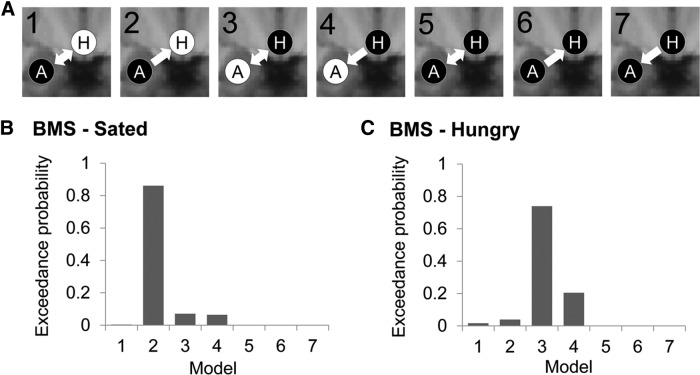
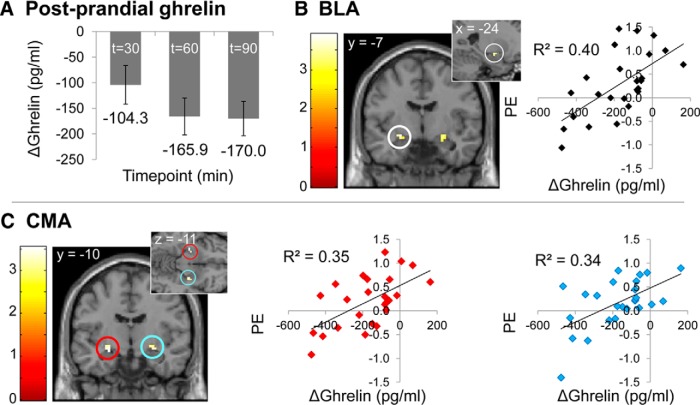
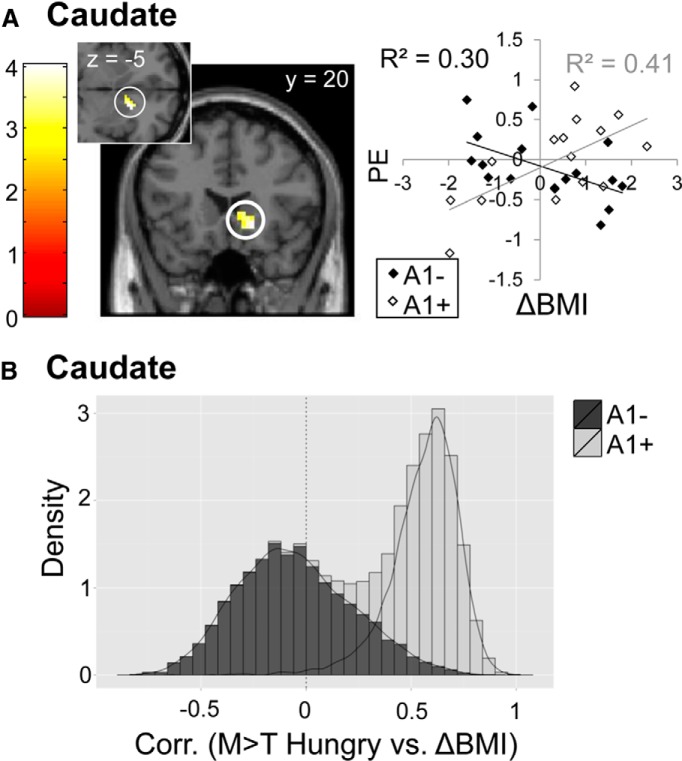
In rodents, food-predictive cues elicit eating in the absence of hunger (Weingarten, 1983). This behavior is disrupted by the disconnection of amygdala pathways to the lateral hypothalamus (Petrovich et al., 2002). Whether this circuit contributes to long-term weight gain is unknown. Using fMRI in 32 healthy individuals, we demonstrate here that the amygdala response to the taste of a milkshake when sated but not hungry positively predicts weight change. This effect is independent of sex, initial BMI, and total circulating ghrelin levels, but it is only present in individuals who do not carry a copy of the A1 allele of the Taq1A polymorphism. In contrast, A1 allele carriers, who have decreased D2 receptor density (Blum et al., 1996), show a positive association between caudate response and weight change. Regardless of genotype, however, dynamic causal modeling supports unidirectional gustatory input from basolateral amygdala (BLA) to hypothalamus in sated subjects. This finding suggests that, as in rodents, external cues gain access to the homeostatic control circuits of the human hypothalamus via the amygdala. In contrast, during hunger, gustatory inputs enter the hypothalamus and drive bidirectional connectivity with the amygdala. These findings implicate the BLA-hypothalamic circuit in long-term weight change related to nonhomeostatic eating and provide compelling evidence that distinct brain mechanisms confer susceptibility to weight gain depending upon individual differences in dopamine signaling.

Keywords: TaqIA; fMRI; feeding; metabolism; obesity; satiety.


Figures

Figure 1.
Figure 1.
fMRI stimulus presentation and session design. A, The taste run was 6 m 32 s long and consisted of the uncued delivery of 2 different types of stimuli: 1, a 4 s delivery of either chocolate or strawberry milkshake, followed by a 6–13 s rest period, a 4 s tasteless rinse, and another 6–13 s rest period; or 2, a 4 s delivery of tasteless solution, followed by a 6–13 s rest period. The subjects were instructed to swallow and exhale through their nose after receiving each liquid. There were 10 repetitions of each of the two events of interest (milkshake and tasteless), resulting in 20 presentations per run. B, The odor run was 5 m 54 s long and subjects were instructed to breathe in through their nose after receiving the prerecorded verbal instructions “3, 2, 1, sniff” through headphones. Odor or odorless delivery occurred immediately after the auditory cue so that delivery was time locked to sniff onset. Olfactory stimulation lasted for 3 s, followed by a 9–19 s rest period before the next trial. There were six repetitions of each of the three events of interest (food odor, nonfood odor, odorless), resulting in 18 presentations per run. C, During fMRI scan sessions, subjects made internal state ratings at each time point (1–9). At time point 1, a Teflon catheter was inserted into an antecubital vein for blood sampling. Subsequent asterisks (*) indicate IV blood draws that occurred concomitant to internal state ratings. After time point 3, subjects ate either a fixed-portion meal (at the sated scan, consisting of 1 sandwich and 1 serving of apple slices for women, 1.5 sandwiches and 1 serving of apple slices for men) or nothing (at the hungry scan). T (time) = 0 indicates time of meal onset. Subjects made postmanipulation internal state ratings at time point 4 and then were taken to the scanner, outfitted with the stimulus delivery devices, and inserted into the bore. Internal state ratings and further blood samples were collected at T = 30, 60, and 90 min from meal onset. Perceptual ratings of the stimuli were collected as in the training session inside the scanner before and after scanning. After subjects were removed from the scanner, they were taken to a behavioral testing room, where they were presented with both flavors of milkshake followed by the tub of cheese pasta and instructed to eat ad libitum from both. Milkshake and pasta intake were recorded without the subjects' knowledge by weighing before and after consumption.
Figure 2.
Figure 2.
Anatomical masks of amygdala subregions and spheres encompassing the hypothalamus used in ROI analyses of fMRI data. Red, BLA; yellow, CMA; blue, SFA; green, hypothalamus (HYP).
Figure 3.
Figure 3.
Experimental manipulation of internal state. Subjective ratings of satiation under hungry and sated scan conditions significantly differed after the lunch manipulation. *p < 0.001.
Figure 4.
Figure 4.
Relationship between ΔBMI and amygdala response to the taste of palatable food. Predicted correlations (ROI analysis) between ΔBMI and BLA response to M > T at the sated scan that interact with genotype, with peaks at x, y, z = 39, −1, −23 (A) and x, y, z = 30, −7, −20 (B). Scatterplots show the relationship between ΔBMI and parameter estimates at the peak voxel in that region for A1+ and A1−. Note that, whereas there appears to be a negative correlation between BLA response and ΔBMI in A1+, this relationship does not meet criteria for statistical significance outside of the peak voxel. Color bars depict t-values. C, Histogram shows group differences in the relationship between ΔBMI and BLA response to M > T Sated. Bootstrapping was used to depict the observed sample distribution of the correlation coefficient separately for A1+ and A1−. Density on the y-axis reflects the likelihood of observing a particular correlation coefficient value (x-axis) and is higher if estimated correlations within groups are more homogenous. Lesser distribution overlap corresponds to stronger group differences.
Figure 5.
Figure 5.
Relationship between ΔBMI and amygdala response to the smell of palatable food. Predicted correlations (ROI analysis) between ΔBMI and BLA response to F > Ol at the hungry scan that interact with genotype in BLA with peak at x, y, z = 27, −1, −20 (A) and SFA with peak at x, y, z = 30, −1, −17 (C). Scatterplots show the relationship between ΔBMI and parameter estimates at the peak voxel. Color bars depict t-values. Histograms show group differences in the relationship between ΔBMI and brain response to F > Ol Hungry in BLA (B) and SFA (D). Bootstrapping was used to depict the observed sample distribution of the correlation coefficient separately for A1+ and A1−. Density on the y-axis reflects the likelihood of observing a particular correlation coefficient (x-axis) and is higher if estimated correlations within groups are more homogenous. Lesser distribution overlap corresponds to stronger group differences.
Figure 6.
Figure 6.
Correlation matrix of extracted amygdala parameter estimates. Values are correlation coefficients and are color coded (see color bar). Bolded values denote statistically significant (p < 0.05) correlations.
Figure 7.
Figure 7.
Dynamic causal modeling. A, Schematic of the seven dynamic causal models tested. A, BLA; H, hypothalamus. White text on black circles indicates input of Milkshake and Tasteless into that node. Arrows indicate directionality of intrinsic connections between nodes. B, Results of Bayesian model selection at Sated scan selecting Model 2 as the “winning” model. C, Results of Bayesian model selection at Hungry scan selects Model 3 as the “winning” model.
Figure 8.
Figure 8.
Ghrelin analyses. A, Mean decrease in plasma concentrations of total ghrelin at t = 30, t = 60, and t = 90 min after lunch onset at sated scan. Predicted correlations (ROI analysis) between extent of postprandial ghrelin suppression at t = 90 min after lunch onset at sated session and brain response to M > T at sated scan in BLA cluster with peak at x, y, z = −24, −7, −11 (B; R BLA cluster NS), and CMA clusters with peaks at x, y, z = −27, −10, −11 and x, y, z = 27, −10, −11 (C). Scatterplots show the relationship between postprandial ghrelin change at t = 90 min after lunch and parameter estimates at the peak voxel in that region. Color bars depict t-values.
Figure 9.
Figure 9.
Relationship between ΔBMI and caudate response to the taste of palatable food. A, Predicted correlation (ROI analysis) between ΔBMI and caudate response to M > T at hungry scan that interacts by genotype, with statistically significant cluster in caudate with peak at x, y, z = 18, 20, −5. Scatterplot shows the relationship between ΔBMI and parameter estimates at the peak voxel in that region. Color bars depict t-values. B, Histogram shows group differences in the relationship between ΔBMI and caudate response to M > T Hungry. Bootstrapping was used to depict the observed sample distribution of the correlation coefficient separately for A1+ and A1−. Density on the y-axis reflects the likelihood of observing a particular correlation coefficient value (x-axis) and is higher if estimated correlations within groups are more homogenous. Lesser distribution overlap corresponds to stronger group differences.

References

    1. Amunts K, Kedo O, Kindler M, Pieperhoff P, Mohlberg H, Shah NJ, Habel U, Schneider F, Zilles K. Cytoarchitectonic mapping of the human amygdala, hippocampal region and entorhinal cortex: intersubject variability and probability maps. Anat Embryol (Berl) 2005;210:343–352. doi: 10.1007/s00429-005-0025-5. - DOI - PubMed
    1. Babbs RK, Sun X, Felsted J, Chouinard-Decorte F, Veldhuizen MG, Small DM. Decreased caudate response to milkshake is associated with higher body mass index and greater impulsivity. Physiol Behav. 2013;121:103–111. doi: 10.1016/j.physbeh.2013.03.025. - DOI - PMC - PubMed
    1. Bartoshuk LM, Duffy VB, Green BG, Hoffman HJ, Ko CW, Lucchina LA, Marks LE, Snyder DJ, Weiffenbach JM. Valid across-group comparisons with labeled scales: the gLMS versus magnitude matching. Physiol Behav. 2004;82:109–114. doi: 10.1016/j.physbeh.2004.02.033. - DOI - PubMed
    1. Baxter MG, Murray EA. The amygdala and reward. Nat Rev Neurosci. 2002;3:563–573. doi: 10.1038/nrn875. - DOI - PubMed
    1. Beaver JD, Lawrence AD, van Ditzhuijzen J, Davis MH, Woods A, Calder AJ. Individual differences in reward drive predict neural responses to images of food. J Neurosci. 2006;26:5160–5166. doi: 10.1523/JNEUROSCI.0350-06.2006. - DOI - PMC - PubMed

Publication types

LinkOut - more resources