. 2015 Jun;10(6):887-903.
doi: 10.1038/nprot.2015.055. Epub 2015 May 21.

Multiplexed peptide analysis using data-independent acquisition and Skyline

Affiliations

Multiplexed peptide analysis using data-independent acquisition and Skyline

Jarrett D Egertson et al. Nat Protoc. 2015 Jun.

Abstract

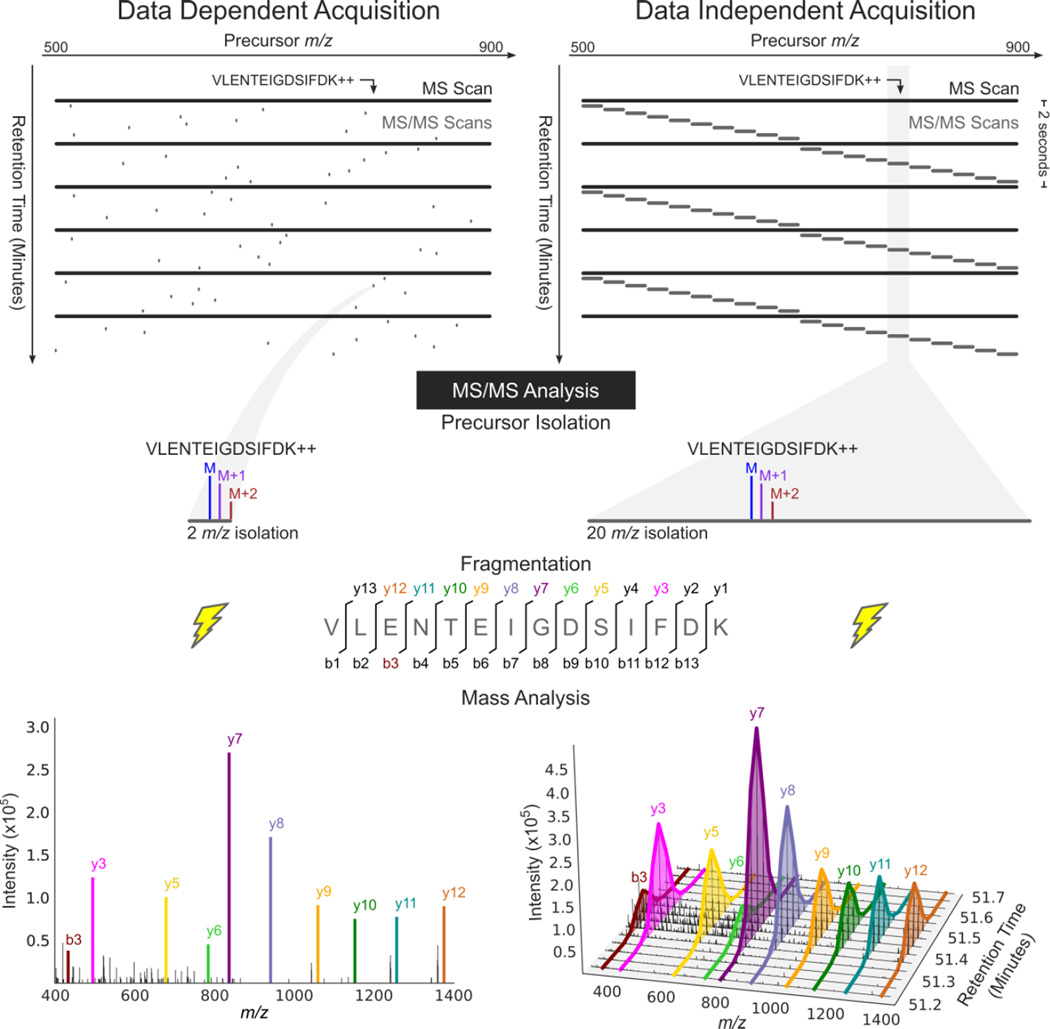
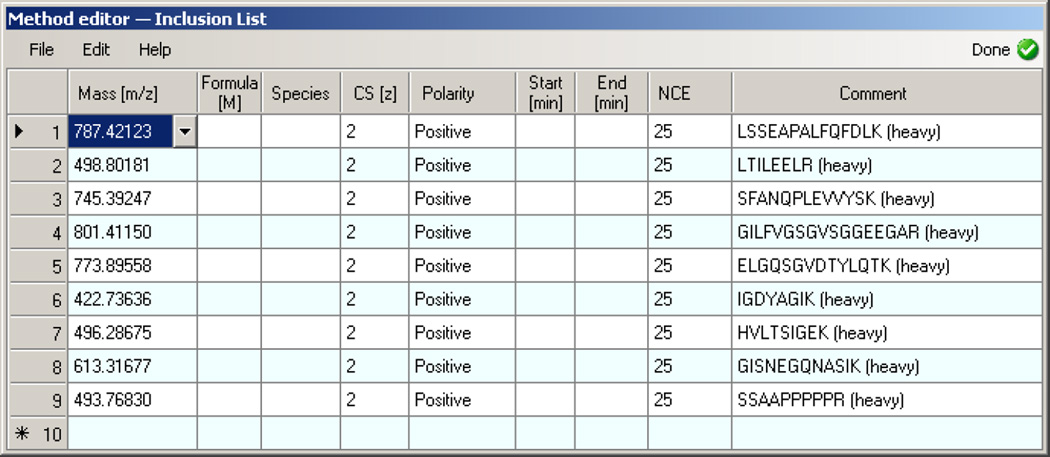
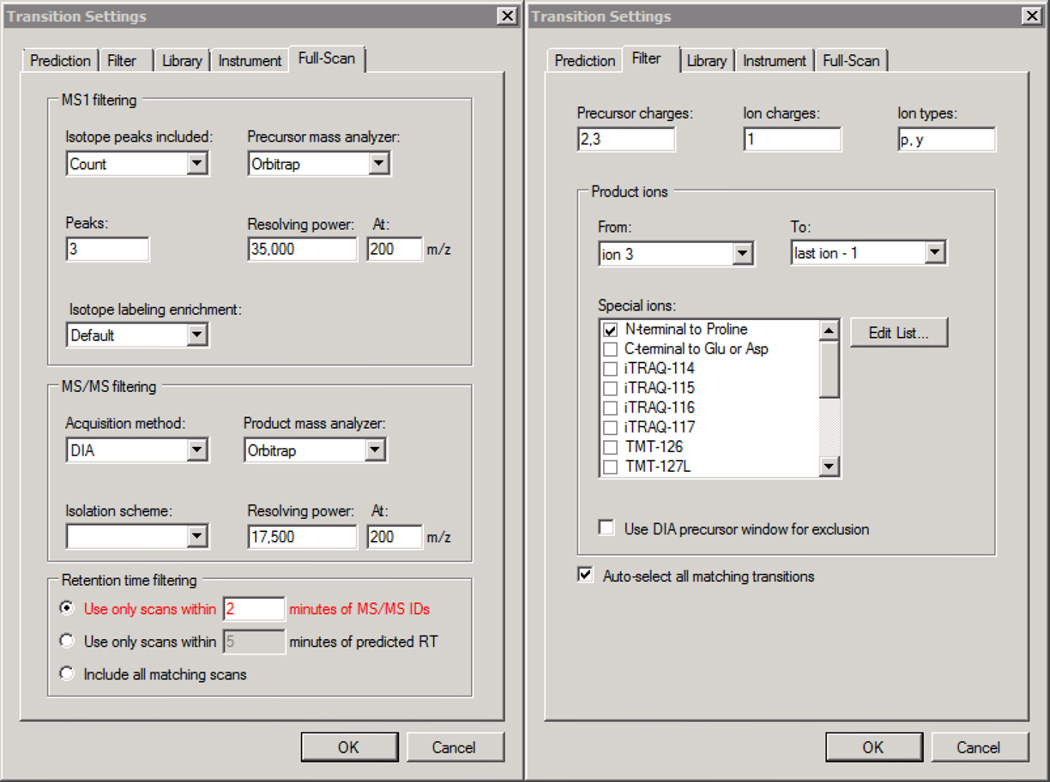
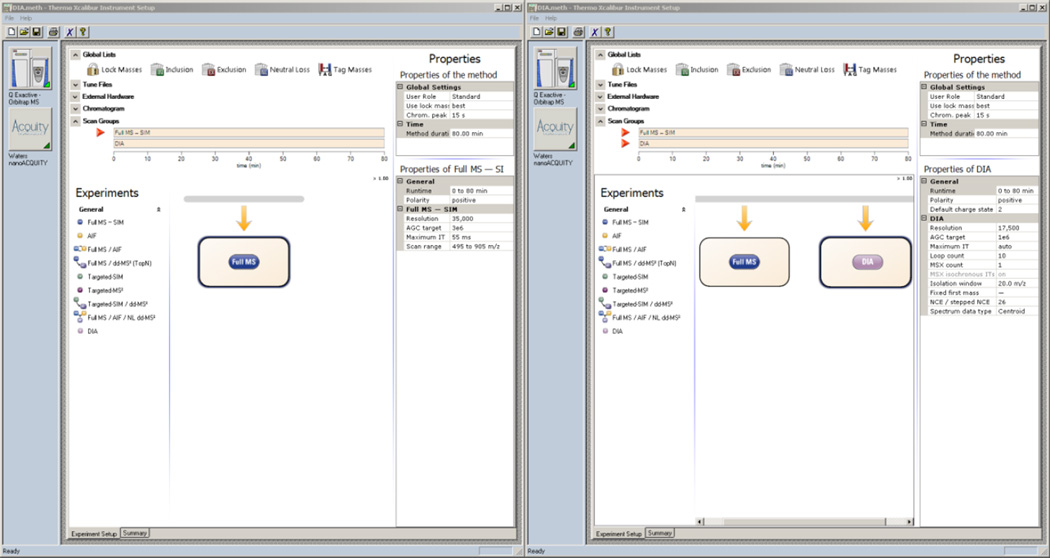
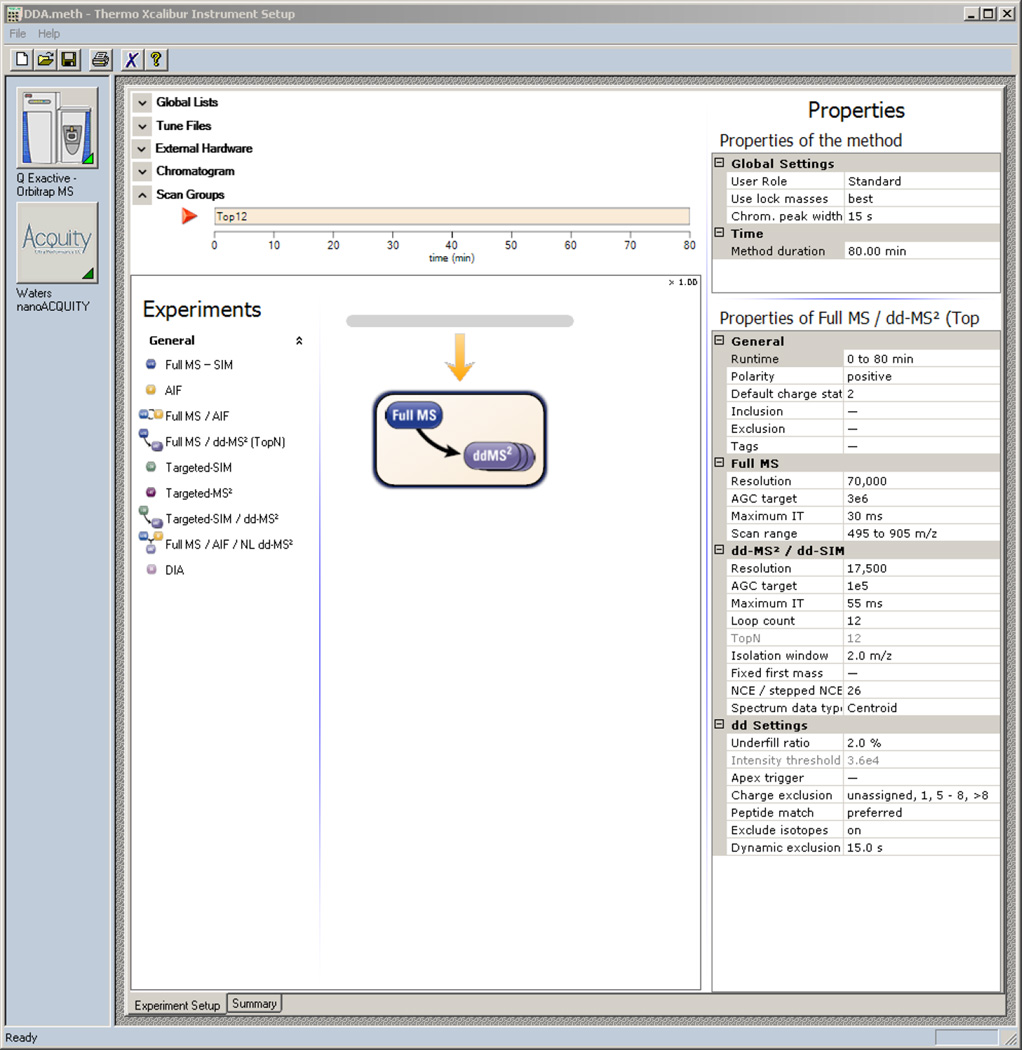
Here we describe the use of data-independent acquisition (DIA) on a Q-Exactive mass spectrometer for the detection and quantification of peptides in complex mixtures using the Skyline Targeted Proteomics Environment (freely available online at http://skyline.maccosslab.org). The systematic acquisition of mass spectrometry (MS) or tandem MS (MS/MS) spectra by DIA is in contrast to DDA, in which the acquired MS/MS spectra are only suitable for the identification of a stochastically sampled set of peptides. Similarly to selected reaction monitoring (SRM), peptides can be quantified from DIA data using targeted chromatogram extraction. Unlike SRM, data acquisition is not constrained to a predetermined set of target peptides. In this protocol, a spectral library is generated using data-dependent acquisition (DDA), and chromatograms are extracted from the DIA data for all peptides in the library. As in SRM, quantification using DIA data is based on the area under the curve of extracted MS/MS chromatograms. In addition, a quality control (QC) method suitable for DIA based on targeted MS/MS acquisition is detailed. Not including time spent acquiring data, and time for database searching, the procedure takes ∼1-2 h to complete. Typically, data acquisition requires roughly 1-4 h per sample, and a database search will take 0.5-2 h to complete.


Figures

Figure 1
Figure 1. MS/MS analysis in data dependent acquisition and data independent acquisition
DDA acquires MS/MS scans with narrow isolation windows centered on peptide precursors detected in an MS scan. DIA acquires MS/MS scans with wide isolation windows that do not target any particular peptide precursor. Instead, the scans are arranged side-by-side to collectively cover a desired precursor m/z range (500–900 m/z here) comprehensively. Fragment ion information for the peptide precursor VLENTEIGDSIFDK++ is present in a single MS/MS spectrum in a DDA analysis, but can be extracted over time from DIA data and used for quantification due to the repetitive MS/MS sampling cycle of DIA.
Figure 2
Figure 2. Skyline - QC Transition Filter and Full-Scan Settings
Figure 3
Figure 3. Skyline - Light Targets Selected
Figure 4
Figure 4. Xcalibur - QC Method Setup
Figure 5
Figure 5. Xcalibur - Insert Inclusion List
Figure 6
Figure 6. Skyline - DIA Full-Scan and Filter Settings
Figure 7
Figure 7. Xcalibur - DIA MS and MS2 Settings
Figure 8
Figure 8. Xcalibur - DDA Method
Figure 9
Figure 9. Skyline - QC Peptide GILFVGSGVSGGEEGAR++
The total fragment ion signal (integrated over time) for the peptide GILFVGSGVSGGEEGAR++ is plotted as a bar for each of four QC replicate injections (A). The contribution from each individual fragment ion is displayed as a different color in the bars. The retention time of the peptide is plotted for each of the four replicate injections as a group of vertical bars (B). Within each group, there are colored bars, one for each transition measured for the peptide. Each bar starts and stops at the integration boundaries (in retention time) of the detected chromatographic peak. The retention time at the peak, and full-width at half max (FWHM) for each transition peak are overlaid on each transition as a horizontal and vertical black line, respectively. The extracted signal for the peptide from a single replicate is plotted in C and D at different levels of zoom, with the mass measurement error and retention time of the most intense transition annotated above the peak. The vertical lines on either side of the peak in C indicate the integration boundaries for the peak.
Figure 10
Figure 10. Skyline - DIA Data: LGEHNIDVLEGNEQFINAAK+++
The extracted precursor (top) and fragment ion (bottom) signal extracted for the peptide precursor LGEHNIDVLEGNEQFINAAK+++ from DIA data acquired on a yeast sample digest using this protocol are plotted. The vertical lines on either side of the peak indicate the integration boundaries for the peak. The vertical blue line shows the retention time of the peptide identification contained in the spectral library generated from DDA data. The mass measurement error and retention time of the most intense transition (fragment ion data) or isotopic peak of (precursor data) for the peptide precursor are annotated above the chromatographic peak.
Figure 11
Figure 11. Skyline - DIA Settings for Spectral Library Refinement of Transitions
Figure 12
Figure 12. Skyline - QC Peptide LTILEELR++
The total fragment ion signal (integrated over time) for the peptide LTILEELR++ is plotted as a bar for each of four QC replicate injections (A). The contribution from each individual fragment ion is displayed as a different color in the bars. The retention time of the peptide is plotted for each of the four replicate injections as a group of vertical bars (B). Within each group, there are colored bars, one for each transition measured for the peptide. Each bar starts and stops at the integration boundaries (in retention time) of the detected chromatographic peak. The retention time at the peak, and full-width at half max (FWHM) for each transition peak are overlaid on each transition as a horizontal and vertical black line, respectively. The extracted signal for the peptide from a single replicate is plotted in C and D at different levels of zoom, with the mass measurement error and retention time of the most intense transition annotated above the peak. The vertical lines on either side of the peak in C indicate the integration boundaries for the peak.
Figure 13
Figure 13. Skyline - DIA Data: NYIIEELNVR++
The extracted precursor (top) and fragment ion (bottom) signal extracted for the peptide precursor NYIIEELNVR++ from DIA data acquired on a yeast sample digest using this protocol are plotted. The vertical lines on either side of the peak indicate the integration boundaries for the peak. The vertical blue line shows the retention time of the peptide identification contained in the spectral library generated from DDA data. The mass measurement error and retention time of the most intense transition (fragment ion data) or isotopic peak of (precursor data) for the peptide precursor are annotated above the chromatographic peak.
Figure 14
Figure 14. Skyline - DIA Data: TYAAEIAHNISAK
The extracted precursor (top) and fragment ion (bottom) signal extracted for the peptide precursor TYAAEIAHNISAK++ from DIA data acquired on a yeast sample digest using this protocol are plotted. The vertical lines on either side of the peak indicate the integration boundaries for the peak. The vertical blue line shows the retention time of the peptide identification contained in the spectral library generated from DDA data. The mass measurement error and retention time of the most intense transition (fragment ion data) or isotopic peak of (precursor data) for the peptide precursor are annotated above the chromatographic peak.
Figure 15
Figure 15. Skyline - DIA Data: VSLDDLQQSIEEDEDHVQST
The extracted precursor (top) and fragment ion (bottom) signal extracted for the peptide precursor VSLDDLQQSIEEDEDHVQST+++ from DIA data acquired on a yeast sample digest using this protocol are plotted. The vertical lines on either side of the peak indicate the integration boundaries for the peak. The vertical blue line shows the retention time of the peptide identification contained in the spectral library generated from DDA data. The mass measurement error and retention time of the most intense transition (fragment ion data) or isotopic peak of (precursor data) for the peptide precursor are annotated above the chromatographic peak.

References

    1. Purvine S, Eppel J-T, Yi EC, Goodlett DR. Shotgun collision-induced dissociation of peptides using a time of flight mass analyzer. Proteomics. 2003;3:847–850. - PubMed
    1. Venable JD, Dong M-Q, Wohlschlegel J, Dillin A, Yates JR. Automated approach for quantitative analysis of complex peptide mixtures from tandem mass spectra. Nat. Methods. 2004;1:39–45. - PubMed
    1. Law KP, Lim YP. Recent advances in mass spectrometry: data independent analysis and hyper reaction monitoring. Expert Rev. Proteomics. 2013;10:551–566. - PubMed
    1. Gillet LC, et al. Targeted data extraction of the MS/MS spectra generated by data-independent acquisition: a new concept for consistent and accurate proteome analysis. Mol. Cell. Proteomics MCP. 2012;11 O111.016717. - PMC - PubMed
    1. Stahl-Zeng J, et al. High Sensitivity Detection of Plasma Proteins by Multiple Reaction Monitoring of N-Glycosites. Mol. Cell. Proteomics. 2007;6:1809–1817. - PubMed

Publication types