

Nutrient Excess and AMPK Downregulation in Incubated Skeletal Muscle and Muscle of Glucose Infused Rats
- PMID: 25996822
- PMCID: PMC4440828
- DOI: 10.1371/journal.pone.0127388
Nutrient Excess and AMPK Downregulation in Incubated Skeletal Muscle and Muscle of Glucose Infused Rats
Abstract
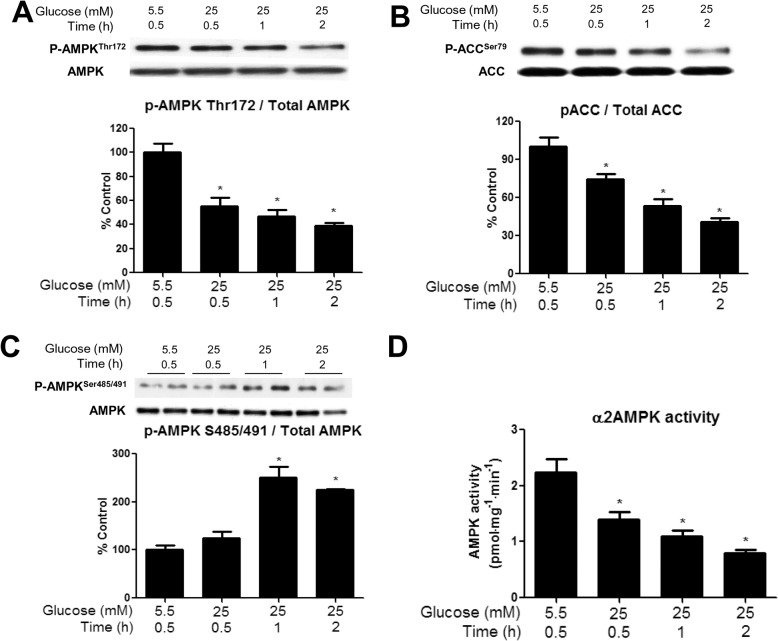
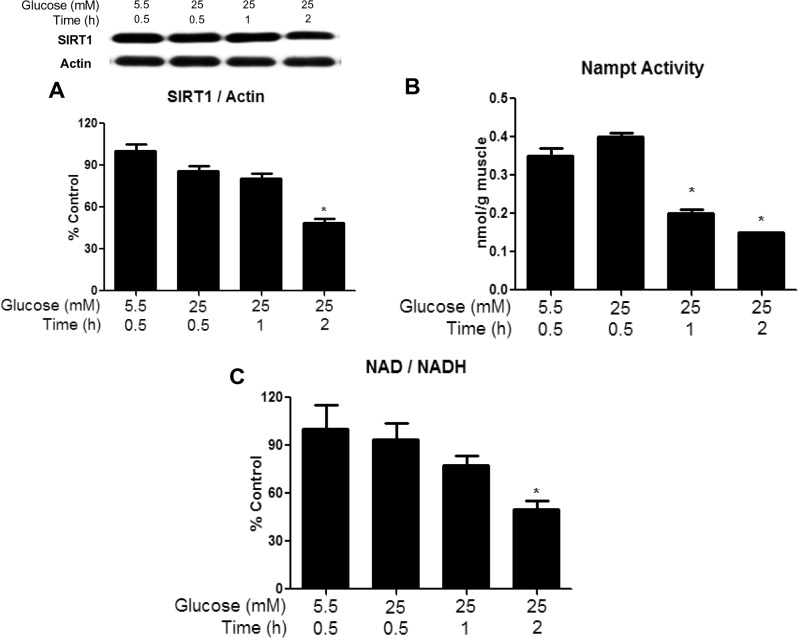
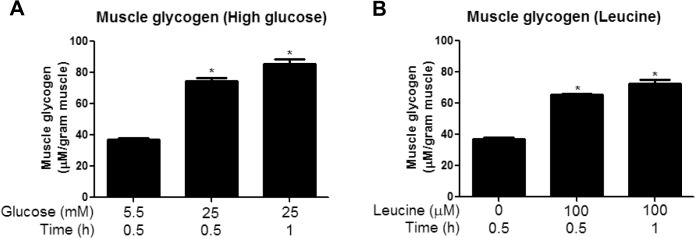
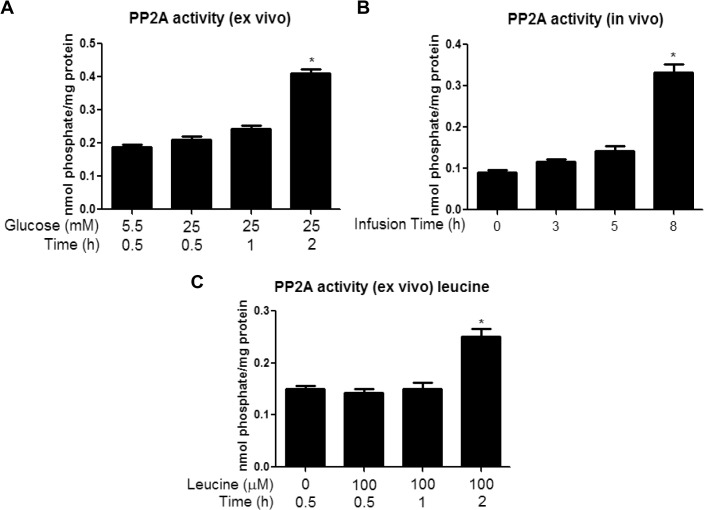
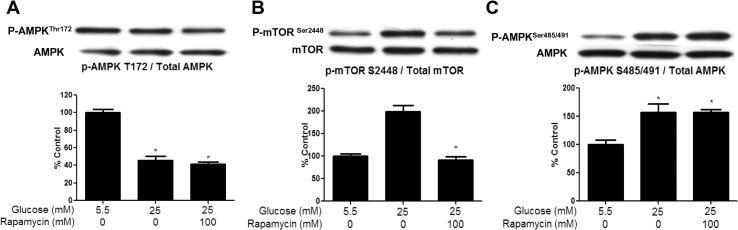
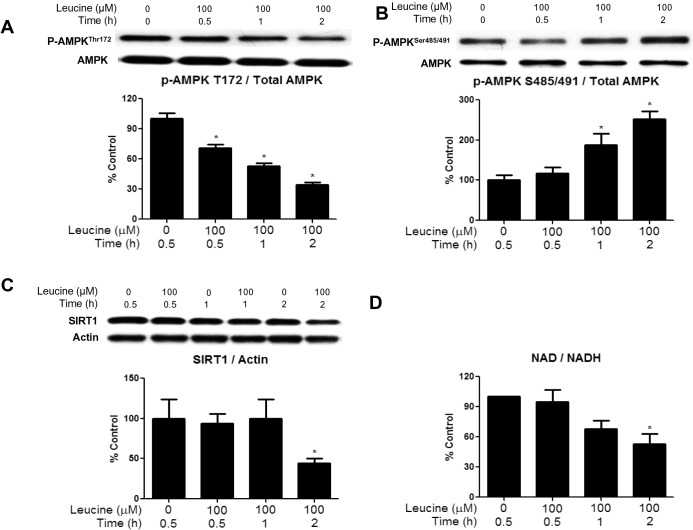
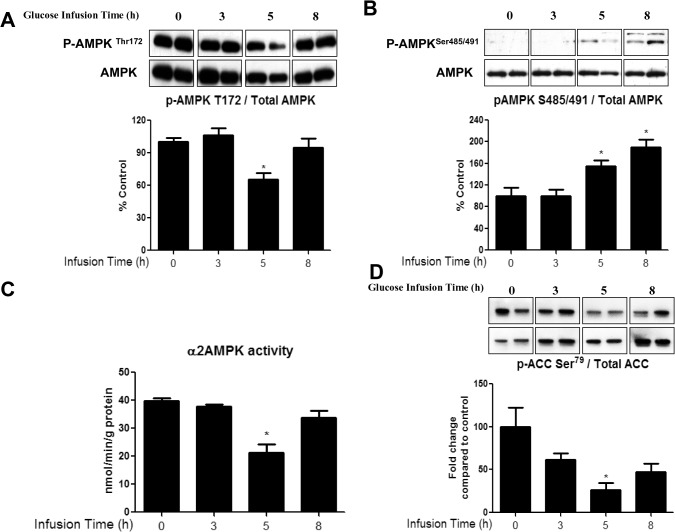
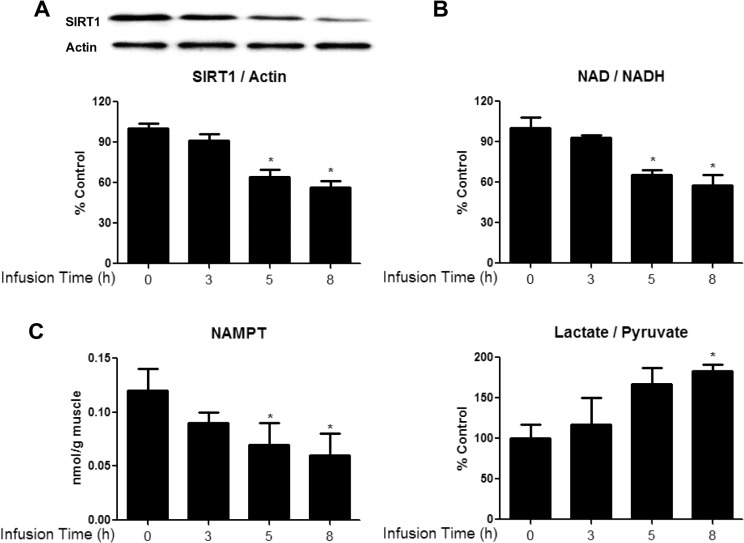
We have previously shown that incubation for 1h with excess glucose or leucine causes insulin resistance in rat extensor digitorum longus (EDL) muscle by inhibiting AMP-activated protein kinase (AMPK). To examine the events that precede and follow these changes, studies were performed in rat EDL incubated with elevated levels of glucose or leucine for 30min-2h. Incubation in high glucose (25mM) or leucine (100μM) significantly diminished AMPK activity by 50% within 30min, with further decreases occurring at 1 and 2h. The initial decrease in activity at 30min coincided with a significant increase in muscle glycogen. The subsequent decreases at 1h were accompanied by phosphorylation of αAMPK at Ser485/491, and at 2h by decreased SIRT1 expression and increased PP2A activity, all of which have previously been shown to diminish AMPK activity. Glucose infusion in vivo, which caused several fold increases in plasma glucose and insulin, produced similar changes but with different timing. Thus, the initial decrease in AMPK activity observed at 3h was associated with changes in Ser485/491 phosphorylation and SIRT1 expression and increased PP2A activity was a later event. These findings suggest that both ex vivo and in vivo, multiple factors contribute to fuel-induced decreases in AMPK activity in skeletal muscle and the insulin resistance that accompanies it.
Conflict of interest statement
Figures
Similar articles
-
Enhanced muscle fat oxidation and glucose transport by ACRP30 globular domain: acetyl-CoA carboxylase inhibition and AMP-activated protein kinase activation.Proc Natl Acad Sci U S A. 2002 Dec 10;99(25):16309-13. doi: 10.1073/pnas.222657499. Epub 2002 Nov 27. Proc Natl Acad Sci U S A. 2002. PMID: 12456889 Free PMC article.
-
Short-term adenosine monophosphate-activated protein kinase activator 5-aminoimidazole-4-carboxamide-1-β-D-ribofuranoside treatment increases the sirtuin 1 protein expression in skeletal muscle.Metabolism. 2011 Mar;60(3):394-403. doi: 10.1016/j.metabol.2010.03.003. Epub 2010 Apr 1. Metabolism. 2011. PMID: 20362304
-
Activation of the AMPK/Sirt1 pathway by a leucine-metformin combination increases insulin sensitivity in skeletal muscle, and stimulates glucose and lipid metabolism and increases life span in Caenorhabditis elegans.Metabolism. 2016 Nov;65(11):1679-1691. doi: 10.1016/j.metabol.2016.06.011. Epub 2016 Jul 9. Metabolism. 2016. PMID: 27456392
-
Insulin resistance due to nutrient excess: is it a consequence of AMPK downregulation?Cell Cycle. 2011 Oct 15;10(20):3447-51. doi: 10.4161/cc.10.20.17886. Cell Cycle. 2011. PMID: 22067655 Free PMC article. Review.
-
[The role of SIRT1 in the pathogenesis of insulin resistance in skeletal muscle].Postepy Hig Med Dosw (Online). 2015 Jan 16;69:63-8. doi: 10.5604/17322693.1136379. Postepy Hig Med Dosw (Online). 2015. PMID: 25614674 Review. Polish.
Cited by
-
Daily Overfeeding from Protein and/or Carbohydrate Supplementation for Eight Weeks in Conjunction with Resistance Training Does not Improve Body Composition and Muscle Strength or Increase Markers Indicative of Muscle Protein Synthesis and Myogenesis in Resistance-Trained Males.J Sports Sci Med. 2016 Feb 23;15(1):17-25. eCollection 2016 Mar. J Sports Sci Med. 2016. PMID: 26957922 Free PMC article.
-
PGBR extract ameliorates TNF-α induced insulin resistance in hepatocytes.Kaohsiung J Med Sci. 2018 Jan;34(1):14-21. doi: 10.1016/j.kjms.2017.08.009. Epub 2017 Sep 19. Kaohsiung J Med Sci. 2018. PMID: 29310812 Free PMC article.
-
Protein kinase C phosphorylates AMP-activated protein kinase α1 Ser487.Biochem J. 2016 Dec 15;473(24):4681-4697. doi: 10.1042/BCJ20160211. Epub 2016 Oct 26. Biochem J. 2016. PMID: 27784766 Free PMC article.
-
Knockdown of GSK3β increases basal autophagy and AMPK signalling in nutrient-laden human aortic endothelial cells.Biosci Rep. 2016 Sep 16;36(5):e00382. doi: 10.1042/BSR20160174. Print 2016 Oct. Biosci Rep. 2016. PMID: 27534430 Free PMC article.
-
AICAR and nicotinamide treatment synergistically augment the proliferation and attenuate senescence-associated changes in mesenchymal stromal cells.Stem Cell Res Ther. 2020 Feb 3;11(1):45. doi: 10.1186/s13287-020-1565-6. Stem Cell Res Ther. 2020. PMID: 32014016 Free PMC article.
References
-
- Hager SR, Jochen AL, Kalkhoff RK. Insulin resistance in normal rats infused with glucose for 72 h. Am J Physiol. 1991;260(3 Pt 1):E353–62. Epub 1991/03/01. . - PubMed
-
- Ido Y, Carling D, Ruderman N. Hyperglycemia-induced apoptosis in human umbilical vein endothelial cells: inhibition by the AMP-activated protein kinase activation. Diabetes. 2002;51(1):159–67. Epub 2002/01/05. . - PubMed
-
- Laybutt DR, Chisholm DJ, Kraegen EW. Specific adaptations in muscle and adipose tissue in response to chronic systemic glucose oversupply in rats. Am J Physiol. 1997;273(1 Pt 1):E1–9. Epub 1997/07/01. . - PubMed
-
- Kurowski TG, Lin Y, Luo Z, Tsichlis PN, Buse MG, Heydrick SJ, et al. Hyperglycemia inhibits insulin activation of Akt/protein kinase B but not phosphatidylinositol 3-kinase in rat skeletal muscle. Diabetes. 1999;48(3):658–63. Epub 1999/03/17. . - PubMed
-
- Itani SI, Saha AK, Kurowski TG, Coffin HR, Tornheim K, Ruderman NB. Glucose autoregulates its uptake in skeletal muscle: involvement of AMP-activated protein kinase. Diabetes. 2003;52(7):1635–40. Epub 2003/06/28. . - PubMed
Publication types
MeSH terms
Substances
Grants and funding
LinkOut - more resources
Full Text Sources
Other Literature Sources
Molecular Biology Databases
