

Traffic, air pollution, minority and socio-economic status: addressing inequities in exposure and risk
- PMID: 25996888
- PMCID: PMC4454972
- DOI: 10.3390/ijerph120505355
Traffic, air pollution, minority and socio-economic status: addressing inequities in exposure and risk
Abstract
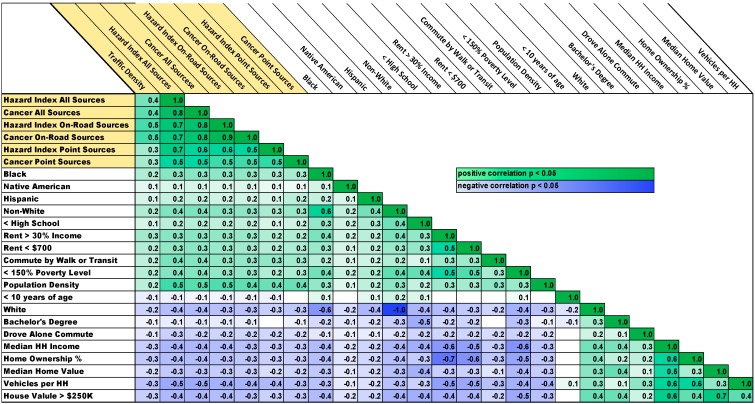
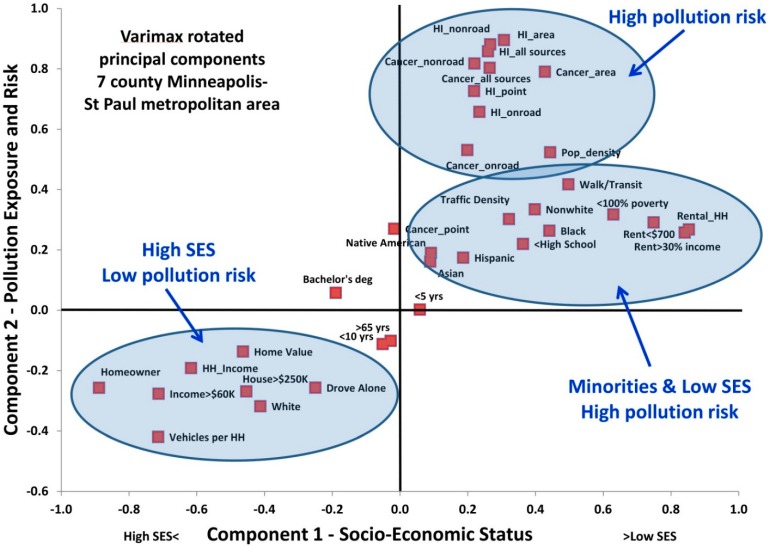
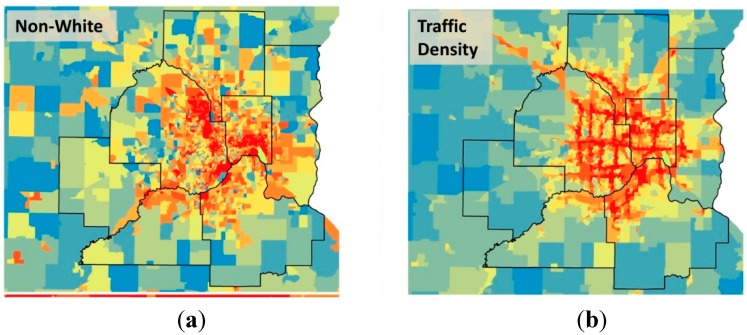
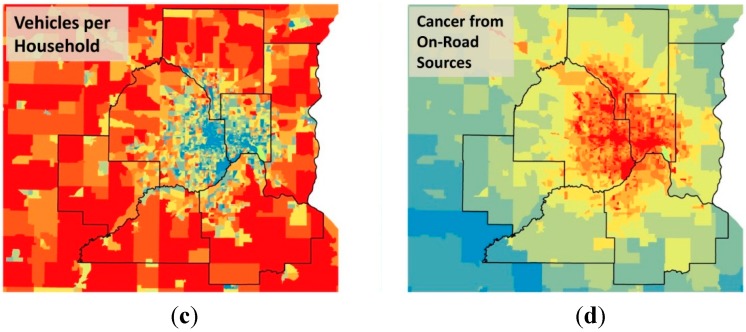
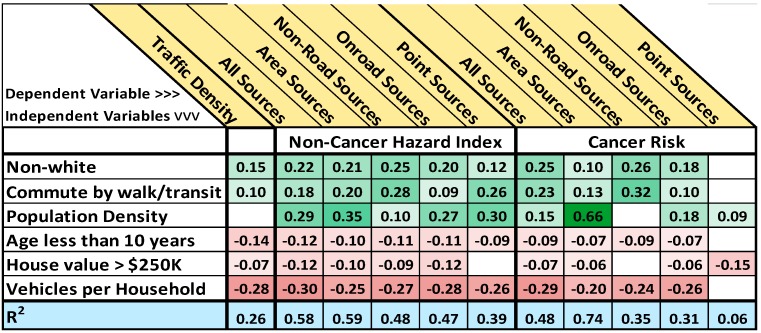
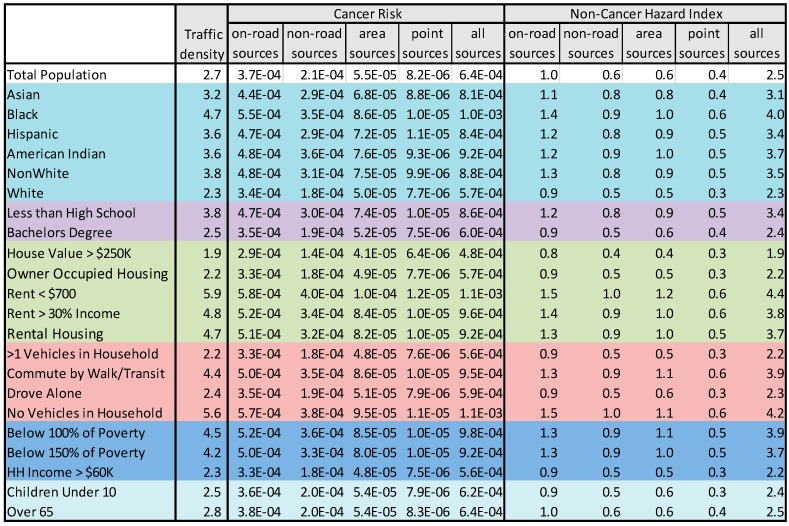
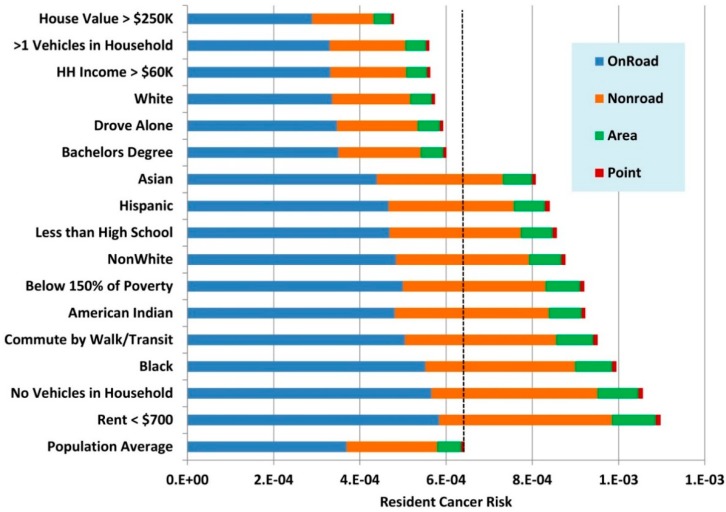
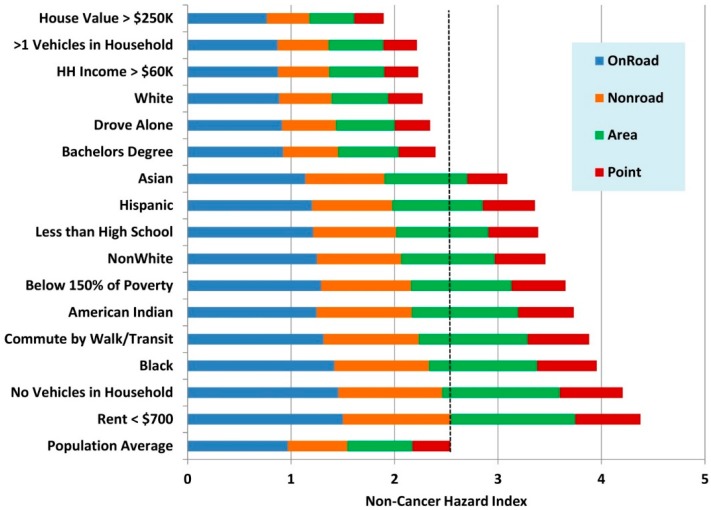
Higher levels of nearby traffic increase exposure to air pollution and adversely affect health outcomes. Populations with lower socio-economic status (SES) are particularly vulnerable to stressors like air pollution. We investigated cumulative exposures and risks from traffic and from MNRiskS-modeled air pollution in multiple source categories across demographic groups. Exposures and risks, especially from on-road sources, were higher than the mean for minorities and low SES populations and lower than the mean for white and high SES populations. Owning multiple vehicles and driving alone were linked to lower household exposures and risks. Those not owning a vehicle and walking or using transit had higher household exposures and risks. These results confirm for our study location that populations on the lower end of the socio-economic spectrum and minorities are disproportionately exposed to traffic and air pollution and at higher risk for adverse health outcomes. A major source of disparities appears to be the transportation infrastructure. Those outside the urban core had lower risks but drove more, while those living nearer the urban core tended to drive less but had higher exposures and risks from on-road sources. We suggest policy considerations for addressing these inequities.
Keywords: air pollution risk; environmental justice; socio-economic status; traffic.
Figures
Similar articles
-
Multicity study of air pollution and mortality in Latin America (the ESCALA study).Res Rep Health Eff Inst. 2012 Oct;(171):5-86. Res Rep Health Eff Inst. 2012. PMID: 23311234
-
Environmental injustice and sexual minority health disparities: A national study of inequitable health risks from air pollution among same-sex partners.Soc Sci Med. 2017 Oct;191:38-47. doi: 10.1016/j.socscimed.2017.08.040. Epub 2017 Sep 6. Soc Sci Med. 2017. PMID: 28888127 Free PMC article.
-
The London low emission zone baseline study.Res Rep Health Eff Inst. 2011 Nov;(163):3-79. Res Rep Health Eff Inst. 2011. PMID: 22315924
-
[Health risk assessment of traffic-related air pollution near busy roads].Rev Epidemiol Sante Publique. 2012 Aug;60(4):321-30. doi: 10.1016/j.respe.2012.02.007. Epub 2012 Jul 4. Rev Epidemiol Sante Publique. 2012. PMID: 22770751 Review. French.
-
Air pollution health risks: do class and race matter?Toxicol Ind Health. 1993 Sep-Oct;9(5):843-78. doi: 10.1177/074823379300900509. Toxicol Ind Health. 1993. PMID: 8184446 Review.
Cited by
-
Translator Exposure APIs: Open Access to Data on Airborne Pollutant Exposures, Roadway Exposures, and Socio-Environmental Exposures and Use Case Application.Int J Environ Res Public Health. 2020 Jul 21;17(14):5243. doi: 10.3390/ijerph17145243. Int J Environ Res Public Health. 2020. PMID: 32708093 Free PMC article.
-
Understanding the Spatial-Temporal Patterns and Influential Factors on Air Quality Index: The Case of North China.Int J Environ Res Public Health. 2019 Aug 7;16(16):2820. doi: 10.3390/ijerph16162820. Int J Environ Res Public Health. 2019. PMID: 31394837 Free PMC article.
-
Disparities in greenspace associated with sleep duration among adolescent children in Southern California.Environ Epidemiol. 2023 Aug 1;7(4):e264. doi: 10.1097/EE9.0000000000000264. eCollection 2023 Aug. Environ Epidemiol. 2023. PMID: 37545810 Free PMC article.
-
Location-specific strategies for eliminating US national racial-ethnic [Formula: see text] exposure inequality.Proc Natl Acad Sci U S A. 2022 Nov;119(44):e2205548119. doi: 10.1073/pnas.2205548119. Epub 2022 Oct 24. Proc Natl Acad Sci U S A. 2022. PMID: 36279443 Free PMC article.
-
Fine Particulate Air Pollution, Public Service, and Under-Five Mortality: A Cross-Country Empirical Study.Healthcare (Basel). 2020 Aug 14;8(3):271. doi: 10.3390/healthcare8030271. Healthcare (Basel). 2020. PMID: 32823932 Free PMC article.
References
MeSH terms
Substances
LinkOut - more resources
Full Text Sources
Other Literature Sources
Medical
