. 2015 May 21;11(5):e1005263.
doi: 10.1371/journal.pgen.1005263. eCollection 2015 May.

Feeding and Fasting Signals Converge on the LKB1-SIK3 Pathway to Regulate Lipid Metabolism in Drosophila

Affiliations

Feeding and Fasting Signals Converge on the LKB1-SIK3 Pathway to Regulate Lipid Metabolism in Drosophila

Sekyu Choi et al. PLoS Genet. .

Abstract

LKB1 plays important roles in governing energy homeostasis by regulating AMP-activated protein kinase (AMPK) and other AMPK-related kinases, including the salt-inducible kinases (SIKs). However, the roles and regulation of LKB1 in lipid metabolism are poorly understood. Here we show that Drosophila LKB1 mutants display decreased lipid storage and increased gene expression of brummer, the Drosophila homolog of adipose triglyceride lipase (ATGL). These phenotypes are consistent with those of SIK3 mutants and are rescued by expression of constitutively active SIK3 in the fat body, suggesting that SIK3 is a key downstream kinase of LKB1. Using genetic and biochemical analyses, we identify HDAC4, a class IIa histone deacetylase, as a lipolytic target of the LKB1-SIK3 pathway. Interestingly, we found that the LKB1-SIK3-HDAC4 signaling axis is modulated by dietary conditions. In short-term fasting, the adipokinetic hormone (AKH) pathway, related to the mammalian glucagon pathway, inhibits the kinase activity of LKB1 as shown by decreased SIK3 Thr196 phosphorylation, and consequently induces HDAC4 nuclear localization and brummer gene expression. However, under prolonged fasting conditions, AKH-independent signaling decreases the activity of the LKB1-SIK3 pathway to induce lipolytic responses. We also identify that the Drosophila insulin-like peptides (DILPs) pathway, related to mammalian insulin pathway, regulates SIK3 activity in feeding conditions independently of increasing LKB1 kinase activity. Overall, these data suggest that fasting stimuli specifically control the kinase activity of LKB1 and establish the LKB1-SIK3 pathway as a converging point between feeding and fasting signals to control lipid homeostasis in Drosophila.


Conflict of interest statement

The authors have declared that no competing interests exist.

Figures
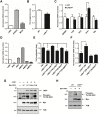
Fig 1
Fig 1. LKB1 and its downstream kinase SIK3 are required for lipid homeostasis.
(A) qPCR analysis of LKB1 and its cofactors required for the catalytic activity, STRAD and MO25, in Drosophila larvae under feeding condition. (B) TAG amounts of wild-type and LKB1 mutant larvae (n = 10 per genotype). (C) qPCR analysis for lipogenic genes (SREBP, FAS and ACC) and lipolytic genes (bmm and HSL) in wild-type and LKB1 mutant larvae at mid-to-late L2 (60 hr AEL) stage under feeding conditions. (D) qPCR analysis of LKB1, SIKs (SIK2 and SIK3), and AMPK complex (AMPKα, AMPKβ, and AMPKγ) in larvae. (E) TAG amounts in LKB1 mutants following fat body-specific expression of wild-type, kinase-dead (K201I) LKB1, constitutively active (T196E) SIK3 or constitutively active (T184D) AMPK. Genotypes are as follows: FB> (FB-Gal4/+), LKB1X5,FB> (FB-Gal4/+;LKB1 X5 /LKB1 X5), LKB1X5,FB>LKB1WT (FB-Gal4/UAS-LKB1;LKB1 X5 /LKB1 X5), LKB1X5,FB>LKB1KI (FB-Gal4/UAS-LKB1 K201I;LKB1 X5 /LKB1 X5), LKB1X5,FB>SIK3TE (FB-Gal4/UAS-SIK3 T196E;LKB1 X5 /LKB1 X5), and LKB1X5,FB>AMPKTD (FB-Gal4/UAS-AMPK T184D;LKB1 X5 /LKB1 X5) (n = 10 per genotype). (F) qPCR analysis of bmm gene expression in LKB1 mutants following fat body-specific expression of wild-type LKB1 or constitutively active (T196E) SIK3 at mid-to-late L2 stage under feeding condition. Genotypes are as follows: FB> (FB-Gal4/+), LKB1X5,FB> (FB-Gal4/+;LKB1 X5 /LKB1 X5), LKB1X5,FB>LKB1WT (FB-Gal4/UAS-LKB1;LKB1 X5 /LKB1 X5), and LKB1X5,FB>SIK3TE (FB-Gal4/UAS-SIK3 T196E;LKB1 X5 /LKB1 X5). (G) Immunoblot analyses showing the effect of LKB1 on Thr196 phosphorylation of SIK3 protein in larvae. Wild-type and kinase-dead (K70M) SIK3 were highly phosphorylated at Thr196 by LKB1 (second panel). SIK3T196A was used as a control. FB-Gal4 was used to drive transgene expression in the fat body. (H) Immunoblot analyses showing relative amounts of SIK3 Thr196 phosphorylation in wild-type and LKB1 X5 mutant larvae. The phosphorylation was absolutely dependent on LKB1 (first panel). FB-Gal4 was used to drive transgene expression. (G-H) Anti-LKB1, -phospho-Thr196 SIK3, -Myc (SIK3 protein), and -β-tubulin (TUB) antibodies were used. Data are presented as mean ± SEM (*P < 0.05).
Fig 2
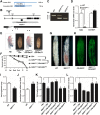
Fig 2. SIK3 null mutant is defective in lipid homeostasis and storage.
(A) Amino acid sequence identities (similarities) of Drosophila SIK3 with human SIK3. (B) Genomic map of Drosophila SIK3 locus. The exons of SIK3 are indicated by boxes, and the coding regions are colored black. The deleted regions for SIK3 null mutants (SIK3 Δ5–31) are also presented. (C) Genomic PCR analyses in wild-type (WT), heterozygous SIK3 mutants (SIK3 Δ5–31/+) and SIK3 Δ5–31 using the A primer set in (B). (D) qPCR analysis for SIK3, using the B primer set in (B), and CG15071 in wild-type and SIK3 null mutant. (E) Restored viability of SIK3 mutants by fat body-specific expression of wild-type SIK3, but not by kinase-dead (K70M) SIK3. (F) Relative survival rates in SIK3 mutants with fat body-specific expression of wild-type and kinase-dead (K70M) SIK3 during development: embryo (E), first, second and third instar larva, pupa (P) and adult (A). Experimental and control survival rates are compared using the log-rank test (***P < 0.001). (E-F) Genotypes are as follows: FB> (FB-Gal4/+), SIK3Δ5–31,FB> (FB-Gal4,SIK3 Δ5–31 /SIK3 Δ5–31), SIK3Δ5–31,FB>SIK3WT (FB-Gal4,SIK3 Δ5–31 /SIK3 Δ5–31 ;UAS-SIK3/+), and SIK3Δ5–31,FB>SIK3KM (FB-Gal4,SIK3 Δ5–31 /SIK3 Δ5–31 ;UAS-SIK3 K70M/+). (G) Wild-type and SIK3 null mutant in the L3 larval stage. (H) EGFP expression in the fat body of wild-type and SIK3 null mutant larvae. Genotypes are as follows: FB>EGFP (FB-Gal4/UAS-2xEGFP) and SIK3Δ5–31,FB>EGFP (FB-Gal4,SIK3 Δ5–31 /SIK3 Δ5–31,UAS-2xEGFP). (I) TAG amounts of wild-type and SIK3 null mutant larvae (n = 10 per genotype). (J) qPCR analysis of bmm in wild-type and SIK3 null mutant larvae at mid-L2 stage under feeding condition. (K) TAG amounts in SIK3 mutants with fat body-specific expression of wild-type, constitutively active (T196E), non-phosphorylable by LKB1 (T196A) or kinase-dead (K70M) SIK3. (n = 10 per genotype). (L) qPCR analysis of bmm in SIK3 mutants following fat body-specific expression of wild-type, constitutively active (T196E) SIK3 or two kinase-dead SIK3 (T196A and K70M) at mid-L2 stage under feeding condition. (K-L) Genotypes are as follows: FB> (FB-Gal4/+), SIK3Δ5–31,FB> (FB-Gal4,SIK3 Δ5–31 /SIK3 Δ5–31), SIK3Δ5–31,FB>SIK3WT (FB-Gal4,SIK3 Δ5–31 /SIK3 Δ5–31 ;UAS-SIK3/+), SIK3Δ5–31,FB>SIK3TE (FB-Gal4,SIK3 Δ5–31 /SIK3 Δ5–31 ;UAS-SIK3 T196E/+), SIK3Δ5–31,FB>SIK3TA (FB-Gal4,SIK3 Δ531 /SIK3 Δ5–31 ;UAS-SIK3 T196A/+), and SIK3Δ5–31,FB>SIK3KM (FB-Gal4,SIK3 Δ5–31 /SIK3 Δ5–31 ;UAS-SIK3 K70M/+). Data are presented as mean ± SEM (*P < 0.05; ***P < 0.001).
Fig 3
Fig 3. HDAC4 is the responsible target of LKB1-SIK3 signaling for controlling lipid homeostasis.
(A-B) Effects of the fat body-specific knockdown of HDAC4 (HDAC4 RNAi) on TAG amounts (A) and bmm gene expression (B) in LKB1 and SIK3 null mutants. Genotypes are as follows: FB> (FB-Gal4/+), LKB1X5,FB> (FB-Gal4/+;LKB1 X5 /LKB1 X5), SIK3Δ5–31,FB> (FB-Gal4,SIK3 Δ5–31 /SIK3 Δ5–31), FB>HDAC4 RNAi (FB-Gal4/+;UAS-HDAC4 RNAi/+), LKB1X5,FB>HDAC4 RNAi (FB-Gal4/+;LKB1 X5 /LKB1 X5,UAS-HDAC4 RNAi), and SIK3Δ5–31,FB>HDAC4 RNAi (FB-Gal4,SIK3 Δ5–31 /SIK3 Δ5–31 ;UAS-HDAC4 RNAi). (C) Drosophila HDAC4 protein structure showing three SIK3 phosphorylation sites and an HDAC class IIa domain (top panel). Immunoblot analyses showing the effect of wild-type and constitutively active (T196E) SIK3 on HDAC4 Ser239 phosphorylation in larvae (middle four panels). Densitometric analyses of phospho-HDAC4 bands (bottom panel). FB-Gal4 was used to drive transgene expression. Anti-phospho-Ser239 HDAC4, -FLAG (HDAC protein), -Myc (SIK3 protein), and -β-tubulin (TUB) antibodies were used. (D) Immunohistochemical analyses of HDAC4 (anti-FLAG antibody, green) in the fat body cells of wild type (first, second, and third rows), LKB1 mutant (LKB1 X5) (fourth row) and SIK3 mutant (SIK3 Δ5–31) (fifth row) L3 larvae in feeding or 4 hr fasting condition as denoted in figures. Similar experiments were also conducted for phosphorylation-defective and constitutively active HDAC4 (HDAC3A) in wild type L3 larvae in feeding (sixth row) or 4 hr fasting condition (bottom row). Cell nuclei were stained by Hoechst 33258 (blue). The graphs on the right of each image showed the intensity plot profile for each antibody staining along the red lines. Genotypes are as follows: Control (FB-Gal4/+), FLAG-HDAC4 (FB-Gal4/UAS-HDAC4), FLAG-HDAC43A (FB-Gal4/UAS-HDAC4 3A), FLAG-HDAC4,LKB1X5 (FB-Gal4/UAS-HDAC4;LKB1 X5/LKB1 X5), and FLAG-HDAC4,SIK3Δ5–31 (FB-Gal4,SIK3 Δ5–31/UAS-HDAC4,SIK3 Δ5–31). Scale bars, 20 μm. (E) Effect of fat body-specific expression of constitutively active SIK3 (SIK3 T196E) on bmm gene expression in larvae expressing wild-type HDAC4 in the fat body. Genotypes are as follows: FB> (FB-Gal4/+), FB>HDAC4WT (FB-Gal4/UAS-HDAC4), FB>SIK3TE (FB-Gal4/+;UAS-SIK3 T196E/+), and FB>HDAC4 WT,SIK3TE (FB-Gal4/UAS-HDAC4;UAS-SIK3 T196E/+). (F-G) Effects of the fat body-specific knockdown of bmm (bmm RNAi) on TAG amounts (F) and bmm gene expression (G) in LKB1 and SIK3 null mutants. Genotypes are as follows: FB> (FB-Gal4/+), LKB1X5,FB> (FB-Gal4/+;LKB1 X5 /LKB1 X5), SIK3Δ5–31,FB> (FB-Gal4,SIK3 Δ5–31 /SIK3 Δ5–31), FB>bmm RNAi (FB-Gal4/;UAS-bmm RNAi/+), LKB1X5,FB>bmm RNAi (FB-Gal4/+;LKB1 X5 /LKB1 X5,UAS-bmm RNAi) and SIK3Δ5–31,FB>bmm RNAi (FB-Gal4,SIK3 Δ5–31 /SIK3 Δ5–31 ;UAS-bmm RNAi). Data are presented as mean ± SEM (*P < 0.05; **P < 0.01; ***P < 0.001).
Fig 4
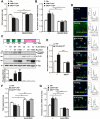
Fig 4. The AKH pathway regulates LKB1-SIK3-HDAC4 signaling to control lipid homeostasis.
(A-B) Effects of AKHR gene disruption on TAG amounts (A) and bmm gene expression (B) in LKB1 and SIK3 null mutants. Genotypes are as follows: WT (w 1118), LKB1X5 (LKB1 X5/LKB1 X5), SIK3Δ5–31 (SIK3 Δ5–31 /SIK3 Δ5–31), AKHR1 (AKHR 1 /AKHR 1), LKB1X5,AKHR1 (AKHR 1 /AKHR 1;LKB1 X5/LKB1 X5), and SIK3Δ5–31,AKHR1 (SIK3 Δ5–31,AKHR 1 /SIK3 Δ5–31,AKHR 1). (C) Immunoblot analyses showing the effect of 4 hr fasting and AKH on Thr196 phosphorylation of SIK3 protein in larvae (top four panels). Densitometric analyses of phospho-SIK3 bands (bottom panel). FB-Gal4 was used to drive transgene expression in the fat body. Anti-phospho-Thr196 SIK3, -Myc (SIK3 protein), -AKH and -β-tubulin (TUB) antibodies were used. (D) Immunohistochemical analyses of HDAC4 (anti-FLAG antibody, green) in AKHR mutant (AKHR 1) L3 larvae in feeding or 4 hr fasting condition as denoted in figures. Cell nuclei were stained by Hoechst 33258 (blue). Genotypes are as follows: Control (FB-Gal4,AKHR 1/AKHR 1) and FLAG-HDAC4,AKHR1 (FB-Gal4,AKHR 1/UAS-HDAC4,AKHR 1). The graphs showed the staining intensity profile for each antibody along the red lines. Scale bars, 20 μm. (E-F) Effect of the fat body-specific expression of constitutively active HDAC4 (HDAC3A) on TAG amounts (E) and bmm gene expression (F) in AKHR mutant. Genotypes: FB> (FB-Gal4/+), AKHR1,FB> (FB-Gal4,AKHR 1/AKHR 1), FB>HDAC43A (FB-Gal4/UAS-HDAC4 3A), and AKHR1,FB>HDAC43A (FB-Gal4,AKHR 1/UAS-HDAC4 3A,AKHR 1). Data are presented as mean ± SEM (*P < 0.05; **P < 0.01; ***P < 0.001; NS, non-significant).
Fig 5
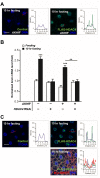
Fig 5. HDAC4 accumulated in the nuclei of the fat body cells in AKHR mutants under prolonged fasting.
(A) Immunohistochemical analyses of HDAC4 (anti-FLAG antibody, green) in AKHR mutant (AKHR 1) L3 larvae in 10 hr fasting condition as denoted in figures. Cell nuclei were stained by Hoechst 33258 (blue). Genotypes are as follows: Control (FB-Gal4,AKHR 1/AKHR 1) and FLAG-HDAC4,AKHR1 (FB-Gal4,AKHR 1/UAS-HDAC4,AKHR 1). The graphs showed the staining intensity profile for each antibody along the red lines. Scale bars, 20 μm. (B) Effects of the fat body-specific knockdown of HDAC4 (HDAC4 RNAi) on bmm gene expression in AKHR mutant adult flies (AKHR 1) in 10 hr fasting condition. Genotypes are as follows: Control (FB-Gal4/+), HDAC4 RNAi (FB-Gal4/+;UAS-HDAC4 RNAi/+), AKHR1 (FB-Gal4,AKHR 1/AKHR 1), and AKHR1,HDAC4 RNAi (FB-Gal4,AKHR 1/AKHR 1 ;UAS-HDAC4 RNAi/+). (C) Immunohistochemical analyses of HDAC4 (anti-FLAG antibody, green) in the fat body cells following expression of constitutively active (T196E) SIK3 in 10 hr fasting condition as denoted in figures. Genotypes are as follows: Control (FB-Gal4/+), FLAG-HDAC4 (FB-Gal4/UAS-HDAC4), and FLAG-HDAC4,SIK3TE (FB-Gal4/UAS-HDAC4;UAS-SIK3 T196E/+). The graphs showed the staining intensity profile for each antibody along the red lines. Scale bars, 20 μm. Data are presented as mean ± SEM (**P < 0.01; ***P < 0.001).
Fig 6
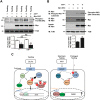
Fig 6. Activation of insulin receptor increases phosphorylation of SIK3 by Akt.
(A) Immunoblot analyses showing the effect of 4 hr fasting and constitutively active insulin receptor (InRCA) on Thr196 phosphorylation of SIK3 protein in larvae (top three panels). Anti-phospho-Thr196 SIK3, -Myc (SIK3 protein), and -β-tubulin (TUB) antibodies were used. Densitometry of phospho-Thr196 SIK3 bands (bottom panel). FB-Gal4 was used to drive transgene expression in the fat body. (B) Immunoblot analyses showing the effect of constitutively active insulin receptor (InRCA) on Akt-dependent phosphorylation of SIK3 protein in larvae (top four panels). The lysates were immunoprecipitated with an anti-Myc (SIK3 protein) antibody, and then immunoblotted with an anti-phospho-Akt substrate antibody. Densitometry of phospho-SIK3 bands (bottom panel). (C) A schematic model for LKB1 and SIK3 function to regulate lipid homeostasis in Drosophila fat body. LKB1 regulates the nucleocytoplasmic localization of HDAC4 via SIK3-dependent phosphorylation. Under feeding condition, DILPs-induced Akt activation leads to SIK3 activation, thereby inhibiting HDAC4 activity by phosphorylation. Under short-term fasting conditions, the AKH pathway inhibits the kinase activity of LKB1 in phosphorylating SIK3 Thr196 residue and controls SIK3 activity via PKA-dependent phosphorylation. Unphosphorylated and nuclear localized HDAC4 deacetylates and activates FOXO to increase bmm expression [19], thereby reducing lipid storage. AKH-independent signaling modulates the LKB1-SIK3-HDAC4 pathway to induce bmm expression when fasting is prolonged. Data are presented as mean ± SEM (*P < 0.05; **P < 0.01; NS, non-significant).

Similar articles

Cited by

References

    1. Kopelman PG (2000) Obesity as a medical problem. Nature 404: 635–643. - PubMed
    1. Schlegel A, Stainier DY (2007) Lessons from "lower" organisms: what worms, flies, and zebrafish can teach us about human energy metabolism. PLoS Genet 3: e199 - PMC - PubMed
    1. Gronke S, Mildner A, Fellert S, Tennagels N, Petry S, et al. (2005) Brummer lipase is an evolutionary conserved fat storage regulator in Drosophila. Cell Metab 1: 323–330. - PubMed
    1. Kim SK, Rulifson EJ (2004) Conserved mechanisms of glucose sensing and regulation by Drosophila corpora cardiaca cells. Nature 431: 316–320. - PubMed
    1. Lee G, Park JH (2004) Hemolymph sugar homeostasis and starvation-induced hyperactivity affected by genetic manipulations of the adipokinetic hormone-encoding gene in Drosophila melanogaster. Genetics 167: 311–323. - PMC - PubMed

Publication types

MeSH terms

LinkOut - more resources