

Schwann Cells Metabolize Extracellular 2',3'-cAMP to 2'-AMP
- PMID: 25998049
- PMCID: PMC4518068
- DOI: 10.1124/jpet.115.225219
Schwann Cells Metabolize Extracellular 2',3'-cAMP to 2'-AMP
Abstract
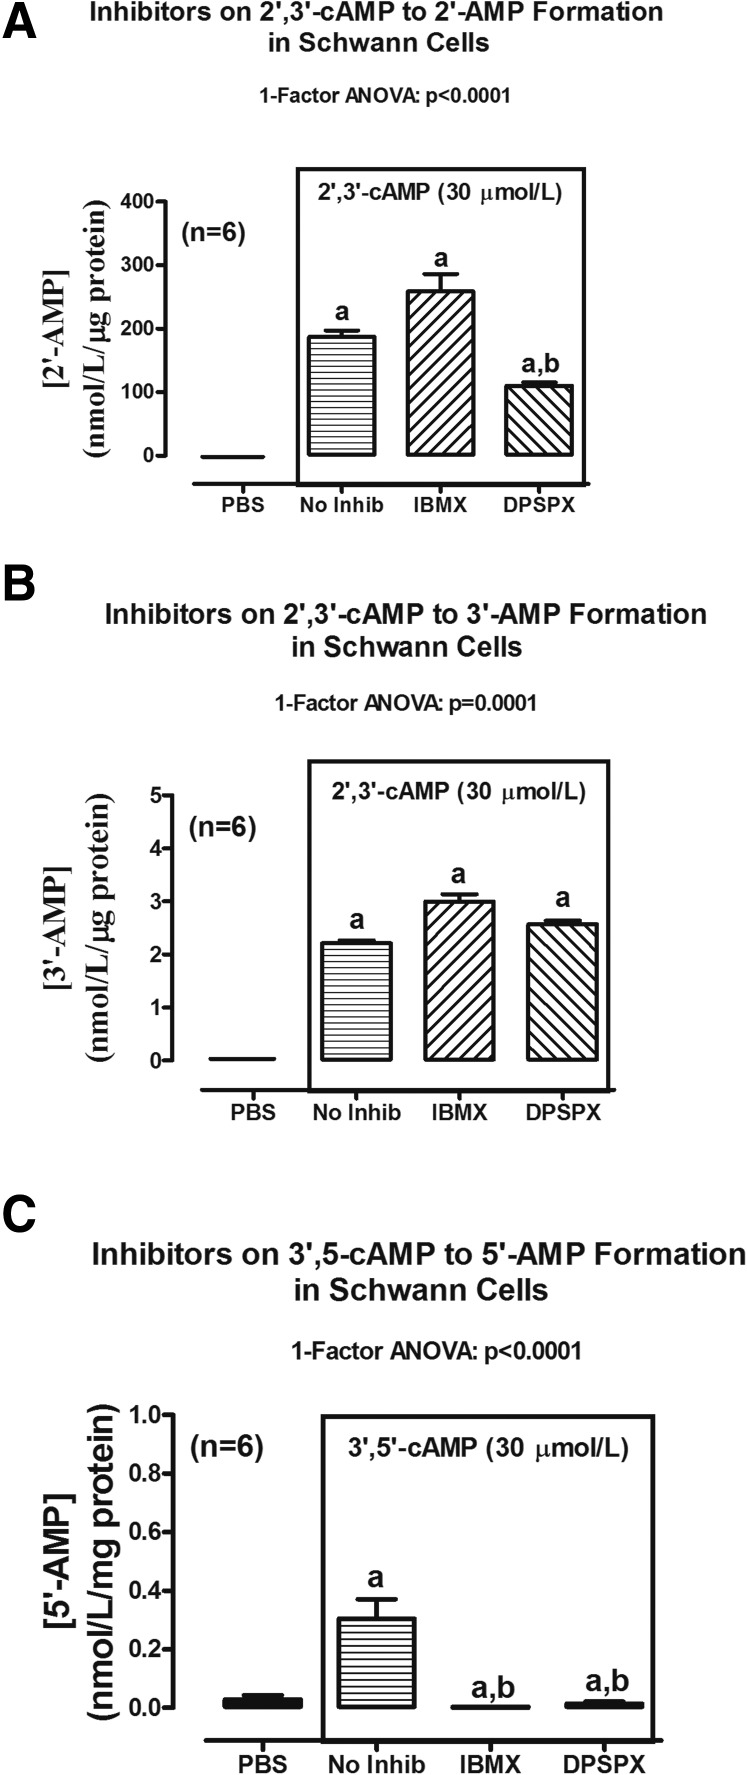
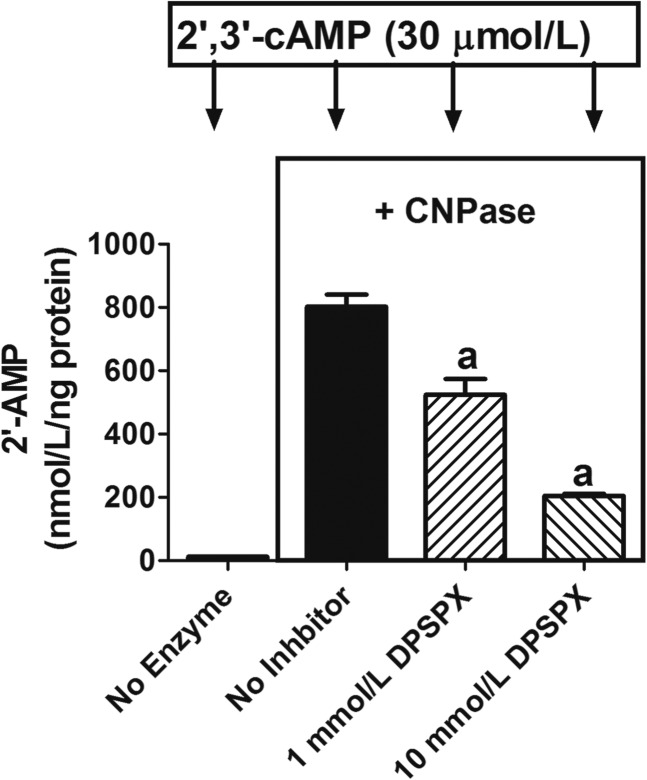
The 3',5'-cAMP-adenosine pathway (3',5'-cAMP→5'-AMP→adenosine) and the 2',3'-cAMP-adenosine pathway (2',3'-cAMP→2'-AMP/3'-AMP→adenosine) are active in the brain. Oligodendrocytes participate in the brain 2',3'-cAMP-adenosine pathway via their robust expression of 2',3'-cyclic nucleotide 3'-phosphodiesterase (CNPase; converts 2',3'-cAMP to 2'-AMP). Because Schwann cells also express CNPase, it is conceivable that the 2',3'-cAMP-adenosine pathway exists in the peripheral nervous system. To test this and to compare the 2',3'-cAMP-adenosine pathway to the 3',5'-cAMP-adenosine pathway in Schwann cells, we examined the metabolism of 2',3'-cAMP, 2'-AMP, 3'-AMP, 3',5'-cAMP, and 5'-AMP in primary rat Schwann cells in culture. Addition of 2',3'-cAMP (3, 10, and 30 µM) to Schwann cells increased levels of 2'-AMP in the medium from 0.006 ± 0.002 to 21 ± 2, 70 ± 3, and 187 ± 10 nM/µg protein, respectively; in contrast, Schwann cells had little ability to convert 2',3'-cAMP to 3'-AMP or 3',5'-cAMP to either 3'-AMP or 5'-AMP. Although Schwann cells slightly converted 2',3'-cAMP and 2'-AMP to adenosine, they did so at very modest rates (e.g., 5- and 3-fold, respectively, more slowly compared with our previously reported studies in oligodendrocytes). Using transected myelinated rat sciatic nerves in culture medium, we observed a time-related increase in endogenous intracellular 2',3'-cAMP and extracellular 2'-AMP. These findings indicate that Schwann cells do not have a robust 3',5'-cAMP-adenosine pathway but do have a 2',3'-cAMP-adenosine pathway; however, because the pathway mostly involves 2'-AMP formation rather than 3'-AMP, and because the conversion of 2'-AMP to adenosine is slow, metabolism of 2',3'-cAMP mostly results in the accumulation of 2'-AMP. Accumulation of 2'-AMP in peripheral nerves postinjury could have pathophysiological consequences.
Copyright © 2015 by The American Society for Pharmacology and Experimental Therapeutics.
Figures


Similar articles
-
Role of CNPase in the oligodendrocytic extracellular 2',3'-cAMP-adenosine pathway.Glia. 2013 Oct;61(10):1595-606. doi: 10.1002/glia.22523. Epub 2013 Aug 6. Glia. 2013. PMID: 23922219 Free PMC article.
-
The brain in vivo expresses the 2',3'-cAMP-adenosine pathway.J Neurochem. 2012 Jul;122(1):115-25. doi: 10.1111/j.1471-4159.2012.07705.x. Epub 2012 Mar 20. J Neurochem. 2012. PMID: 22360621 Free PMC article.
-
Role of 2',3'-cyclic nucleotide 3'-phosphodiesterase in the renal 2',3'-cAMP-adenosine pathway.Am J Physiol Renal Physiol. 2014 Jul 1;307(1):F14-24. doi: 10.1152/ajprenal.00134.2014. Epub 2014 May 7. Am J Physiol Renal Physiol. 2014. PMID: 24808540 Free PMC article.
-
Discovery and Roles of 2',3'-cAMP in Biological Systems.Handb Exp Pharmacol. 2017;238:229-252. doi: 10.1007/164_2015_40. Handb Exp Pharmacol. 2017. PMID: 26721674 Review.
-
The 2',3'-cAMP-adenosine pathway.Am J Physiol Renal Physiol. 2011 Dec;301(6):F1160-7. doi: 10.1152/ajprenal.00450.2011. Epub 2011 Sep 21. Am J Physiol Renal Physiol. 2011. PMID: 21937608 Free PMC article. Review.
Cited by
-
GRT-X Stimulates Dorsal Root Ganglia Axonal Growth in Culture via TSPO and Kv7.2/3 Potassium Channel Activation.Int J Mol Sci. 2024 Jul 3;25(13):7327. doi: 10.3390/ijms25137327. Int J Mol Sci. 2024. PMID: 39000434 Free PMC article.
-
Purines: forgotten mediators in traumatic brain injury.J Neurochem. 2016 Apr;137(2):142-53. doi: 10.1111/jnc.13551. Epub 2016 Feb 25. J Neurochem. 2016. PMID: 26809224 Free PMC article. Review.
References
-
- Azarashvili T, Krestinina O, Galvita A, Grachev D, Baburina Y, Stricker R, Evtodienko Y, Reiser G. (2009) Ca2+-dependent permeability transition regulation in rat brain mitochondria by 2′,3′-cyclic nucleotides and 2′,3′-cyclic nucleotide 3′-phosphodiesterase. Am J Physiol Cell Physiol 296:C1428–C1439. - PubMed
-
- Beavo JA, Reifsnyder DH. (1990) Primary sequence of cyclic nucleotide phosphodiesterase isozymes and the design of selective inhibitors. Trends Pharmacol Sci 11:150–155. - PubMed
-
- Boison D. (2007) Adenosine as a modulator of brain activity. Drug News Perspect 20:607–611. - PubMed
-
- Cheng L, Mudge AW. (1996) Cultured Schwann cells constitutively express the myelin protein P0. Neuron 16:309–319. - PubMed
Publication types
MeSH terms
Substances
Grants and funding
- R01-NS087978/NS/NINDS NIH HHS/United States
- R01 DK068575/DK/NIDDK NIH HHS/United States
- P30 DK079307/DK/NIDDK NIH HHS/United States
- R01 HL069846/HL/NHLBI NIH HHS/United States
- R01 NS087978/NS/NINDS NIH HHS/United States
- R01 DK091190/DK/NIDDK NIH HHS/United States
- R01-DK091190/DK/NIDDK NIH HHS/United States
- P30-DK079307/DK/NIDDK NIH HHS/United States
- R01-DK068575/DK/NIDDK NIH HHS/United States
- R01 HL109002/HL/NHLBI NIH HHS/United States
- R01-HL069846/HL/NHLBI NIH HHS/United States
- R01-HL109002/HL/NHLBI NIH HHS/United States
LinkOut - more resources
Full Text Sources
Other Literature Sources
