. 2015 May 22:4:e05920.
doi: 10.7554/eLife.05920.

The kinase DYRK1A reciprocally regulates the differentiation of Th17 and regulatory T cells

Affiliations

The kinase DYRK1A reciprocally regulates the differentiation of Th17 and regulatory T cells

Bernard Khor et al. Elife. .

Abstract

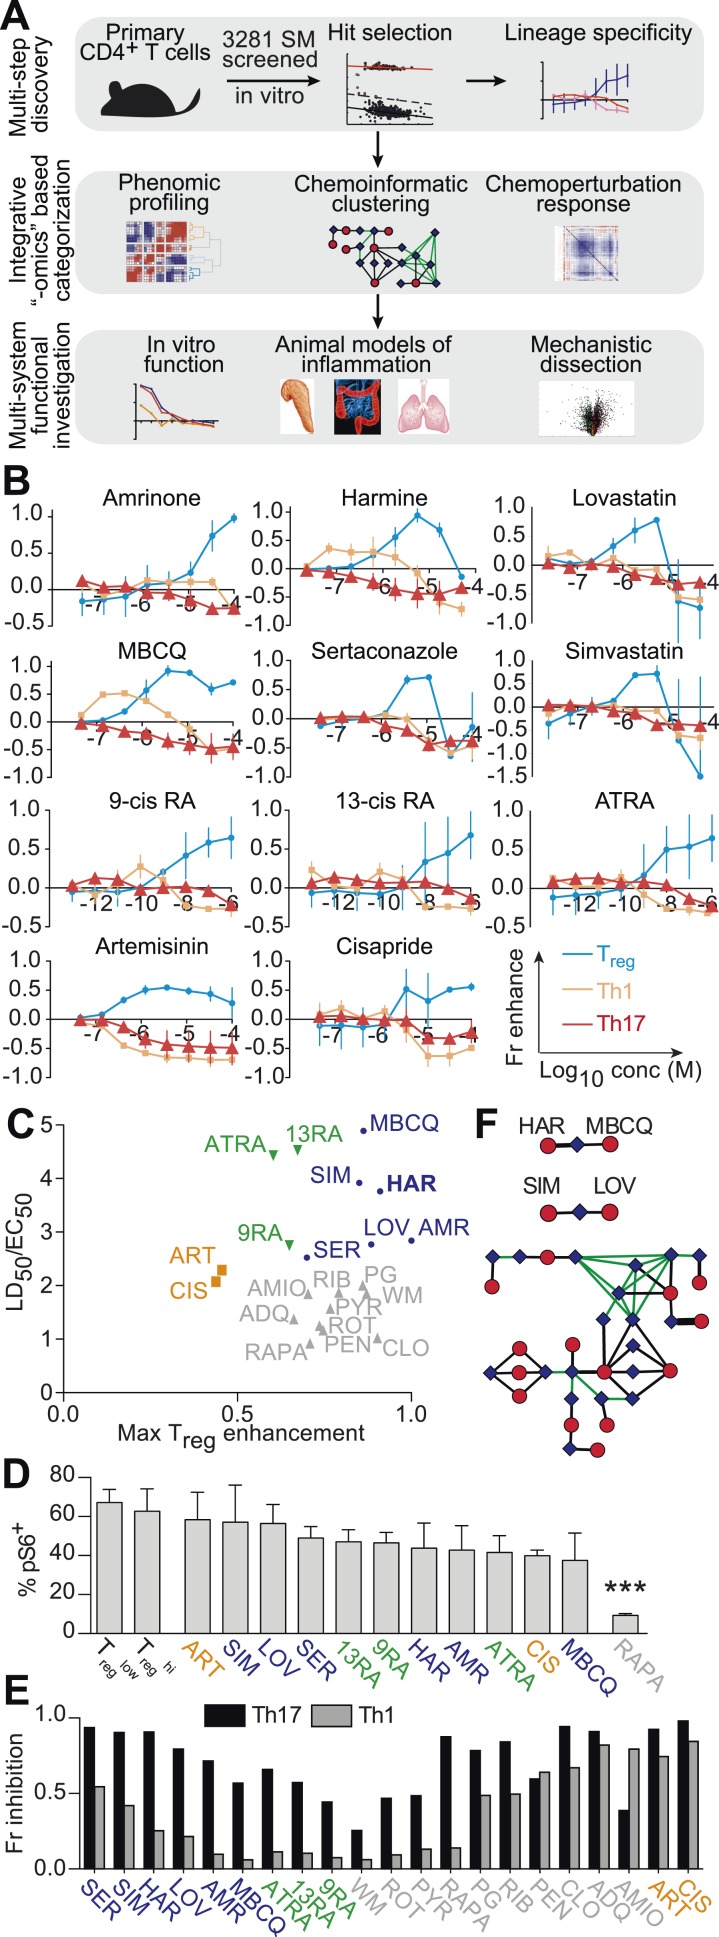
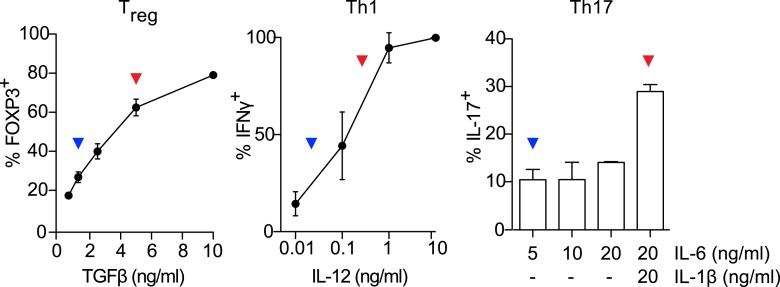
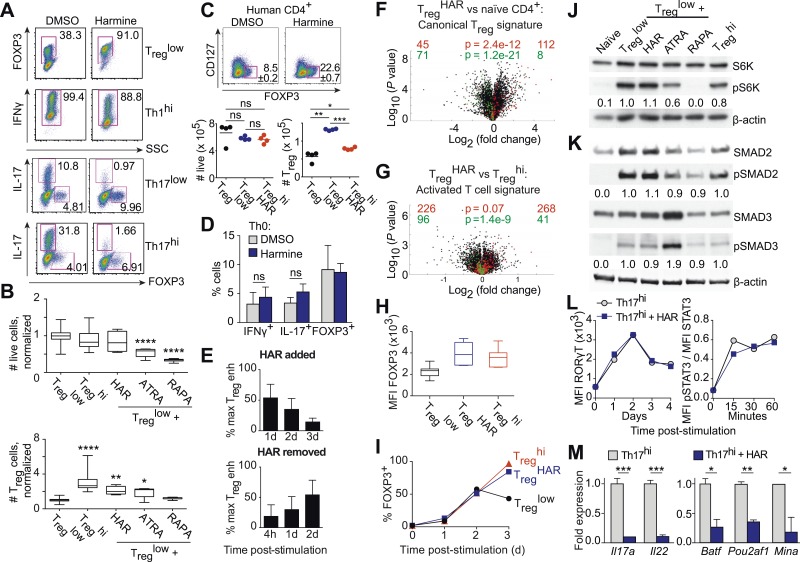
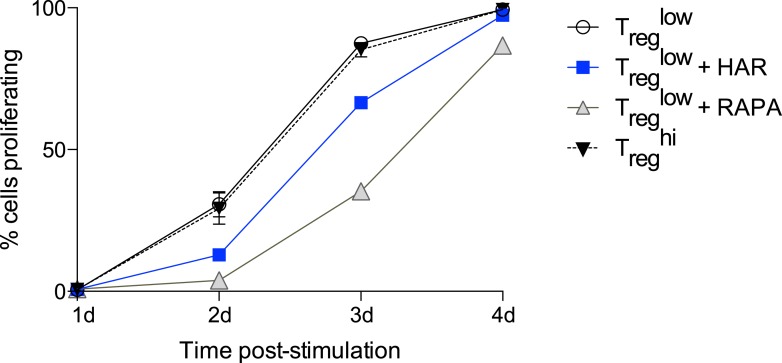
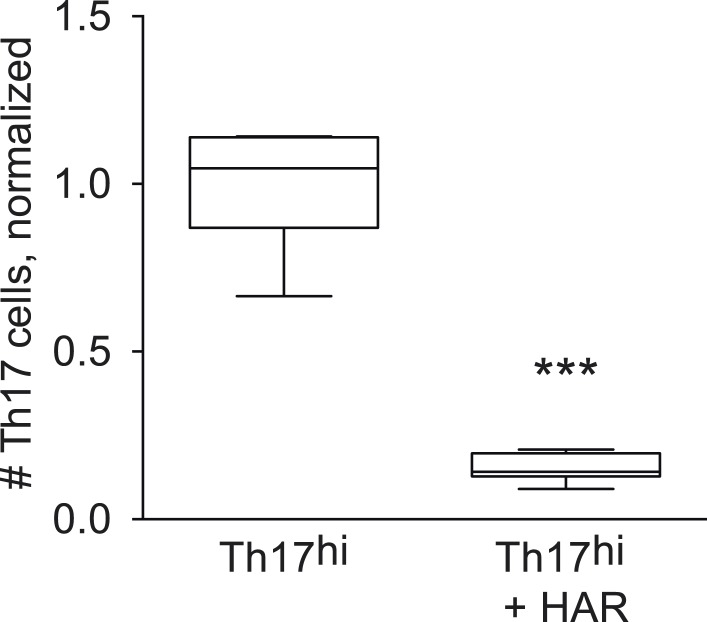
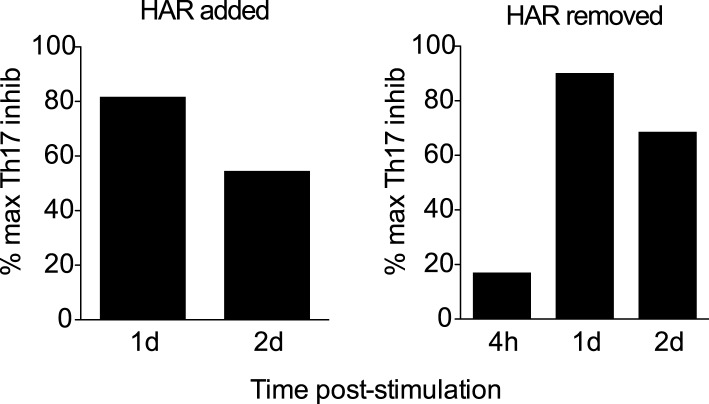
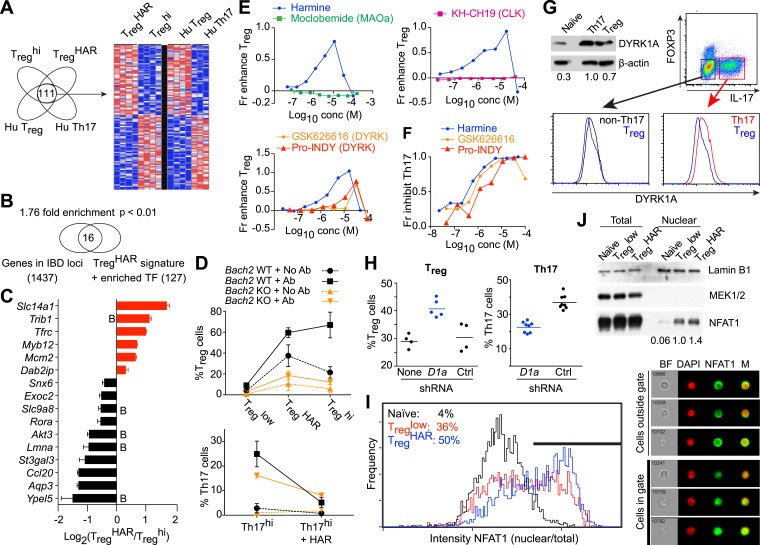
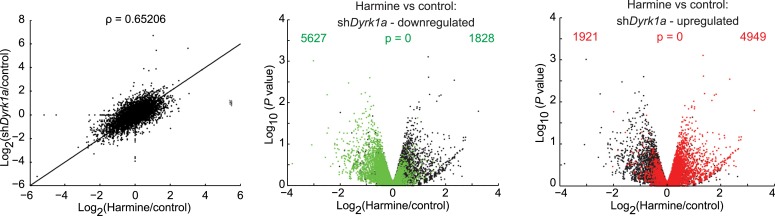
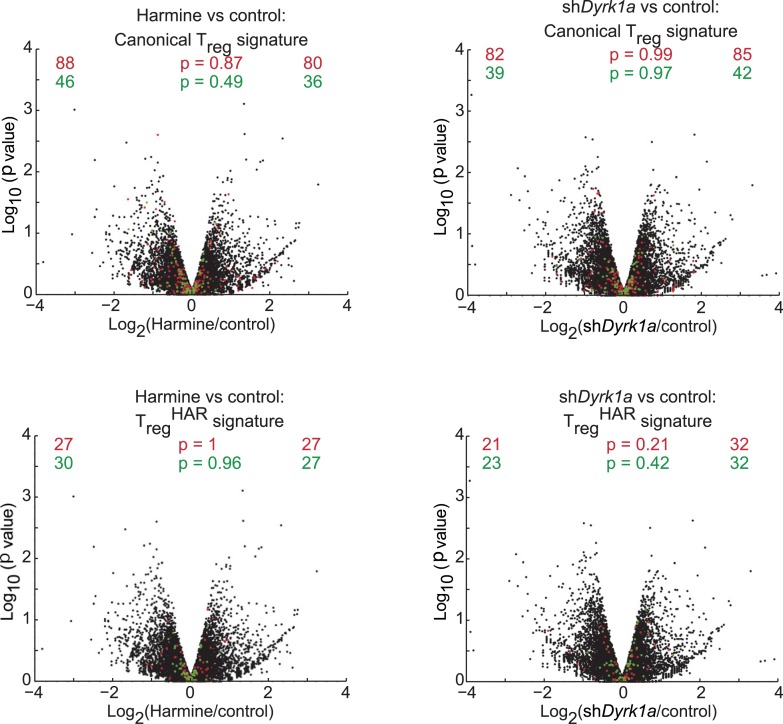
The balance between Th17 and T regulatory (Treg) cells critically modulates immune homeostasis, with an inadequate Treg response contributing to inflammatory disease. Using an unbiased chemical biology approach, we identified a novel role for the dual specificity tyrosine-phosphorylation-regulated kinase DYRK1A in regulating this balance. Inhibition of DYRK1A enhances Treg differentiation and impairs Th17 differentiation without affecting known pathways of Treg/Th17 differentiation. Thus, DYRK1A represents a novel mechanistic node at the branch point between commitment to either Treg or Th17 lineages. Importantly, both Treg cells generated using the DYRK1A inhibitor harmine and direct administration of harmine itself potently attenuate inflammation in multiple experimental models of systemic autoimmunity and mucosal inflammation. Our results identify DYRK1A as a physiologically relevant regulator of Treg cell differentiation and suggest a broader role for other DYRK family members in immune homeostasis. These results are discussed in the context of human diseases associated with dysregulated DYRK activity.

Keywords: T cell differentiation; computational biology; dual-specificity tyrosine-regulated kinase signaling; human; immunology; inflammation; mouse; systems biology.


Conflict of interest statement

The authors declare that no competing interests exist.

Figures

Figure 1.
Figure 1.. Chemical biology approach to identify novel Treg enhancers.
All data representative of at least 2 independent experiments. (A) Overview of our approach, including key methods applied. (B) Dose-response curves showing fractional enhancement (Fr enhance) of compounds (LD50/EC50 > 2) for Treg (blue), Th1 (orange) and Th17 (red) lineages. (C) Plot of LD50/EC50 vs maximal fractional Treg cell enhancement showing all 21 Treg-specific enhancers (9RA, 9-cis retinoic acid; 13RA, 13-cis retinoic acid; ADQ, amodiaquine; AMIO, amiodarone; AMR, amrinone; ATRA, all-trans retinoic acid; ART, artemisinin; CIS, cisapride; CLO, clotrimazole; HAR, harmine; LOV, lovastatin; MBCQ, 4-((3,4-methylenedioxybenzyl)amino)-6-chloroquinazoline;4-quinazolinamine); PEN, pentamidine; PG, proguanil; PYR, pyrvinium pamoate; RAPA, rapamycin; RIB, ribavirin; ROT, rotenone; SER, sertaconazole; SIM, simvastatin; WM, wortmannin; Supplementary file 2). Retinoic acids are in green; compounds with LD50/EC50 < 2 are in gray and LD50/EC50 > 2 are in blue. The orange cluster is described in the text. (D) Ability of selected compounds (LD50/EC50 > 2 and controls) to inhibit mTOR activity, as measured by S6 phosphorylation (***p < 0.001, 1-way ANOVA with Dunnett correction). (E) Fractional (Fr) inhibitory activity of all 21 Treg-specific enhancers on Th1 and Th17 cell differentiation. (F) SEA-predicted relationships between all 21 Treg enhancers. Black lines predict binding of compounds (red circles) to proteins (blue diamonds) with likelihood proportional to line width. Green lines denote connection via curated KEGG pathways. See also Figure 1—figure supplements 1–8. DOI: http://dx.doi.org/10.7554/eLife.05920.003
Figure 1—figure supplement 1.
Figure 1—figure supplement 1.. Titrating Th differentiation conditions.
Titrating cytokines for Treg, Th1, and Th17 conditions identifies sub-maximal (blue arrowheads) and near-maximal (red arrowheads) lineage-promoting conditions. DOI: http://dx.doi.org/10.7554/eLife.05920.004
Figure 1—figure supplement 2.
Figure 1—figure supplement 2.. Culture cellularity affects Treg differentiation.
Treglow (blue) stimulation with varying initial cell numbers recapitulates the inverse relationship between final culture cellularity and percentage of FOXP3-expressing cells. Treghi (red) conditions generate uniformly high levels of FOXP3-expressing cells independent of culture cellularity. DOI: http://dx.doi.org/10.7554/eLife.05920.005
Figure 1—figure supplement 3.
Figure 1—figure supplement 3.. Schematic of analytic and hit-calling pipeline.
DOI: http://dx.doi.org/10.7554/eLife.05920.006
Figure 1—figure supplement 4.
Figure 1—figure supplement 4.. Effect of compounds (LD50/EC50 < 2) on Th differentiation.
Dose-response curves showing compound effect on fractional enhancement of Treg (blue), Th1 (orange), and Th17 (red) lineages. DOI: http://dx.doi.org/10.7554/eLife.05920.007
Figure 1—figure supplement 5.
Figure 1—figure supplement 5.. Modeling analyses to calculate EC50 values, indicated in parentheses, for all 21 Treg-specific enhancers.
DOI: http://dx.doi.org/10.7554/eLife.05920.008
Figure 1—figure supplement 6.
Figure 1—figure supplement 6.. Modeling analyses to calculate LD50 values, indicated in parentheses, for all 21 Treg-specific enhancers.
DOI: http://dx.doi.org/10.7554/eLife.05920.009
Figure 1—figure supplement 7.
Figure 1—figure supplement 7.. Similarity clustering analysis of combined Treg, Th1 and Th17 phenotypic data.
DOI: http://dx.doi.org/10.7554/eLife.05920.010
Figure 1—figure supplement 8.
Figure 1—figure supplement 8.. Euclidean distance clustering analysis of gene expression data from cell lines treated with Treg enhancers first analyzed by principal component analysis.
DOI: http://dx.doi.org/10.7554/eLife.05920.011
Figure 2.
Figure 2.. Harmine-enhanced Treg cells and harmine attenuate inflammation.
(AE) Experiments comparing the suppressive activity of Treg cells generated under either TregHAR (blue) or Treghi (red) conditions; conditions without Treg cells are shown in black. All data representative of at least 2 independent experiments; in vivo experiments used at least 3 mice per cohort. (A) In vitro suppression assay, with unstimulated tTreg cells in orange. (B) Treghi-Treg cells and TregHAR-Treg cells similarly delay onset of diabetes in the NOD-BDC2.5 model of type 1 diabetes. (C) Comparable inhibition of inflammation by Treghi-Treg cells and TregHAR-Treg cells in the CD45RBhi transfer model of colitis. Representative images are shown in (D). Bars represent 100 μm. (E) Similar inhibition of airway inflammation by Treghi-Treg cells and TregHAR-Treg cells, as measured by number of eosinophils (Eos) in bronchoalveolar lavage (BAL) fluid, in a model of asthma. (F) Comparison of Treg cells (as a percentage of total CD4+ T cells) in the thoracic lymph nodes of mice treated with intranasal harmine, vs mock treatment. (G) Intranasal administration of harmine prior to immunization inhibits recall airway inflammation in the asthma model. Right, representative images of inflammation around airway vessels. **p < 0.01, *p < 0.05, ns, not significant, Mantel-Cox test (B, C) and Student's t-test (E, F). See also Figure 2—figure supplements 1–2. DOI: http://dx.doi.org/10.7554/eLife.05920.012
Figure 2—figure supplement 1.
Figure 2—figure supplement 1.. Effects of harmine treatment in vivo on T cell populations.
Mice were administered either intranasal harmine HCl (blue) or water (gray). T cell populations in thoracic lymph nodes were quantitated as shown, demonstrating relative percentages (above) and absolute numbers (below). All statistically significant differences are indicated, **p < 0.01, ***p < 0.001, Student's t-test with Holm-Sidak correction. DOI: http://dx.doi.org/10.7554/eLife.05920.013
Figure 2—figure supplement 2.
Figure 2—figure supplement 2.. Effects of harmine treatment in vivo on antigen-presenting cell populations.
Mice were administered either intranasal harmine HCl (blue) or water (gray). Migratory and classical dendritic cells (mDC and cDC, respectively) in thoracic lymph nodes were quantitated (top right), and their respective expression of costimulatory molecules (CD40, CD80, and CD86) compared. ns, not significant, Student's t-test. DOI: http://dx.doi.org/10.7554/eLife.05920.014
Figure 3.
Figure 3.. Harmine's effects on canonical Treg/Th17 pathways.
All data representative of at least 2 independent experiments. (A) Effect of harmine on murine Treg, Th1 and Th17 differentiation. (B) Effect of harmine on absolute numbers of total live and Treg cells. (C) Effect of harmine on human Treg differentiation. (D) Effect of harmine on Th differentiation under Th0 conditions as shown by percentage of cells with indicated markers. (E) Harmine's pro-Treg effect when added or removed at different times after Treglow stimulation as shown by percentage of maximal Treg enhancement (% max Treg enh). (F and G) Volcano plots comparing p value vs fold change in gene expression in naïve CD4+ T cells, Treghi-Treg cells and TregHAR-Treg cells as indicated. Previously reported signature genes for Treg cells (F) and activated T cells (G) are highlighted in red (upregulated) and green (downregulated). Numbers on the right and left reflect genes that are up- and down-regulated in the indicated comparison respectively with χ2 test p values in the middle. (H) Median fluorescence intensity (MFI) of FOXP3 in Treg cells generated under indicated conditions. (I) Time-course analysis of FOXP3 expression in cells cultured under indicated conditions. (J and K) Western blot analyses showing effect of Treg enhancers on S6 kinase, SMAD2 and SMAD3 phosphorylation when added under Treglow conditions. Numbers denote fractional phosphorylation relative to Treglow conditions. (L) Effect of harmine (blue) on RORγT expression and STAT3 phosphorylation in Th17hi conditions (gray). (M) qPCR analyses showing effects of harmine on key Th17 genes at 4 days (left) and 2 hours (right) after stimulation. Gray and blue bars represent Th17hi and Th17hi + harmine conditions, respectively. *p < 0.05, **p < 0.01, ***p < 0.001, ****p < 0.0001, ns, not significant, Student's t-test with Holm-Sidak correction (B, C, D, M). See also Figure 3—figure supplements 1–5. DOI: http://dx.doi.org/10.7554/eLife.05920.015
Figure 3—figure supplement 1.
Figure 3—figure supplement 1.. Effect of harmine on cellular proliferation.
CFSE-labelled CD4+ T cells were stimulated under Treglow conditions and proliferation assessed daily. The effect of adding harmine, rapamycin, or high TGFβ (Treghi) was compared as shown. DOI: http://dx.doi.org/10.7554/eLife.05920.016
Figure 3—figure supplement 2.
Figure 3—figure supplement 2.. Effect of harmine on absolute numbers of Th17 cells.
***p < 0.001, Student's t-test. DOI: http://dx.doi.org/10.7554/eLife.05920.017
Figure 3—figure supplement 3.
Figure 3—figure supplement 3.. Effect of addition or removal of harmine at different times on Th17 differentiation.
DOI: http://dx.doi.org/10.7554/eLife.05920.018
Figure 3—figure supplement 4.
Figure 3—figure supplement 4.. Correlation between gene expression in Treghi-Treg cells and TregHAR-Treg cells, relative to naïve CD4+ T cells.
DOI: http://dx.doi.org/10.7554/eLife.05920.019
Figure 3—figure supplement 5.
Figure 3—figure supplement 5.. Qualitative analyses of genomewide expression in TregHAR-Treg cells.
Previously described methods were used to identify similarities between TregHAR-Treg cells and other specialized Treg subsets (Joller et al., 2014). Volcano plots compare relative expression of genes in Treghi-Treg cells and TregHAR-Treg cells. Overlaid are genes of previously identified signatures; red and green reflect genes up- and down-regulated in these signatures respectively. Numbers on the right and left reflect genes that are up- and down-regulated in the indicated comparison respectively with χ2 test p values in the middle. DOI: http://dx.doi.org/10.7554/eLife.05920.020
Figure 4.
Figure 4.. Mechanistic dissection of harmine.
(A) Comparison of expression profiles suggesting a harmine-relevant Treg signature. The black bar separates 2 independently row-normalized experiments. (B) Harmine signature genes are enriched for genes in IBD loci. (C) Validation of top signature genes by qPCR (all p < 0.05, Student's t-test), including genes with BACH2 binding sites (B). (D) Effect on harmine on Treg/Th17 differentiation in BACH2-deficient (orange) vs -sufficient (black) cells. Conditions in the presence and absence of neutralizing antibodies are indicated by solid and dotted lines, respectively. (E) Effect of compounds that inhibit different harmine targets (indicated in parentheses) on Treg cell differentiation. (F) DYRK inhibitors suppress Th17 cell differentiation. (G) Increased levels of DYRK1A in Th17 vs Treg cells. Upper left, Western blot analyses of sorted Treg/Th17 cells with relative expression enumerated below. Histograms show FACS analyses of DYRK1a in Treg cells (blue) compared to either Th17 (red) or non-Th17 (black) cells. (H) Knock-down of Dyrk1a (D1a) enhances Treg (left) and inhibits Th17 (right) cell differentiation. Cells treated with non-targeting shRNA (Ctrl) and no shRNA (None) are shown for comparison. (I) Amnis analyses showing nuclear-overlapping NFAT1 signal before (black) and after stimulation in Treglow conditions with (blue) or without (red) harmine. Representative images (right) illustrate cytoplasmic and nuclear NFAT1 localization in cells outside and within the gate, respectively. (J) Western blot analyses quantitating nuclear fraction of NFAT1 in cells stimulated in Treglow ± harmine conditions. All data in DJ representative of at least 2 independent experiments. See also Figure 4—figure supplements 1–3. DOI: http://dx.doi.org/10.7554/eLife.05920.021
Figure 4—figure supplement 1.
Figure 4—figure supplement 1.. Effect of harmine on NFAT1 nuclear localization with time.
Time-course Amnis analyses showing effect of harmine (blue) relative to control Treglow conditions (black). DOI: http://dx.doi.org/10.7554/eLife.05920.022
Figure 4—figure supplement 2.
Figure 4—figure supplement 2.. Comparing effects of DYRK1A deficiency to harmine treatment.
RNAseq experiments in primary CD4+ T cells comparing the effects of transduction with Dyrk1a shRNA (shDyrk1a) to harmine treatment in control shRNA-transduced cells (left). Further statistical comparison uses volcano plots comparing p value vs fold change in gene expression in harmine-treated and -untreated (control) cells (middle and right panels). Genes differentially regulated by Dyrk1a knockdown are highlighted in red (upregulated) and green (downregulated). Numbers on the right and left reflect genes that are up- and down-regulated, respectively, in harmine vs control conditions, with χ2 test p values in the middle. DOI: http://dx.doi.org/10.7554/eLife.05920.023
Figure 4—figure supplement 3.
Figure 4—figure supplement 3.. Secondary analyses of effects of DYRK1A deficiency compared to harmine treatment.
Volcano plots comparing p value vs fold change in gene expression in harmine-treated (left panels) and Dyrk1a shRNA-treated (right panels) cells. Previously reported signature genes for Treg cells (top panels) and TregHAR-Treg cells (bottom panels) are highlighted in red (upregulated) and green (downregulated). Numbers on the right and left reflect genes that are up- and down-regulated, respectively, in harmine vs control conditions (left) or in shDyrk1a vs control conditions (right), with χ2 test p values in the middle. DOI: http://dx.doi.org/10.7554/eLife.05920.024

References

    1. Aranda S, Laguna A, de la Luna S. DYRK family of protein kinases: evolutionary relationships, biochemical properties, and functional roles. The FASEB Journal. 2011;25:449–462. doi: 10.1096/fj.10-165837. - DOI - PubMed
    1. Arpaia N, Campbell C, Fan X, Dikiy S, van der Veeken J, deRoos P, Liu H, Cross JR, Pfeffer K, Coffer PJ, Rudensky AY. Metabolites produced by commensal bacteria promote peripheral regulatory T-cell generation. Nature. 2013;504:451–455. doi: 10.1038/nature12726. - DOI - PMC - PubMed
    1. Bain J, Plater L, Elliott M, Shpiro N, Hastie CJ, McLauchlan H, Klevernic I, Arthur JS, Alessi DR, Cohen P. The selectivity of protein kinase inhibitors: a further update. The Biochemical Journal. 2007;408:297–315. doi: 10.1042/BJ20070797. - DOI - PMC - PubMed
    1. Benita Y, Cao Z, Giallourakis C, Li C, Gardet A, Xavier RJ. Gene enrichment profiles reveal T-cell development, differentiation, and lineage-specific transcription factors including ZBTB25 as a novel NF-AT repressor. Blood. 2010;115:5376–5384. doi: 10.1182/blood-2010-01-263855. - DOI - PMC - PubMed
    1. Burzyn D, Kuswanto W, Kolodin D, Shadrach JL, Cerletti M, Jang Y, Sefik E, Tan TG, Wagers AJ, Benoist C, Mathis D. A special population of regulatory T cells potentiates muscle repair. Cell. 2013;155:1282–1295. doi: 10.1016/j.cell.2013.10.054. - DOI - PMC - PubMed

Publication types

MeSH terms