. 2015 May 22:5:10191.
doi: 10.1038/srep10191.

Gene expression studies of a human monocyte cell line identify dissimilarities between differently manufactured glatiramoids

Affiliations

Gene expression studies of a human monocyte cell line identify dissimilarities between differently manufactured glatiramoids

Sarah Kolitz et al. Sci Rep. .

Abstract

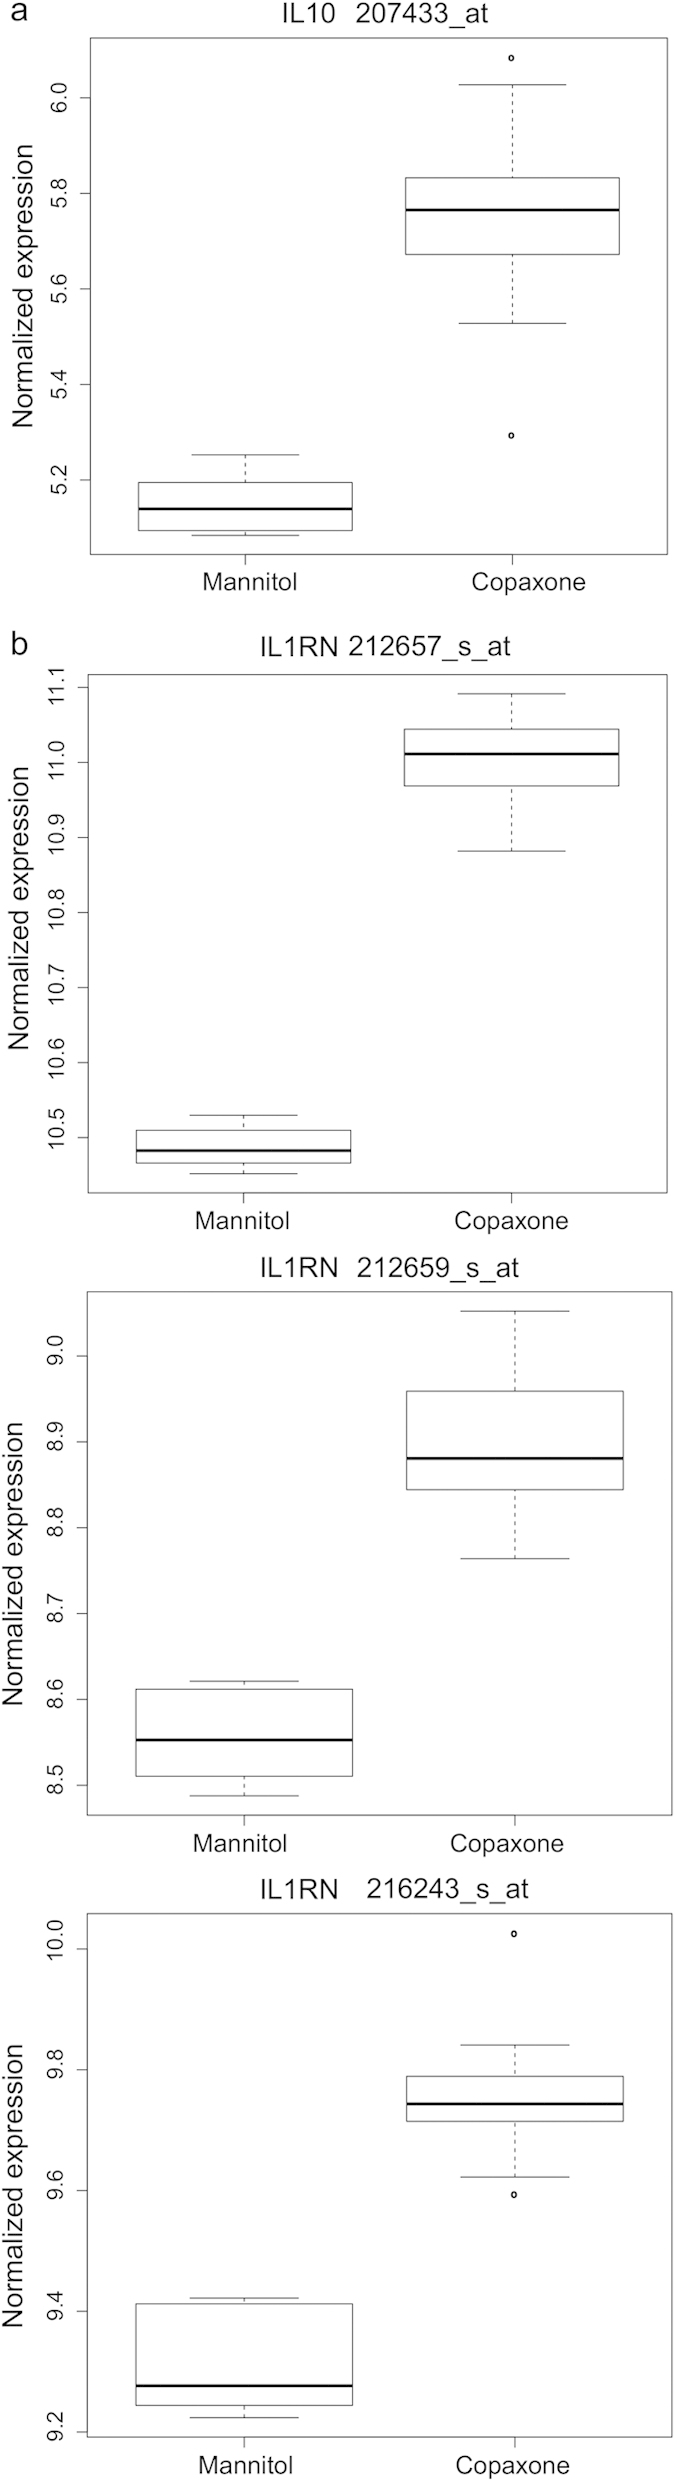
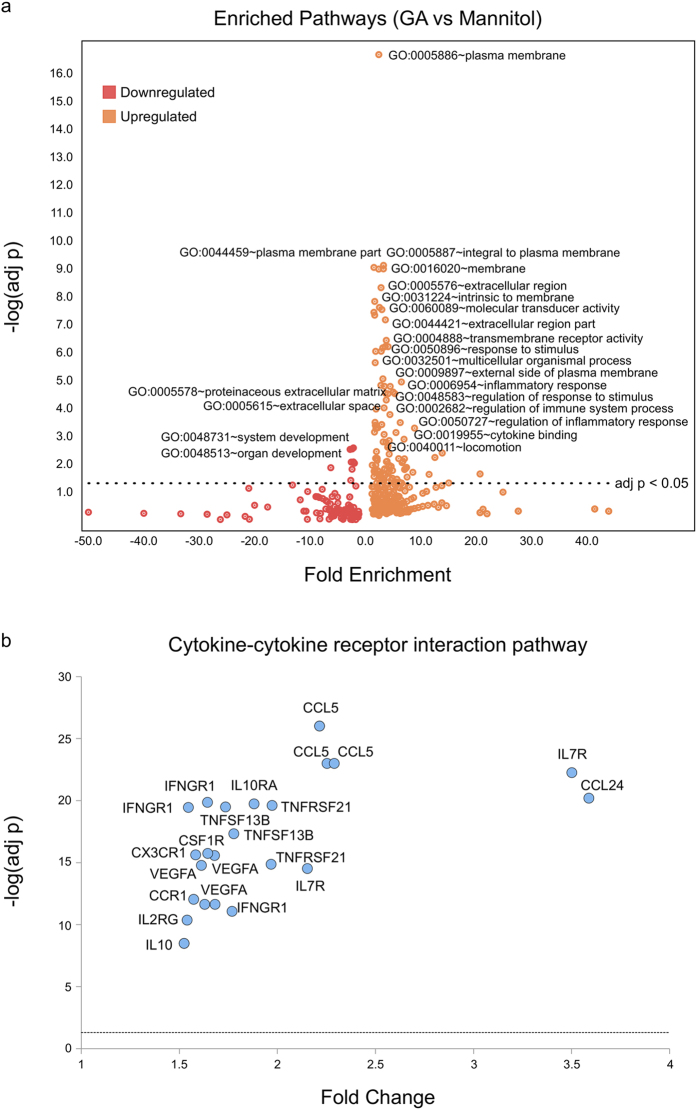
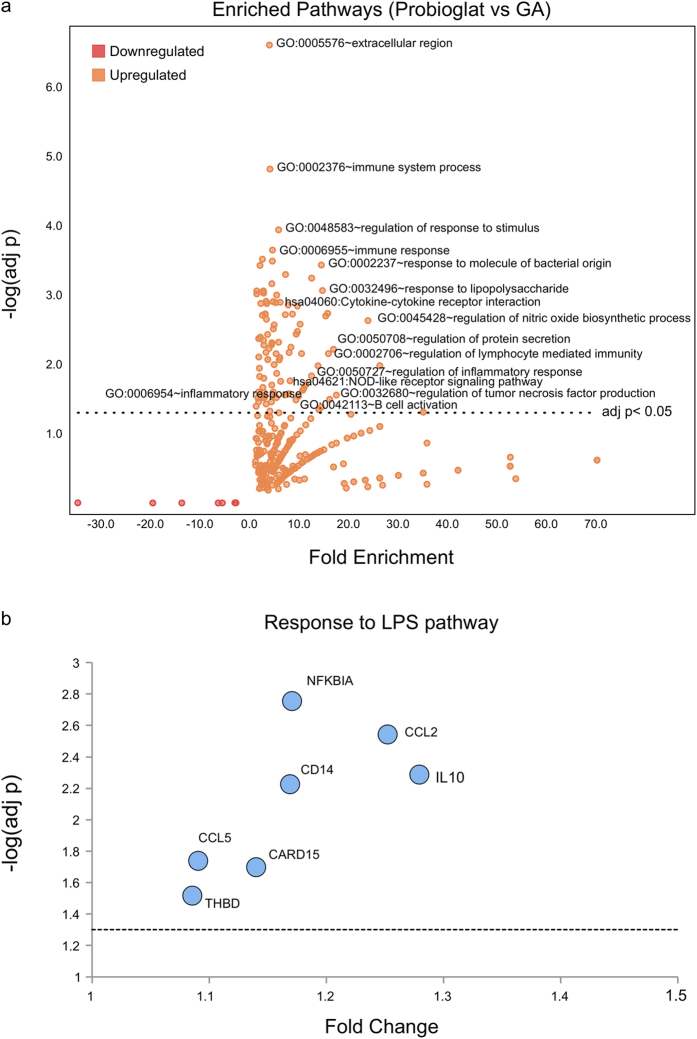
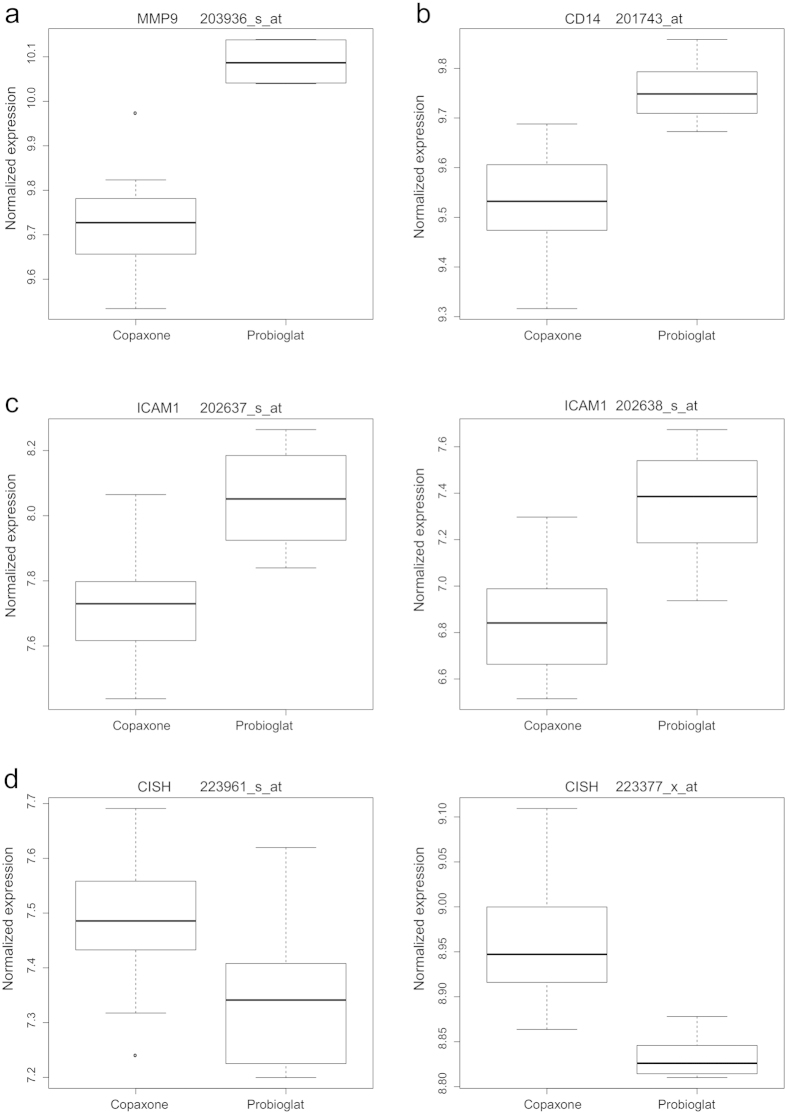
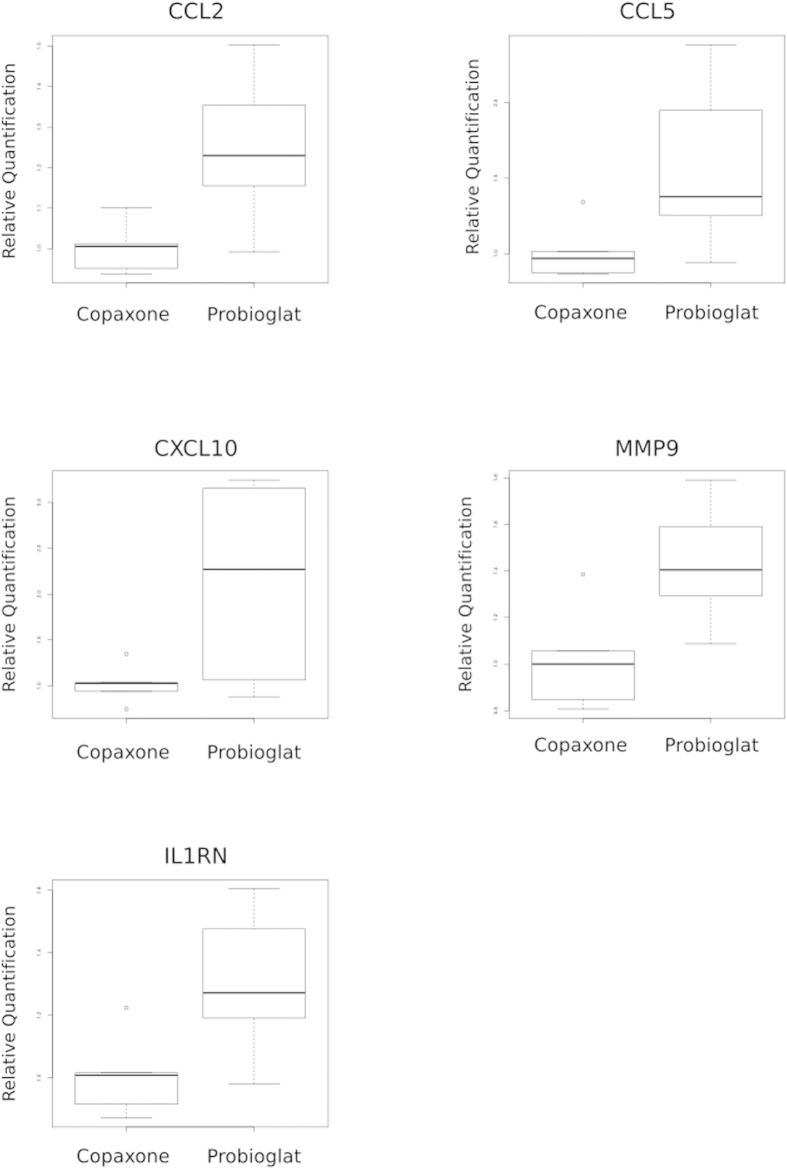
Glatiramer Acetate (GA) has provided safe and effective treatment for multiple sclerosis (MS) patients for two decades. It acts as an antigen, yet the precise mechanism of action remains to be fully elucidated, and no validated pharmacokinetic or pharmacodynamic biomarkers exist. In order to better characterize GA's biological impact, genome-wide expression studies were conducted with a human monocyte (THP-1) cell line. Consistent with previous literature, branded GA upregulated anti-inflammatory markers (e.g. IL10), and modulated multiple immune-related pathways. Despite some similarities, significant differences were observed between expression profiles induced by branded GA and Probioglat, a differently-manufactured glatiramoid purported to be a generic GA. Key results were verified using qRT-PCR. Genes (e.g. CCL5, adj. p < 4.1 × 10(-5)) critically involved in pro-inflammatory pathways (e.g. response to lipopolysaccharide, adj. p = 8.7 × 10(-4)) were significantly induced by Probioglat compared with branded GA. Key genes were also tested and confirmed at the protein level, and in primary human monocytes. These observations suggest differential biological impact by the two glatiramoids and warrant further investigation.


Figures

Figure 1
Figure 1
GA treatment increases expression of IL10 and IL1RN (a) Increased expression of IL10 with GA treatment at 6 hours for the single IL10 probeset on the array (207433_at), FDR-adjusted p < 3.1e-9. (b) Increased expression of IL1RN following GA treatment at 6 hours for multiple probesets (adjusted p values as provided in text).
Figure 2
Figure 2
Pathway enrichment among top genes modulated by GA (a) Pathways enriched among top genes modulated by GA at 6 hours (restricted to fold-change and adjusted p value filters of 1.5 and 1e-5, respectively). The volcano plot shows –log(adjusted p value) for the enrichment plotted versus the fold enrichment score from DAVID for each pathway. (b) Probesets for cytokine-cytokine receptor interaction pathway genes significantly modulated by GA at 6 hours (restricted to fold-change and adjusted p value filters of 1.5 and 1e-5, respectively). The volcano plot shows –log(adjusted p value) for differential expression plotted versus the fold change from LIMMA for each probeset.
Figure 3
Figure 3
Pathway enrichment for genes upregulated by Probioglat compared with GA (a) Pathways enriched among genes upregulated by Probioglat stimulation compared with GA at 6 hours. The volcano plot shows –log(adjusted p value) for the enrichment plotted versus the fold enrichment score from DAVID for each pathway. (b) Focus on response to LPS pathway, differentially expressed by Probioglat versus GA at 6 hours. The volcano plot shows –log(adjusted p value) for differential expression plotted versus the fold change from LIMMA for each probeset.
Figure 4
Figure 4
Expression levels of genes differing between Probioglat and GA (a) MMP9 is significantly upregulated following stimulation by Probioglat compared to GA at 6 and 24 hours (FDR-adjusted p values for the single MMP9 probeset on the chip, 203936_s_at, are 2.74e-6, 0.098, and 0.004 for the 6, 12, and 24 hour timepoints, respectively). (b) CD14 expression is significantly higher with stimulation by Probioglat compared to GA at 6 hours (the single CD14 probeset on the chip is shown, 201743_at).(c) Both present ICAM1 probesets are significantly upregulated following stimulation by Probioglat compared to GA at 6 hours (A: probeset 202637_s_at; B: probeset 202638_s_at). (d) CISH is downregulated following stimulation by Probioglat compared to GA at 6 hours (both present probesets are shown, A: probeset 223961_s_at; B: probeset 223377_x_at).
Figure 5
Figure 5
Expression levels of genes differing between Probioglat and GA by qRT-PCR in primary human monocytes. CCL2 (p < 0.009), CCL5 (p < 0.029), CXCL10 (p < 0.020), MMP9 (p < 0.009), and IL1RN (p < 0.013) are expressed more highly under Probioglat stimulation relative to GA stimulation.

References

    1. Conner J. B., Bawa R., Nicholas J. M. & Weinstein V. in Handbook of Clinical Nanomedicine – From Bench to Bedside Pan Stanford Publishing, 2014).
    1. Arnon R. & Aharoni R. Mechanism of action of glatiramer acetate in multiple sclerosis and its potential for the development of new applications. Proc. Natl. Acad. Sci. 101, 14593–14598 (2004). - PMC - PubMed
    1. Weber M. S. et al. Type II monocytes modulate T cell–mediated central nervous system autoimmune disease. Nat. Med. 13, 935–943 (2007). - PubMed
    1. Kim H. J. et al. Type 2 monocyte and microglia differentiation mediated by glatiramer acetate therapy in patients with multiple sclerosis. J. Immunol. Baltim. Md. 1950 172, 7144–7153 (2004). - PubMed
    1. Jackson LJ, Selva S, Niedzielko T, Vollmer T B Cell Receptor Recognition of Glatiramer Acetate is Required for Efficacy through Antigen Presentation and Cytokine Production. J. Clin. Cell Immunol. 5: 185. 10.4172/2155-9899.1000185 (2014). - DOI

Publication types