. 2015 Jun 19;348(6241):1376-81.
doi: 10.1126/science.aab1433. Epub 2015 May 21.

DRUG DEVELOPMENT. Phthalimide conjugation as a strategy for in vivo target protein degradation

Affiliations

DRUG DEVELOPMENT. Phthalimide conjugation as a strategy for in vivo target protein degradation

Georg E Winter et al. Science. .

Abstract

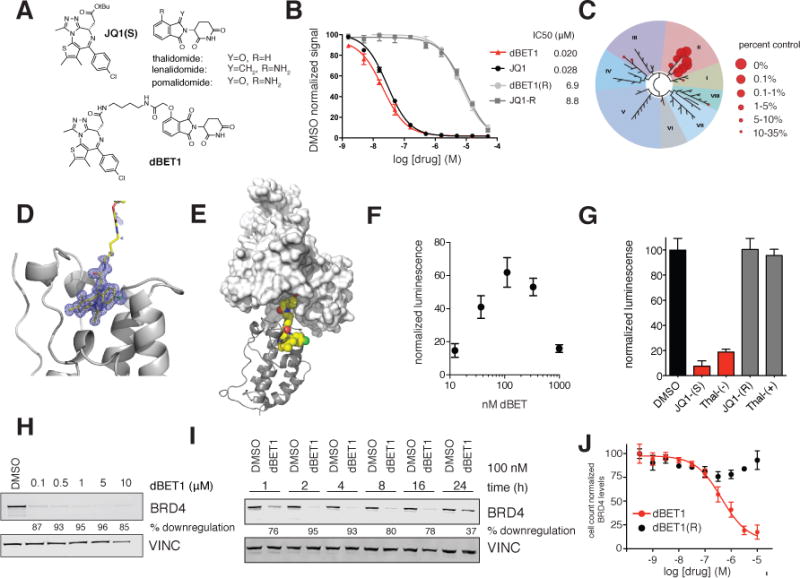
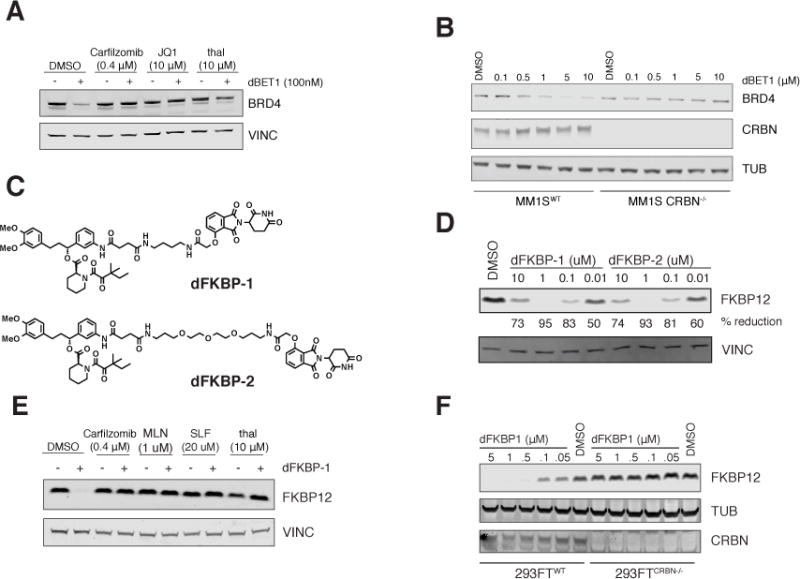
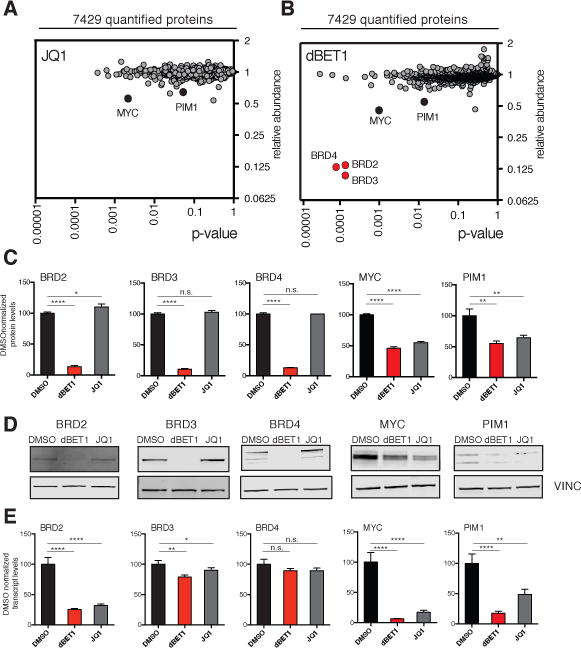
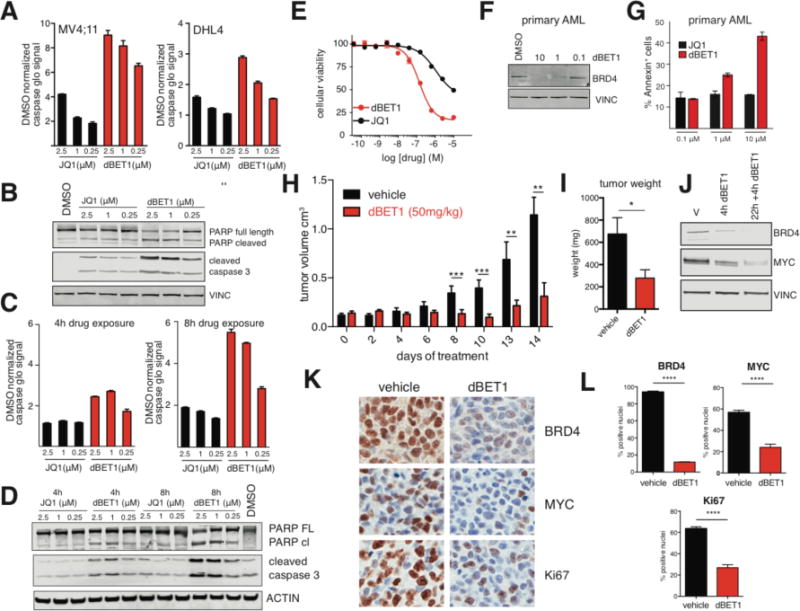
The development of effective pharmacological inhibitors of multidomain scaffold proteins, notably transcription factors, is a particularly challenging problem. In part, this is because many small-molecule antagonists disrupt the activity of only one domain in the target protein. We devised a chemical strategy that promotes ligand-dependent target protein degradation using as an example the transcriptional coactivator BRD4, a protein critical for cancer cell growth and survival. We appended a competitive antagonist of BET bromodomains to a phthalimide moiety to hijack the cereblon E3 ubiquitin ligase complex. The resultant compound, dBET1, induced highly selective cereblon-dependent BET protein degradation in vitro and in vivo and delayed leukemia progression in mice. A second series of probes resulted in selective degradation of the cytosolic protein FKBP12. This chemical strategy for controlling target protein stability may have implications for therapeutically targeting previously intractable proteins.


Figures

Figure 1
Figure 1. Design and characterization of dBET1
(A) Chemical structure of JQ1(S), the phthalimides and dBET1 (B) DMSO normalized BRD4 binding signal measured by AlphaScreen for the indicated compounds. Values represent mean ± stdev of triplicate analysis (C) Selectivity of dBET1 for binding to BETs over other human bromodomains, as determined by single point screening (BromoScan) (D) Crystal structure of dBET1 bound to bromodomain 1 of BRD4 (E) Docking of (D) into the published DDB1-CRBN structure (F) dimerization assay measuring dBET1 induced proximity between recombinant BRD4 bromodomain (1) and recombinant CRBN-DDB1. Values represent mean ± stdev of quadruplicate analysis and are normalized to DMSO. (G) competition of dBET1 induced proximity at 111 nM as shown in (F) in the presence of DMSO (vehicle), JQ1(S), thal-(−), JQ1(R) and thal-(+) all at a final concentration of 1 μM. Values represent mean ± stdev of quadruplicate analysis and are normalized to DMSO. (H) Immunoblot analysis for BRD4 and Vinculin after 18 h treatment of MV4;11 cells with the indicated concentrations of dBET1 (I) Immunoblot analysis for BRD4 and Vinculin after treatment of MV4;11 cells with 100 nM dBET1 at the indicated timepoints (J) Cell count normalized BRD4 levels as determined by high-content assay in SUM149 cells treated with the indicated concentrations of dBET1 and dBET1(R) for 18 h. Values represent mean ± stdev of triplicate analysis, are normalized to DMSO treated cells and baseline corrected based on immunoblots in Supplementary Figure 2C
Figure 2
Figure 2. Chemical and genetic rescue of dBET1 and dFKBP-1 mediated degradation
(A) Immunoblot analysis for BRD4 and Vinculin after a 4 h pre-treatment with either DMSO, Carfilzomib (400 nM), JQ1 (10 μM) or thalidomide (10 μM) followed by a 2 h dBET1 treatment at a concentration of 100 nM in MV4;11 cells. (B) Immunoblot analysis for BRD4, CRBN and tubulin after treatment of MM1SWT or MM1SCRBN−/− with dBET1 for 18 h at the indicated concentrations. (C) structures of dFKBP-1 and dFKBP-2 (D) Immunoblot analysis for FKBP12 and Vinculin after 18 h treatment with the indicated compounds (E) Immunoblot analysis for FKBP12 and Vinculin after a 4 h pre-treatment with either DMSO, Carfilzomib (400 nM), MLN4924 (1 μM), SLF (20 μM) or thalidomide (10 μM) followed by a 4 h dFKBP-1 treatment at a concentration of 1 μM in MV4;11 cells. (F) Immunoblot analysis for FKBP12, CRBN and tubulin after treatment of 293FTWT or 293FTCRBN−/− with dFKBP12 at the indicated concentrations for 18 h.
Figure 3
Figure 3. Highly selective BET bromodomain degradation measured by expression proteomics
MV4;11 cells were treated for 2 hours with DMSO, 250 nM dBET1 or 250 nM JQ1. (A) depicts fold change of abundance of 7429 proteins comparing JQ1 to DMSO treatment as well as their respective p-value (t-test). Data results from triplicate analysis. (B) as for (A) but comparing 250 nM dBET1 to DMSO treatment. Data results from triplicate analysis. (C) bargraph depiction of selected proteins from (A) and (B) normalized to DMSO. Values represent mean ± stdev of triplicates. (D) Immunoblot analysis of BRD2, BRD3, BRD4, MYC, PIM1 and VINC after 2 h treatment of MV4;11 cells with either DMSO, 250 nM dBET1 or 250 nM JQ1. (E) bargraph depiction of qRT-PCR analysis of transcript levels of BRD2, BRD3, BRD4, MYC and PIM1 after 2 h treatment of MV4;11 cells with either DMSO, 250 nM dBET1 or 250 nM JQ1. Values represent mean +/− stdev of triplicates.
Figure 4
Figure 4. Improved kinetic properties in induction of apoptosis and in vivo proof of concept
(A) Bar graph depiction of fold increase of apoptosis assessed via caspase glo assay relative to DMSO treated controls, 24 h treatment in MV4;11 or DHL4 cells. Values represent mean ± stdev of quadruplicate analysis (B) Immunoblot analysis of cleaved caspase 3, PARP cleavage and vinculin after treatment with dBET1 and JQ1 at the indicated concentrations for 24 h. (C) bar graph depiction of fold increase of apoptosis assessed via caspase glo assay relative to DMSO treated controls. MV4;11 cells were treated for 4 or 8 h with JQ1 or dBET1 at the indicated concentrations. Drug were washed out with PBS (3×) before being plated in drug-free media for a final treatment duration of 24 h. (D) Immunoblot analysis of cleaved caspase 3, PARP cleavage and vinculin after identical treatment conditions described in (C). (E) Cellular viability dose-response data of dBET1 and JQ1 after treatment of MV4;11 for 24 h as determined by ATP levels. Values represent mean ± stdev of quadruplicate analysis. (F) Immunoblot analysis for BRD4 and Vinculin after treatment of primary patient cells with the indicated concentrations of dBET1 for 24 hours. (G) bargraph depiction of fraction of annexin V positive primary patient cells after 24 h treatment with either dBET1 or JQ1 at the indicated concentrations. Values represent the average of duplicates and the range as error bars. Representative counter plots in SFig 6. (H) tumor volume of vehicle treated mice (n=5) or mice treated with dBET1 at a concentration of 50 mg/kg (n=6) over a treatment period of 14 days. (I) tumor weight after termination of the experiment shown in (H) on day 14. (J) Immunoblot analysis for BRD4, MYC and Vinculin using tumor lysates from mice that have been treated either once for 4 h or twice for 22 h and 4h compared to a vehicle treated control. (K) Immunohistochemistry staining for BRD4, MYC and Ki67 of a representative tumor of a dBET1 treated and a control treated mouse. (L) quantification of (K) based on 3 independent areas within that section. Data represents mean ± stdev of triplicate analysis and is normalized to DMSO.

Comment in

References

    1. Bartlett JB, Dredge K, Dalgleish AG. Nat Rev Cancer. 2004;4:314–322. - PubMed
    1. Ito T, et al. Science. 2010;327:1345–1350. - PubMed
    1. Krönke J, et al. Science. 2014;343:301–305. - PMC - PubMed
    1. Lu G, et al. Science. 2014;343:305–309. - PMC - PubMed
    1. Fischer ES, et al. Nature. 2014;512:49–53. - PMC - PubMed

Publication types

MeSH terms

Associated data