Review
. 2015 Jun 25;125(26):3996-4009.
doi: 10.1182/blood-2015-03-580027. Epub 2015 May 21.

Minimal residual disease diagnostics in acute lymphoblastic leukemia: need for sensitive, fast, and standardized technologies

Affiliations
Review

Minimal residual disease diagnostics in acute lymphoblastic leukemia: need for sensitive, fast, and standardized technologies

Jacques J M van Dongen et al. Blood. .

Abstract

Monitoring of minimal residual disease (MRD) has become routine clinical practice in frontline treatment of virtually all childhood acute lymphoblastic leukemia (ALL) and in many adult ALL patients. MRD diagnostics has proven to be the strongest prognostic factor, allowing for risk group assignment into different treatment arms, ranging from significant treatment reduction to mild or strong intensification. Also in relapsed ALL patients and patients undergoing stem cell transplantation, MRD diagnostics is guiding treatment decisions. This is also why the efficacy of innovative drugs, such as antibodies and small molecules, are currently being evaluated with MRD diagnostics within clinical trials. In fact, MRD measurements might well be used as a surrogate end point, thereby significantly shortening the follow-up. The MRD techniques need to be sensitive (≤10(-4)), broadly applicable, accurate, reliable, fast, and affordable. Thus far, flow cytometry and polymerase chain reaction (PCR) analysis of rearranged immunoglobulin and T-cell receptor genes (allele-specific oligonucleotide [ASO]-PCR) are claimed to meet these criteria, but classical flow cytometry does not reach a solid 10(-4), whereas classical ASO-PCR is time-consuming and labor intensive. Therefore, 2 high-throughput technologies are being explored, ie, high-throughput sequencing and next-generation (multidimensional) flow cytometry, both evaluating millions of sequences or cells, respectively. Each of them has specific advantages and disadvantages.


Figures

Figure 1
Figure 1
Detection of MRD during follow-up of ALL patients. (A) Schematic diagram of relative frequencies of ALL cells in BM during and after treatment. I, induction treatment; C, consolidation treatment; II, reinduction treatment. The detection limit of cytomorphology and the detection limit of immunophenotyping and PCR techniques is indicated. (B) Follow-up of a T-ALL patient with CD5/TdT double immunofluorescence microscopy. The frequencies of the T-ALL cells in blood and BM are very comparable in this patient. D, diagnosis; CR, complete remission; Re, relapse.
Figure 2
Figure 2
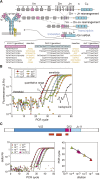
Basic principles of RQ-PCR–based MRD analysis using rearranged IG and TR genes as targets. (A) Schematic diagram of an IGH gene rearrangement, resulting in a V-D-J exon with highly diverse junctional regions, which differ in each individual B cell, even if by coincidence the same V, D, and J genes are used. (B) RQ-PCR analysis of an dilution experiment, showing the technical definitions for interpretation of RQ-PCR results. The amplification plot shows the position of the threshold and obtained Ct values, the quantitative range, the sensitivity, and the background signal. (C) Example of RQ-PCR MRD analysis using an Vδ2-Dδ2-Jα11 rearrangement as target. One primer and the TaqMan probe are positioned at the Vδ2 gene and the other primer is an ASO primer, positioned at the Vδ2-Dδ2 junctional region. The amplification plot (right) shows the dilution experiment and the follow-up sample (in triplicate). The corresponding standard curve (left) is based on the dilution experiment and allows calculation of the ALL cell frequency in the follow-up sample.
Figure 3
Figure 3
ALL cell frequencies in blood and BM samples during follow-up. (A) Frequencies of T-cell marker+/TdT+ T-ALL cells, as detected by immunofluorescence microscopy in 321 paired blood and BM samples, obtained from 26 patients., The T-ALL cell frequencies are comparable in many pairs, but differences can occur up to 1 log. Orange, sample <3 months of follow-up; green, >3 months of follow-up. (B) (Left) Frequencies of ALL cells in 149 paired blood and BM samples from 22 T-ALL patients, analyzed by RQ-PCR of TR gene rearrangements and TAL1 deletions. A strong correlation was observed between the blood and BM frequencies in T-ALL. (Right) Frequencies of ALL cells in 532 paired blood and BM samples from 62 BCP-ALL patients, analyzed by RQ-PCR of IG and TR gene rearrangements. The MRD levels were significantly higher in BM compared with blood. Moreover, the ratio between the MRD levels in BM and blood was highly variable, ranging from 1 to 3 logs. Orange, sample <3 months of follow-up; green, >3 months of follow-up. (C) Frequencies of ALL cells in 141 paired BM samples (left-right) from 26 patients, showing a very high concordance. Only in case of very low MRD levels was variation seen, mainly because of levels outside the quantitative range of the RQ-PCR assay. Orange, sample <3 months of follow-up; green, >3 months of follow-up. (D) Recovery of BM mononuclear cells after ficoll density centrifugation at different time points during follow-up in the DCOG-ALL11 protocol. Recovery of mononuclear cells is relatively low at days 33 and 78 (median, 5-8 × 10⁶). Recovery at day 78 and at later time points is much higher (median, 18-40 × 106).
Figure 4
Figure 4
Long-term follow-up in childhood ALL patients, classified according to MRD measurements. (A) Disease-free survival of 129 ALL patients, classified according to 3 MRD-based risk groups in the International BFM study. Patients were classified as MRD-low-risk if no MRD was detected at day 33 (TP1) and at day 78 (TP2); patients with MRD ≥10−3 at TP2 were classified as MRD-high-risk; all other patients had MRD <10−3 at TP2 and were classified as MRD-intermediate-risk. (B) Disease-free survival of 54 infant ALL cases, treated according to the INTERFANT-99 treatment protocol. Patients were considered MRD-high-risk if the MRD level at TP3 was ≥10−4; patients were considered MRD-low-risk if MRD levels were <10−4 at both time points; all remaining patients were considered MRD-medium-risk. Only 3 of 24 MRD-low-risk patients relapsed, whereas all 14 MRD-high-risk patients relapsed. (C) Event-free survival of 3184 BCP-ALL patients of the AEIOP-BFM 2000 study (with kind permission by Dr V. Conter, Monza, Italy). Patients were classified as MRD-standard-risk (SR) if no MRD was detected at day 33 (TP1) and at day 78 (TP2) and as MRD-intermediate-risk (IR) when MRD was positive at 1 or both TPs but <10−3 at TP2. Patients with MRD ≥10−3 at TP2 were classified as MRD-high-risk (HR). (D) Event-free survival of 464 T-ALL patients of the AEIOP-BFM-ALL 2000 study (with kind permission by M. Schrappe, Kiel, Germany). The MRD-based classification is the same as for C.
Figure 5
Figure 5
Results of prospective clinical trials on adult Ph-ALL according to MRD response. (A) Results of the NILG ALL 09/00 trial (with kind permission by Dr R. Bassan, Bergamo, Italy)., Disease-free survival according to MRD levels at weeks 16 and 22. MRDneg, negative or low MRD positivity (10−4) at week 16 and no detectable MRD at week 22; MRDpos, all other patients with evaluable MRD results; MRDu/k, MRD risk class unknown. (B) Results of the GMALL 06/99 and 07/03 trials (with kind permission by N. Gökbuget, Frankfurt, Germany). Probability of continuous complete remission according to MRD at week 16 in SR and HR patients. MolCR, MRD negativity with an assay sensitivity of ≥10−4; MolFail, quantifiable MRD positivity ≥10−4. (C) Results of the PETHEMA ALL-AR-03 trial (with kind permission by J. Ribera, Barcelona, Spain). Disease-free survival for HR patients by intention to treat. Assignment to postconsolidation therapy according to early cytomorphologic response and postconsolidation flow-MRD (weeks 16-18): assignment to chemotherapy if <10% blasts in bone marrow (day 14) and flow MRD <5 × 10⁻⁴ (weeks 16-18); assignment to allo-HSCT if ≥10% blasts in BM (day 14) and/or flow MRD ≥ 5 × 10⁻⁴ (weeks 16-18). (D) Results of the GRAALL-2003/2005 trials (with kind permission by H. Dombret, Paris, France). Simon-Makuch plots of SCT time-dependent analysis of RFS according to MRD at week 6 and type of postremission treatment (SCT vs no SCT) in HR Ph-negative ALL.
Figure 6
Figure 6
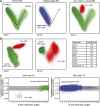
EuroFlow-based multidimensional analysis of normal and malignant BCP cells. (A) (Left) Automated population separation of normal B-cell differentiation in BM (BCP cells and more mature B cells). (Center) Automated population separation view of BCP cells in regenerating BM (blue dots), plotted against the normal B-cell differentiation (green arrow), showing that regenerating BCP cells (hematogones) are fully comparable to BCP cells in normal BM. (Right) Plotting of ALL cells (red dots) against normal B-cell differentiation (green), showing that the ALL cells differ from normal B cells. (B) (Left) ALL cells (in red) plotted against normal BCP cells (green). (Center) ALL cells (red) plotted against immature CD34+ BCP cells only, showing that the ALL cells separate from their normal counterparts. (Right) The separation is not based on a single marker but on multiple markers (in this case: CD10, FSC, CD38, etc). (C) Normalized B-cell maturation pathway (gray zone), allowing to assess differences in CD38 expression between ALL cells and normal cells to support MRD detection. (Left) MRD analysis in BM at day 33, showing complete deletion of the normal BCP cells, but presence of normal more mature B cells (green) within the normal B-cell pathway, as well as a small population of ALL cells with aberrant (low) CD38 expression. (Right) MRD analysis of BM at day 78 of the same patient as in the left panel, now showing regeneration of normal BCP cells (blue dots), which fit with the normalized B-cell differentiation pathway (gray zone). No aberrant cells were detected at day 78 in this patient sample.
Figure 7
Figure 7
Schematic diagram showing the various steps in HTS of IG and TR for MRD detection. (Top) The IG or TR gene rearrangements are amplified in a single step using a super-multiplex PCR with many different primers, which match with one or more individual V and J genes of the IG and TR genes. The primers contain a platform-specific adaptor (red) and a unique identifier (barcode) for each sample (green). (Middle) After PCR amplification, HTS is being performed, using sequence primers directed against the platform-specific adaptors. (Bottom) The obtained sequencing data are processed via a specially designed bioinformatic pipeline, which includes error correction, annotation of the gene segments, meta-analysis, and visualization of the results (www.EuroClonality.org).

References

    1. van Dongen JJ, Seriu T, Panzer-Grümayer ER, et al. Prognostic value of minimal residual disease in acute lymphoblastic leukaemia in childhood. Lancet. 1998;352(9142):1731–1738. - PubMed
    1. Cavé H, van der Werff ten Bosch J, Suciu S, et al. European Organization for Research and Treatment of Cancer–Childhood Leukemia Cooperative Group. Clinical significance of minimal residual disease in childhood acute lymphoblastic leukemia. European Organization for Research and Treatment of Cancer—Childhood Leukemia Cooperative Group. N Engl J Med. 1998;339(9):591–598. - PubMed
    1. Coustan-Smith E, Behm FG, Sanchez J, et al. Immunological detection of minimal residual disease in children with acute lymphoblastic leukaemia. Lancet. 1998;351(9102):550–554. - PubMed
    1. Borowitz MJ, Devidas M, Hunger SP, et al. Children’s Oncology Group. Clinical significance of minimal residual disease in childhood acute lymphoblastic leukemia and its relationship to other prognostic factors: a Children’s Oncology Group study. Blood. 2008;111(12):5477–5485. - PMC - PubMed
    1. Raff T, Gökbuget N, Lüschen S, et al. GMALL Study Group. Molecular relapse in adult standard-risk ALL patients detected by prospective MRD monitoring during and after maintenance treatment: data from the GMALL 06/99 and 07/03 trials. Blood. 2007;109(3):910–915. - PubMed

MeSH terms