. 2015 May 6:9:42.
doi: 10.3389/fncom.2015.00042. eCollection 2015.

Restoring the encoding properties of a stochastic neuron model by an exogenous noise

Affiliations

Restoring the encoding properties of a stochastic neuron model by an exogenous noise

Alessandra Paffi et al. Front Comput Neurosci. .

Abstract

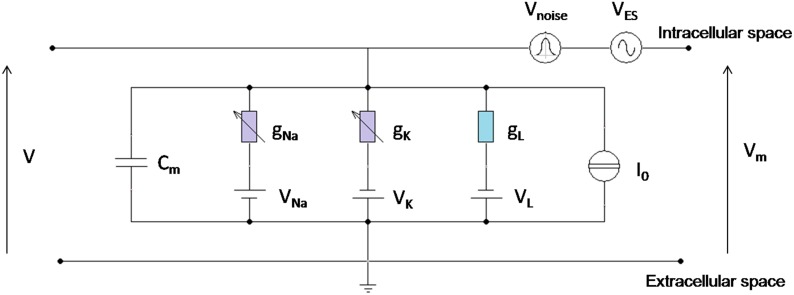
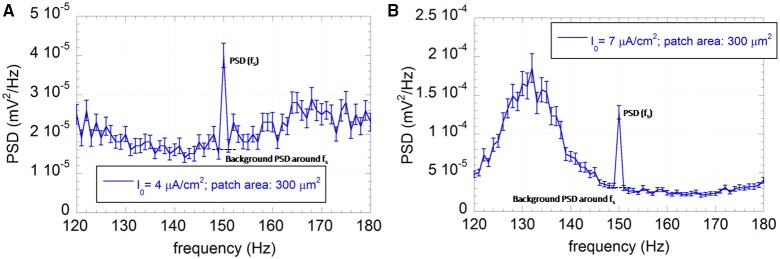
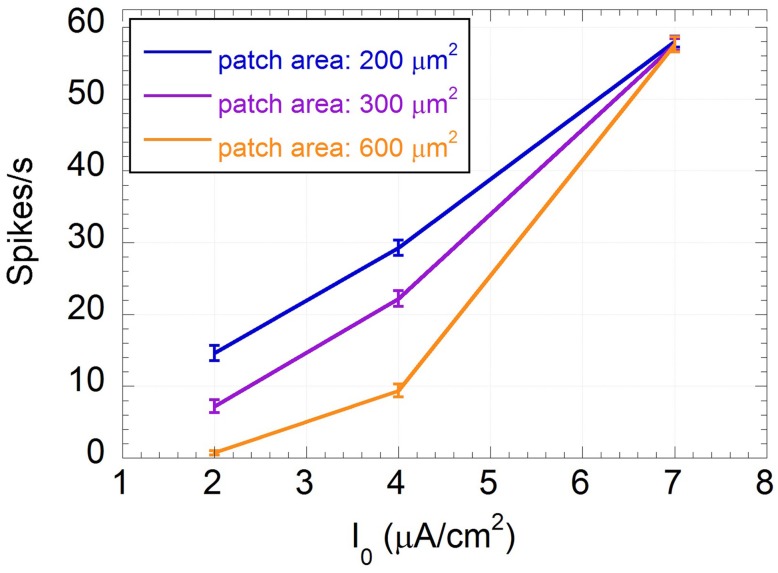
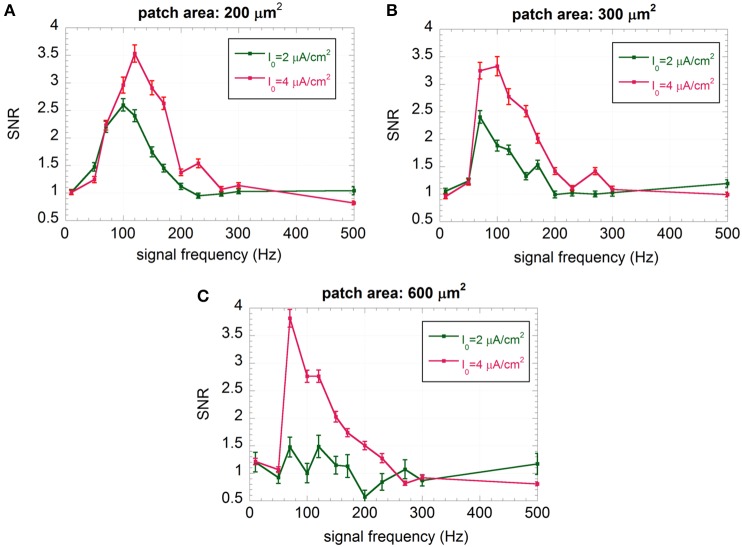
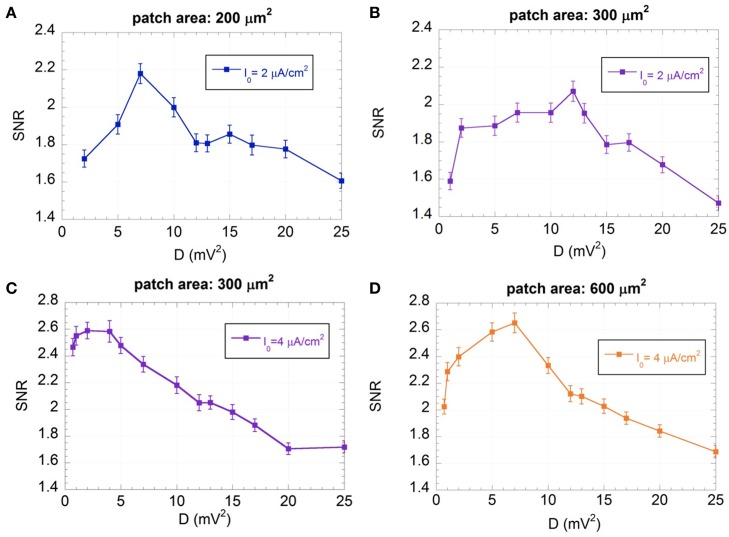
Here we evaluate the possibility of improving the encoding properties of an impaired neuronal system by superimposing an exogenous noise to an external electric stimulation signal. The approach is based on the use of mathematical neuron models consisting of stochastic HH-like circuit, where the impairment of the endogenous presynaptic inputs is described as a subthreshold injected current and the exogenous stimulation signal is a sinusoidal voltage perturbation across the membrane. Our results indicate that a correlated Gaussian noise, added to the sinusoidal signal can significantly increase the encoding properties of the impaired system, through the Stochastic Resonance (SR) phenomenon. These results suggest that an exogenous noise, suitably tailored, could improve the efficacy of those stimulation techniques used in neuronal systems, where the presynaptic sensory neurons are impaired and have to be artificially bypassed.

Keywords: HH model; electric stimulation; exogenous noise; signal detection; single neuron; stochastic resonance.


Figures

Figure 1
Figure 1
Circuital representation of the neuron model. Cm is the specific membrane capacitance; gL is the leakage specific conductance; gNa and gk are Sodium and Potassium specific conductances, voltage (Vm) dependent; I0 is the specific stimulation current; VNa, VK, VL are the reversal potentials for Sodium, Potassium, and leakage currents, respectively; VES and Vnoise are the voltage perturbations, due to the exogenous electric signal and the exogenous Gaussian noise, superimposed to the physiological membrane voltage V; Vm is the total voltage between the intracellular and the extracellular space.
Figure 2
Figure 2
(A) Histogram showing the zero-mean Gaussian distribution of the exogenous voltage noise with power D = 2 mV2; the standard deviation (σ) of the distribution is equal to the square root of D. (B) Normalized Power Spectral Density of the exogenous voltage noise (blue line) compared with the theoretical Lorentzian spectrum with cutoff angular frequency ωc = 2.5 ×10³ rad/s (red line).
Figure 3
Figure 3
Average PSD with the associated standard error (R = 100) of the output sequence U(t) for the neuron model with patch area 300 μm2 and I0 = 4 μA/cm2 (A) or I0 = 7 μA/cm2 (B). The applied exogenous signal is a sinusoid at 150 Hz, 500 μV of amplitude.
Figure 4
Figure 4
Mean number of spikes per second and standard error calculated over the frequency of the input sinusoidal signal vs. the input constant current I0 for patch areas: 200 (blue line), 300 (purple line), and 600 (orange line) μm2.
Figure 5
Figure 5
Mean SNR and standard error (R = 100) vs. the signal frequency for I0 = 7 μA/cm2 and membrane patches of 200, 300, and 600 μm2; the signal is a sinusoid with amplitude VES = 500 μV and frequency ranging from 10 to 500 Hz.
Figure 6
Figure 6
Mean SNR and standard error (R = 100) vs. the signal frequency for I0 = 2 and 4 μA/cm2 and membrane patches of 200 μm2 (A), 300 μm2 (B), and 600 μm2 (C); the signal is a sinusoid with amplitude VES = 500 μV and frequency ranging from 10 to 500 Hz.
Figure 7
Figure 7
Mean SNR and standard error (R = 300) as a function of the variance of the exogenous noise (D) for I0 = 2 μA/cm2 and membrane patches of 200 (A) and 300 μm2 (B), and for I0 = 4 μA/cm2 and membrane patches of 300 μm2 (C) and 600 μm2 (D); the signal is a sinusoid with amplitude VES = 500 μV and frequency f = 150 Hz; the exogenous noise is a zero mean Gaussian process with a Lorentzian spectrum (ωc = 2.5×10³ rad/s).
Figure 8
Figure 8
Mean number of spikes per second and standard error (R = 300) as a function of the variance of the exogenous noise (D) for I0 = 2 μA/cm2 and membrane patches of 200 μm2 (solid blue line) and 300 μm2 (solid purple line), and for I0 = 4 μA/cm2 and membrane patches of 300 μm2 (dashed purple line) and 600 μm2 (dashed orange line); the signal is a sinusoid with amplitude VES = 500 μV and frequency f = 150 Hz; the exogenous noise is a zero mean Gaussian process with a Lorentzian spectrum (ωc = 2.5×10³ rad/s).

References

    1. Ahmed Z., Wieraszko A. (2009). The influence of pulsed magnetic fields (PMFs) on nonsynaptic potentials recorded from the central and peripheral nervous systems in vitro. Bioelectromagnetics 30, 621–630. 10.1002/bem.20516 - DOI - PubMed
    1. Apollonio F., Liberti M., d'Inzeo G., Tarricone L. (2000). Integrated models for analysis of biological effects of EM fields used for mobile communications. IEEE Trans. Microw. Theory Tech. 48, 2082–2093 10.1109/22.884199 - DOI
    1. Apollonio F., Liberti M., Paffi A., Merla C., Marracino P., Denzi A., et al. (2013). Feasibility for microwaves energy to affect biological systems via nonthermal mechanisms: a systematic approach. Trans. Microw. Theory Tech. 61, 2031–2045 10.1109/TMTT.2013.2250298 - DOI
    1. Brock A. A., Friedman R. M., Fan R. H., Roe A. W. (2013). Optical imaging of cortical networks via intracortical microstimulation. J. Neurophysiol. 110, 2670–2678. 10.1152/jn.00879.2012 - DOI - PMC - PubMed
    1. Bulsara A. R., Maren A. J., Schmera G. (1993). Single effective neuron: Dendritic coupling effects and stochastic resonance. Biol. Cybern. 70, 145–156 10.1007/BF00200828 - DOI