

Changes in gene expression, cell physiology and toxicity of the harmful cyanobacterium Microcystis aeruginosa at elevated CO2
- PMID: 25999931
- PMCID: PMC4419860
- DOI: 10.3389/fmicb.2015.00401
Changes in gene expression, cell physiology and toxicity of the harmful cyanobacterium Microcystis aeruginosa at elevated CO2
Abstract
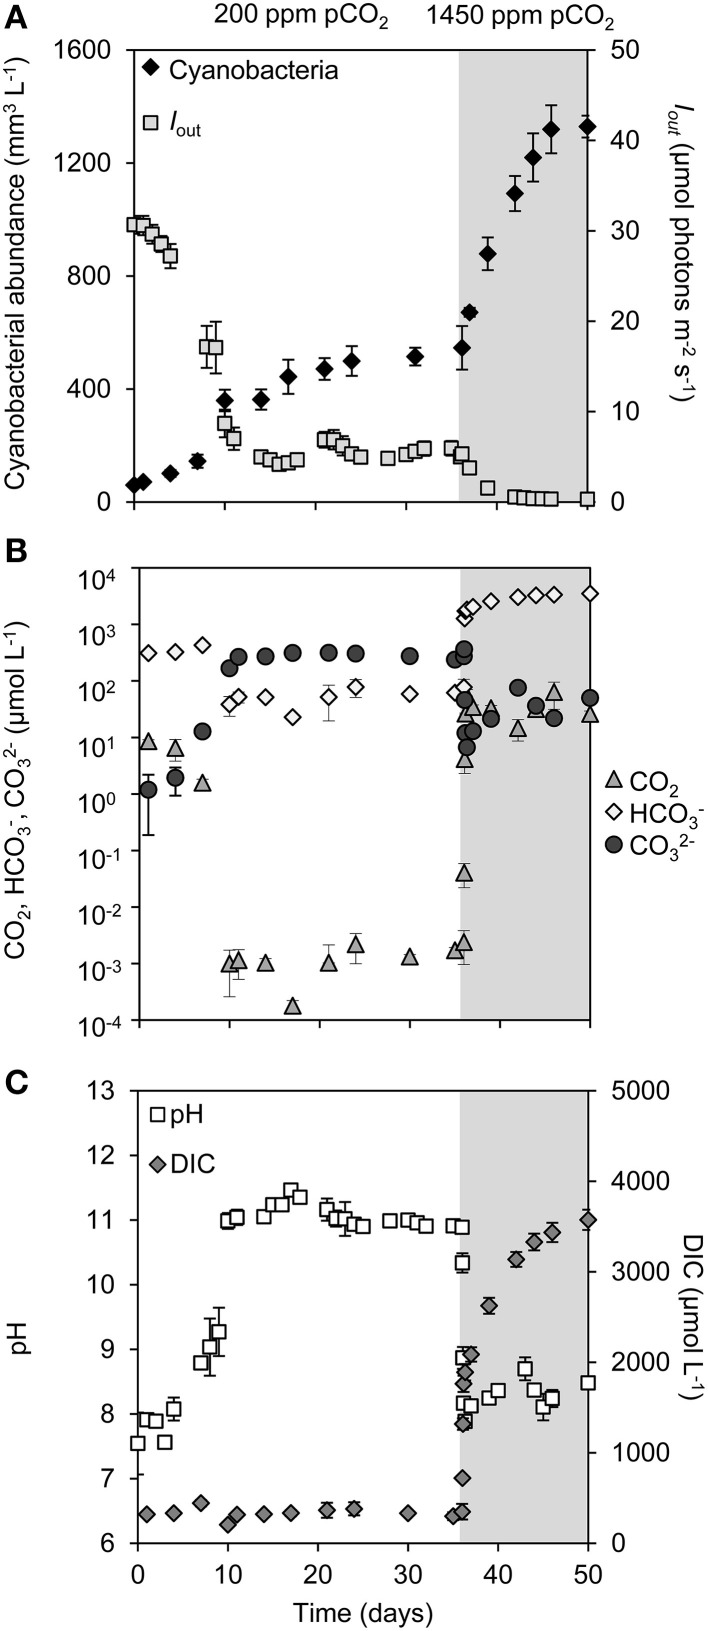
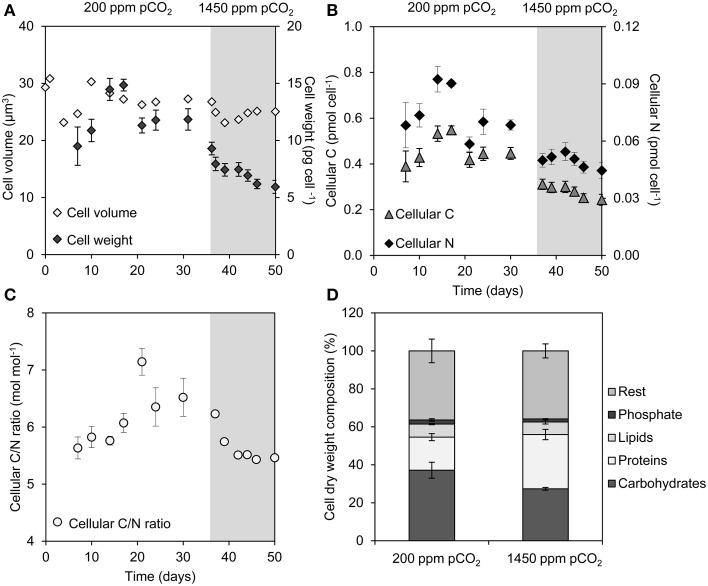
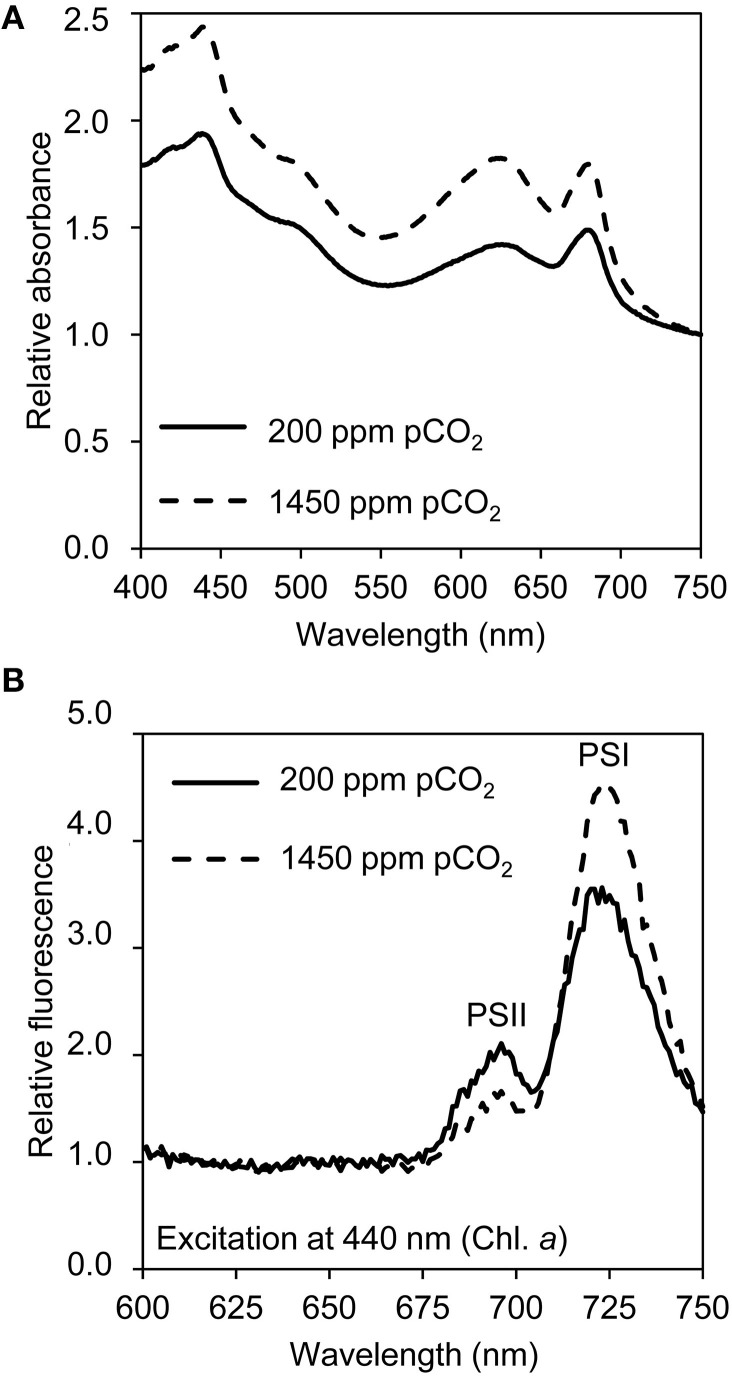
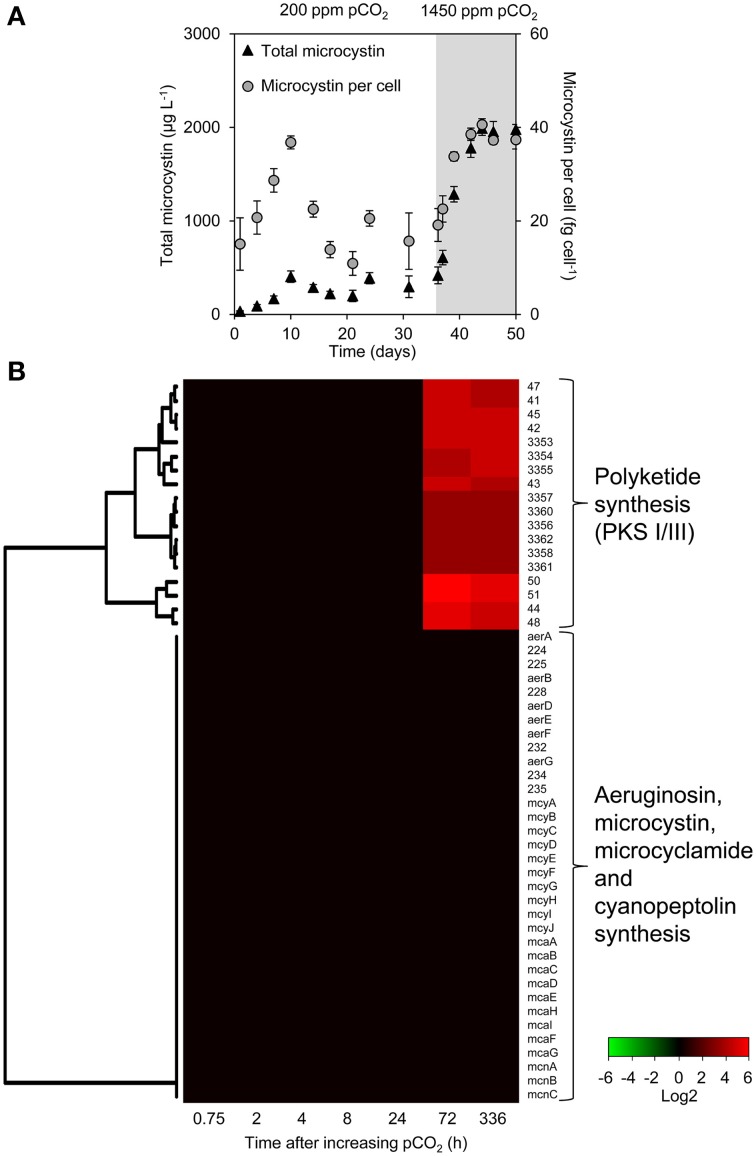
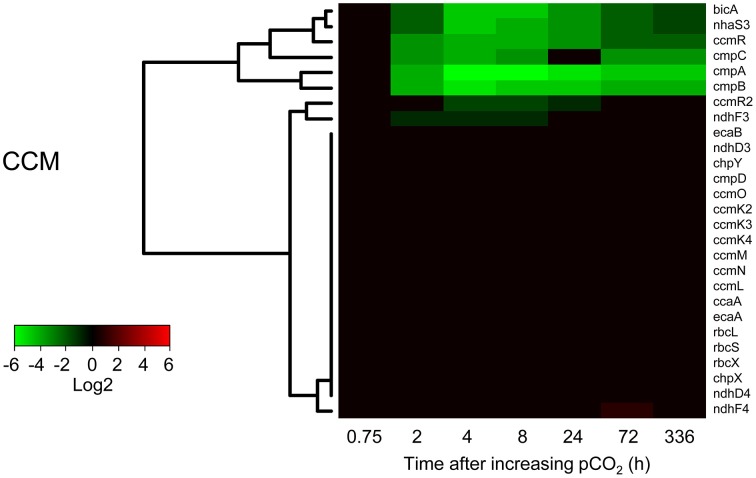
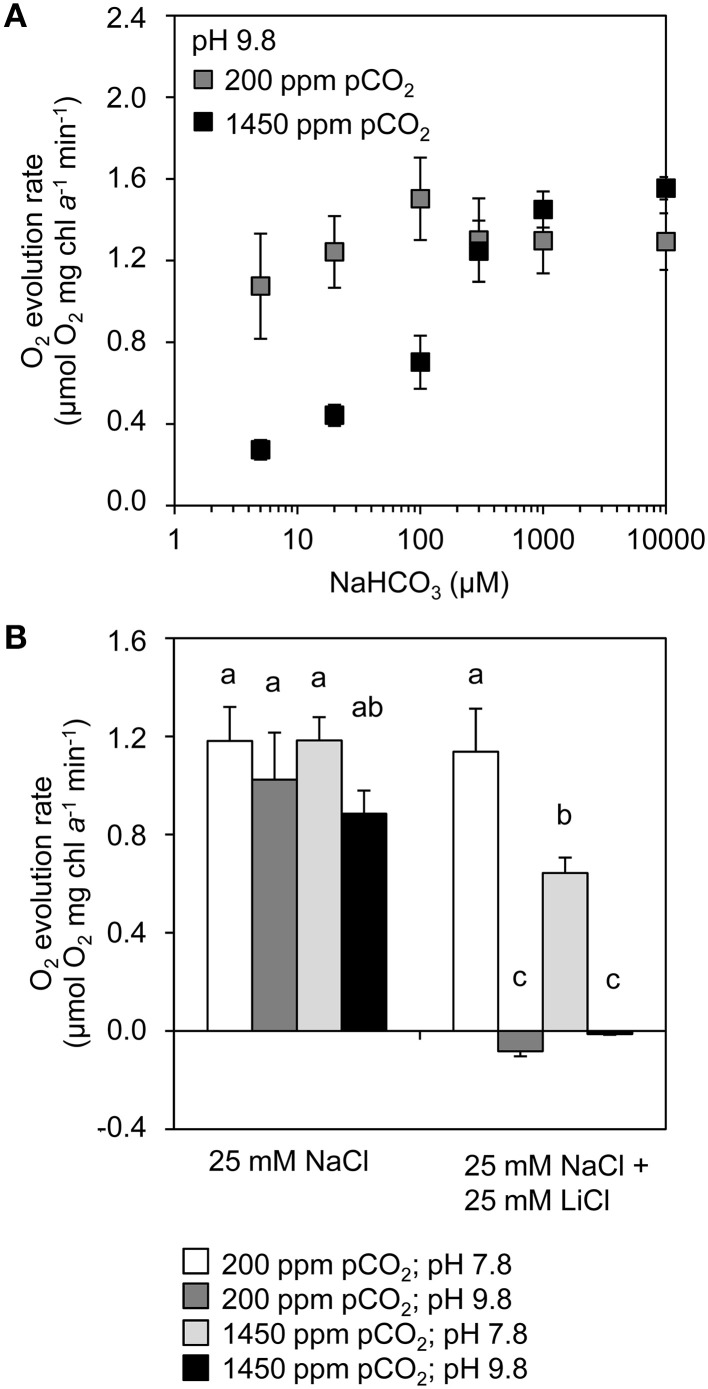
Rising CO2 concentrations may have large effects on aquatic microorganisms. In this study, we investigated how elevated pCO2 affects the harmful freshwater cyanobacterium Microcystis aeruginosa. This species is capable of producing dense blooms and hepatotoxins called microcystins. Strain PCC 7806 was cultured in chemostats that were shifted from low to high pCO2 conditions. This resulted in a transition from a C-limited to a light-limited steady state, with a ~2.7-fold increase of the cyanobacterial biomass and ~2.5-fold more microcystin per cell. Cells increased their chlorophyll a and phycocyanin content, and raised their PSI/PSII ratio at high pCO2. Surprisingly, cells had a lower dry weight and contained less carbohydrates, which might be an adaptation to improve the buoyancy of Microcystis when light becomes more limiting at high pCO2. Only 234 of the 4691 genes responded to elevated pCO2. For instance, expression of the carboxysome, RuBisCO, photosystem and C metabolism genes did not change significantly, and only a few N assimilation genes were expressed differently. The lack of large-scale changes in the transcriptome could suit a buoyant species that lives in eutrophic lakes with strong CO2 fluctuations very well. However, we found major responses in inorganic carbon uptake. At low pCO2, cells were mainly dependent on bicarbonate uptake, whereas at high pCO2 gene expression of the bicarbonate uptake systems was down-regulated and cells shifted to CO2 and low-affinity bicarbonate uptake. These results show that the need for high-affinity bicarbonate uptake systems ceases at elevated CO2. Moreover, the combination of an increased cyanobacterial abundance, improved buoyancy, and higher toxin content per cell indicates that rising atmospheric CO2 levels may increase the problems associated with the harmful cyanobacterium Microcystis in eutrophic lakes.
Keywords: CO2-concentrating mechanisms; bicarbonate uptake; climate change; harmful algal blooms; inorganic carbon uptake; microarrays; microcystins; phytoplankton.
Figures
Similar articles
-
Diel Variation in Gene Expression of the CO2-Concentrating Mechanism during a Harmful Cyanobacterial Bloom.Front Microbiol. 2016 Apr 22;7:551. doi: 10.3389/fmicb.2016.00551. eCollection 2016. Front Microbiol. 2016. PMID: 27148233 Free PMC article.
-
The harmful cyanobacterium Microcystis aeruginosa PCC7806 is more resistant to hydrogen peroxide at elevated CO2.Harmful Algae. 2023 Oct;128:102482. doi: 10.1016/j.hal.2023.102482. Epub 2023 Aug 2. Harmful Algae. 2023. PMID: 37714576
-
Strains of the Harmful Cyanobacterium Microcystis aeruginosa Differ in Gene Expression and Activity of Inorganic Carbon Uptake Systems at Elevated CO2 Levels.Appl Environ Microbiol. 2015 Nov;81(22):7730-9. doi: 10.1128/AEM.02295-15. Epub 2015 Aug 28. Appl Environ Microbiol. 2015. PMID: 26319871 Free PMC article.
-
How rising CO2 and global warming may stimulate harmful cyanobacterial blooms.Harmful Algae. 2016 Apr;54:145-159. doi: 10.1016/j.hal.2015.12.006. Harmful Algae. 2016. PMID: 28073473 Review.
-
Colony formation in the cyanobacterium Microcystis.Biol Rev Camb Philos Soc. 2018 Aug;93(3):1399-1420. doi: 10.1111/brv.12401. Epub 2018 Feb 22. Biol Rev Camb Philos Soc. 2018. PMID: 29473286
Cited by
-
Responses of the marine diatom Thalassiosira pseudonana to changes in CO2 concentration: a proteomic approach.Sci Rep. 2017 Feb 9;7:42333. doi: 10.1038/srep42333. Sci Rep. 2017. PMID: 28181560 Free PMC article.
-
Competition between cyanobacteria and green algae at low versus elevated CO2: who will win, and why?J Exp Bot. 2017 Jun 1;68(14):3815-3828. doi: 10.1093/jxb/erx027. J Exp Bot. 2017. PMID: 28207058 Free PMC article.
-
Effects of temperature up-shift and UV-A radiation on fatty acids content and expression of desaturase genes in cyanobacteria Microcystis aeruginosa: stress tolerance and acclimation responses.Photochem Photobiol Sci. 2024 Jun;23(6):1167-1178. doi: 10.1007/s43630-024-00584-9. Epub 2024 May 8. Photochem Photobiol Sci. 2024. PMID: 38717721
-
An efficient and affordable laboratory method to produce and sustain high concentrations of microcystins by Microcystis aeruginosa.MethodsX. 2019 Oct 31;6:2521-2535. doi: 10.1016/j.mex.2019.10.024. eCollection 2019. MethodsX. 2019. PMID: 31763185 Free PMC article.
-
Bloom Dynamics of Cyanobacteria and Their Toxins: Environmental Health Impacts and Mitigation Strategies.Front Microbiol. 2015 Nov 17;6:1254. doi: 10.3389/fmicb.2015.01254. eCollection 2015. Front Microbiol. 2015. PMID: 26635737 Free PMC article. Review.
References
-
- Balmer M. B., Downing J. A. (2011). Carbon dioxide concentrations in eutrophic lakes: undersaturation implies atmospheric uptake. Inland Waters 1, 125–132 10.5268/IW-4.1.614 - DOI
-
- Benjamini Y., Yekutieli D. (2001). The control of the false discovery rate in multiple testing under dependence. Ann. Statist. 29, 1165–1188 10.1214/aos/1013699998 - DOI
-
- Bersanini L., Battchikova N., Jokel M., Rehman A., Vass I., Allahverdiyeva Y., et al. . (2014). Flavodiiron protein Flv2/Flv4-related photoprotective mechanism dissipates excitation pressure of PSII in cooperation with phycobilisomes in cyanobacteria. Plant Physiol. 164, 805–818. 10.1104/pp.113.231969 - DOI - PMC - PubMed
LinkOut - more resources
Full Text Sources
Other Literature Sources