. 2015 May 21;161(5):1202-1214.
doi: 10.1016/j.cell.2015.05.002.

Highly Parallel Genome-wide Expression Profiling of Individual Cells Using Nanoliter Droplets

Affiliations

Highly Parallel Genome-wide Expression Profiling of Individual Cells Using Nanoliter Droplets

Evan Z Macosko et al. Cell. .

Abstract

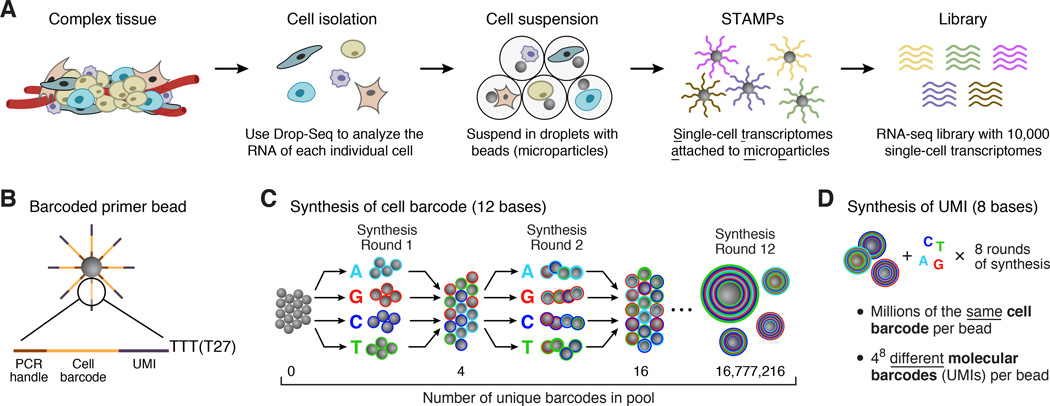
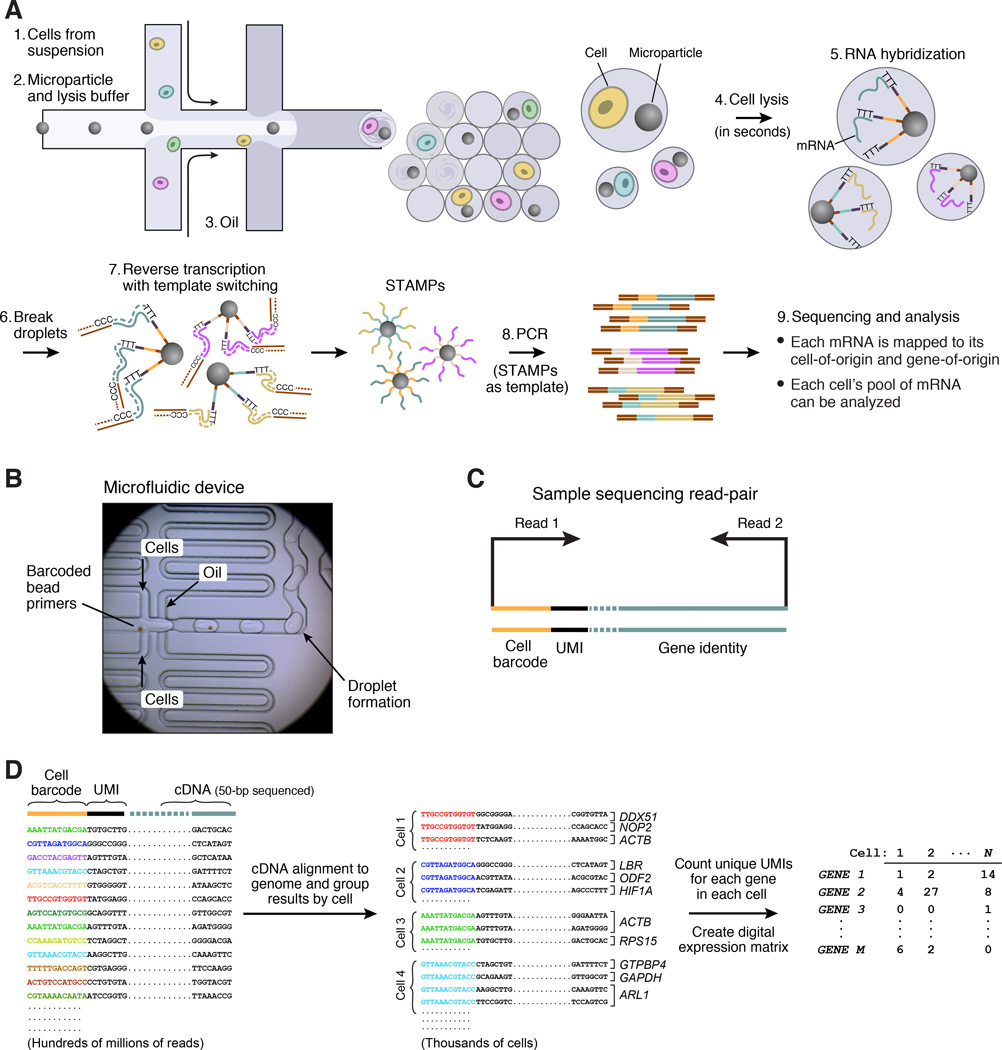
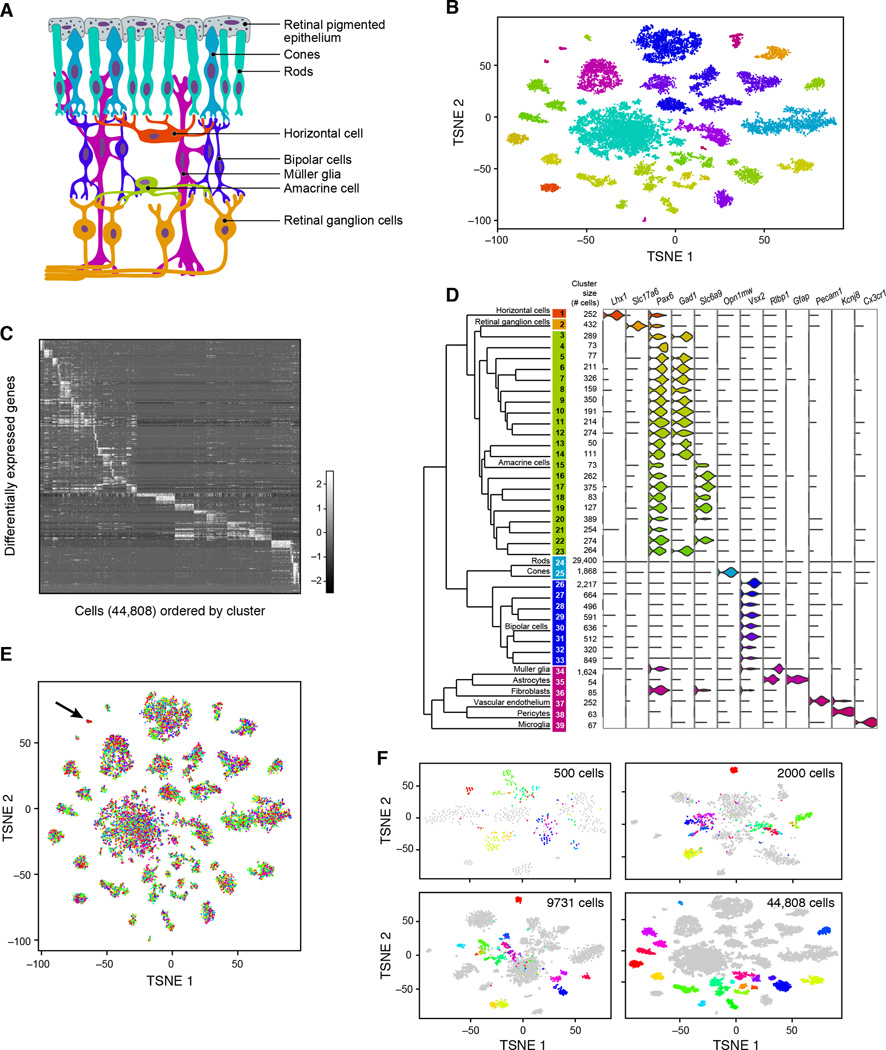
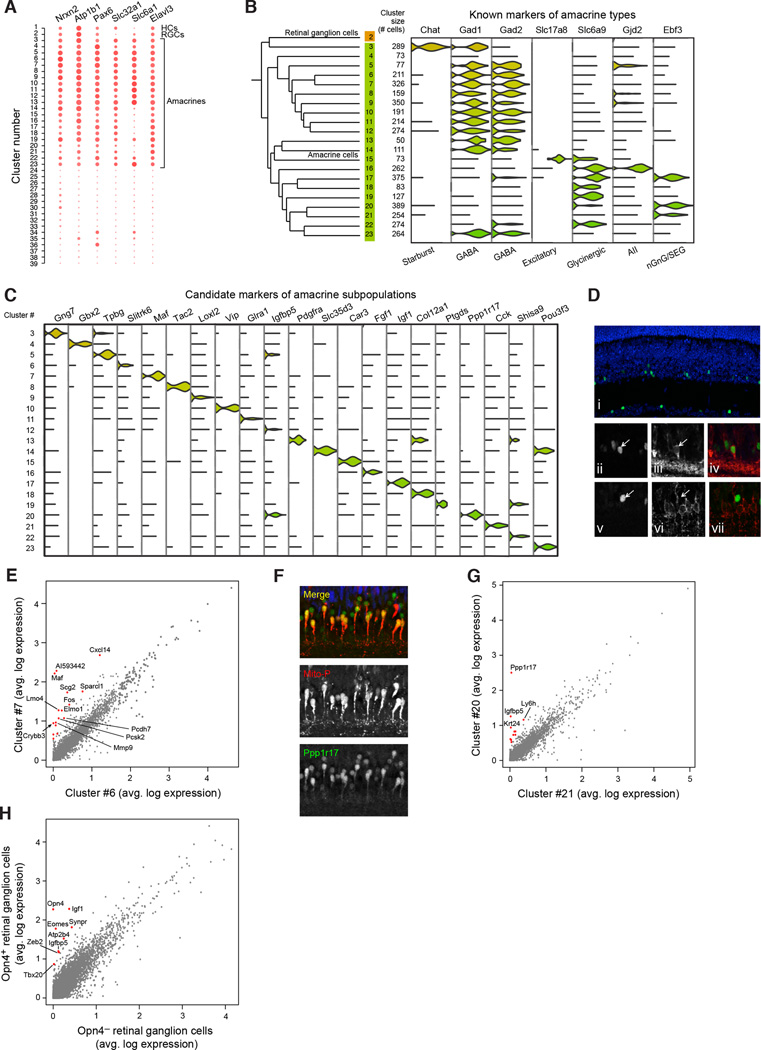
Cells, the basic units of biological structure and function, vary broadly in type and state. Single-cell genomics can characterize cell identity and function, but limitations of ease and scale have prevented its broad application. Here we describe Drop-seq, a strategy for quickly profiling thousands of individual cells by separating them into nanoliter-sized aqueous droplets, associating a different barcode with each cell's RNAs, and sequencing them all together. Drop-seq analyzes mRNA transcripts from thousands of individual cells simultaneously while remembering transcripts' cell of origin. We analyzed transcriptomes from 44,808 mouse retinal cells and identified 39 transcriptionally distinct cell populations, creating a molecular atlas of gene expression for known retinal cell classes and novel candidate cell subtypes. Drop-seq will accelerate biological discovery by enabling routine transcriptional profiling at single-cell resolution. VIDEO ABSTRACT.


Figures

Figure 1
Figure 1. Molecular barcoding of cellular transcriptomes in droplets
(A) Drop-Seq barcoding schematic. A complex tissue is dissociated into individual cells, which are then encapsulated in droplets together with microparticles (gray circles) that deliver barcoded primers. Each cell is lysed within a droplet; its mRNAs bind to the primers on its companion microparticle. The mRNAs are reverse-transcribed into cDNAs, generating a set of beads called “single-cell transcriptomes attached to microparticles” (STAMPs). The barcoded STAMPs can then be amplified in pools for high-throughput mRNA-seq to analyze any desired number of individual cells. (B) Sequence of primers on the microparticle. The primers on all beads contain a common sequence (“PCR handle”) to enable PCR amplification after STAMP formation. Each microparticle contains more than 108 individual primers that share the same “cell barcode” (panel C) but have different unique molecular identifiers (UMIs), enabling mRNA transcripts to be digitally counted (panel D). A 30 bp oligo dT sequence is present at the end of all primer sequences for capture of mRNAs. (C) Split-and-pool synthesis of the cell barcode. To generate the cell barcode, the pool of microparticles is repeatedly split into four equally sized oligonucleotide synthesis reactions, to which one of the four DNA bases is added, and then pooled together after each cycle, in a total of 12 split-pool cycles. The barcode synthesized on any individual bead reflects that bead’s unique path through the series of synthesis reactions. The result is a pool of microparticles, each possessing one of 412 (16,777,216) possible sequences on its entire complement of primers (see also Figure S1). (D) Synthesis of a unique molecular identifier (UMI). Following the completion of the “split-and-pool” synthesis cycles, all microparticles are together subjected to eight rounds of degenerate synthesis with all four DNA bases available during each cycle, such that each individual primer receives one of 48 (65,536) possible sequences (UMIs).
Figure 2
Figure 2. Extraction and processing of single-cell transcriptomes by Drop-Seq
(A) Schematic of single-cell mRNA-Seq library preparation with Drop-Seq. A custom-designed microfluidic device joins two aqueous flows before their compartmentalization into discrete droplets. One flow contains cells, and the other flow contains barcoded primer beads suspended in a lysis buffer. Immediately following droplet formation, the cell is lysed and releases its mRNAs, which then hybridize to the primers on the microparticle surface. The droplets are broken by adding a reagent to destabilize the oil-water interface (Experimental Procedures), and the microparticles collected and washed. The mRNAs are then reverse-transcribed in bulk, forming STAMPs, and template switching is used to introduce a PCR handle downstream of the synthesized cDNA (Zhu et al., 2001). (B) Microfluidic device used in Drop-Seq. Beads (brown in image), suspended in a lysis agent, enter the device from the central channel; cells enter from the top and bottom. Laminar flow prevents mixing of the two aqueous inputs prior to droplet formation (see also Movie S1). Schematics of the device design and how it is operated can be found in Figure S2. (C) Molecular elements of a Drop-Seq sequencing library. The first read yields the cell barcode and UMI. The second, paired read interrogates sequence from the cDNA (50 bp is typically sequenced); this sequence is then aligned to the genome to determine a transcript’s gene of origin. (D) In silicoreconstruction of thousands of single-cell transcriptomes. Millions of paired-end reads are generated from a Drop-Seq library on a high-throughput sequencer. The reads are first aligned to a reference genome to identify the gene-of-origin of the cDNA. Next, reads are organized by their cell barcodes, and individual UMIs are counted for each gene in each cell (Extended Experimental Procedures). The result, shown at far right, is a “digital expression matrix” in which each column corresponds to a cell, each row corresponds to a gene, and each entry is the integer number of transcripts detected from that gene, in that cell.
Figure 3
Figure 3. Critical evaluation of Drop-Seq using species-mixing experiments
(A,B) Drop-Seq analysis of mixutres of mouse and human cells. Mixtures of human (HEK) and mouse (3T3) cells were analyzed by Drop-Seq at the concentrations shown. The scatter plot shows the number of human and mouse transcripts associating to each STAMP. Blue dots indicate STAMPs that were designated from these data as human-specifiic (average of 99% human transcripts); red dots indicate STAMPs that were mouse-specific (average 99%). At the lower cell concentration, one STAMP barcode (of 570) associated with a mixture of human and mouse transcripts (panel A, purple). At the higher cell concentration, about 1.9% of STAMP barcodes associated with mouse-human mixtures (panel B). Data for other cell concentrations and a different single-cell analysis platform are in Figures S3B and S3C. (C,D) Sensitivity analysis of Drop-Seq at high read-depth. Violin plots show the distribution of the number of transcripts (C, scored by UMIs) and genes (D) detected per cell for 54 HEK (human) STAMPs (blue) and 28 3T3 (mouse) STAMPs (green) that were sequenced to a mean read depth of 737,240 high-quality aligned reads per cell. (E,F) Correlation between gene expression measurements in Drop-Seq and non-single-cell RNA-seq methods. Comparison of Drop-Seq gene expression measurements (averaged across 550 STAMPs) to measurements from bulk RNA analyzed by: (E) an in-solution template switch amplification (TSA) procedure similar to Smart-Seq2 (Picelli et al., 2013) (Extended Experimental Procedures); and (F) Illumina TruSeq mRNA-Seq. All comparisons involve RNA derived from the same cell culture flask (3T3 cells). All expression counts were converted to average transcripts per million (ATPM) and plotted as log (1+ATPM). (G) Quantitation of Drop-Seq capture efficiency by ERCC spike-ins. Drop-Seq was performed with ERCC control synthetic RNA at an estimated concentration of 100,000 ERCC RNA molecules per droplet. 84 beads were sequenced at a mean depth of 2.4 million reads, aligned to the ERCC reference sequences, and UMIs counted for each ERCC species, after applying a stringent down-correction for potential sequencing errors (Table S1 and Extended Experimental Procedures). For each ERCC RNA species above an average concentration of one molecule per droplet, the predicted number of molecules per droplet was plotted in log space (x-axis), versus the actual number of molecules detected per droplet by Drop-Seq, also in log space (y-axis). The intercept of a regression line, constrained to have a slope of 1 and fitted to the seven highest points, was used to estimate a conversion factor (0.128). A second estimation, using the average number of detected transcripts divided by the number of ERCC molecules used (100,000), yielded a conversion factor of 0.125.
Figure 4
Figure 4. Cell-cycle analysis of HEK and 3T3 cells analyzed by Drop-Seq
(A) Cell-cycle state of 589 HEK cells (left) and 412 3T3 cells (right) measured by Drop-Seq. Cells were assessed for their progression through the cell cycle by comparison of each cell’s global pattern of gene expression with gene sets known to be enriched in one of five phases of the cycle (horizontal rows). A phase-specific score was calculated for each cell across these five phases (Extended Experimental Procedures), and the cells ordered by their phase scores. (B) Discovery of cell cycle regulated genes. Heat map showing the average normalized expression of 544 human and 668 mouse genes found to be regulated by the cell cycle. Maximal and minimal expression was calculated for each gene across a sliding window of the ordered cells, and compared with shuffled cells to obtain a false discovery rate (FDR) (Experimental Procedures). The plotted genes (FDR threshold of 5%) were then clustered by k-means analysis to identify sets of genes with similar expression patterns. Cluster boundaries are represented by dashed gray lines. (C) Representative cell cycle regulated genes discovered by Drop-Seq. Selected genes that were found to be cell cycle regulated in both the HEK and 3T3 cell sets. Left, genes that are well-known to be cell cycle regulated. Right, some genes identified in this analysis that were not previously known to be associated with the cell cycle (Experimental Procedures). A complete list of cell cycle regulated genes can be found in Table S2.
Figure 5
Figure 5. Ab initio reconstruction of retinal cell types from 44,808 single-cell transcription profiles prepared by Drop-Seq
(A) Schematic representation of major cell classes in the retina. Photoreceptors (rods or cones) detect light and pass information to bipolar cells, which in turn contact retinal ganglion cells that extend axons into other CNS tissues. Amacrine and horizontal cells are retinal interneurons; Müller glia act as support cells for surrounding neurons. (B) Clustering of 44,808 Drop-Seq single-cell expression profiles into 39 retinal cell populations. The plot shows a two-dimensional representation (tSNE) of global gene expression relationships among 44,808 cells; clusters are colored by cell class, according to Figure 5A. (C) Differentially expressed genes across 39 retinal cell populations. In this heat map, rows correspond to individual genes found to be selectively upregulated in individual clusters (p < 0.01, Bonferroni corrected); columns are individual cells, ordered by cluster (1–39). Clusters with > 1,000 cells were downsampled to 1,000 cells to prevent them from dominating the plot. (D) Gene expression similarity relationships among 39 inferred cell populations. Average expression across all detected genes was calculated for each of 39 cell clusters, and the relative (Euclidean) distances between gene-expression patterns for the 39 clusters are represented by a dendrogram. The branches of the dendrogram were annotated by examining the differential expression of known markers for retina cell classes and types. Twelve examples are shown at right, using violin plots to represent the distribution of expression within the clusters. Violin plots for additional genes are in Figure S6A. (E) Representation of experimental replicates in each cell population. tSNE plot from Figure 2B, with each cell now colored by experimental replicate (for visual clarity, the central rod cluster was downsampled to 10,000 cells). Each of the 7 replicates contributes to all 39 cell populations. Cluster 36 (arrow), in which these replicates are unevenly represented, expressed markers of fibroblasts, which are not native to the retina and are presumably a dissection artifact (see also Figure S6B). (F) Trajectory of amacrine clustering as a function of number of cells analyzed. Three different downsampled datasets were generated: (1) 500, (2) 2,000, or (3) 9,731 cells (Extended Experimental Procedures). Cells identified as amacrines (clusters 3–23) in the full analysis are here colored by their cluster identities in that analysis. Analyses of smaller numbers of cells incompletely distinguished these subpopulations from one another.
Figure 6
Figure 6. Finer-scale expression distinctions among amacrine cells, cones and retinal ganglion cells
(A) Pan-amacrine markers. The expression levels of the six genes identified (Nrxn2Atp1b1Pax6Slc32a1Slc6a1Elavl3) are represented as dot plots across all 39 clusters; larger dots indicate broader expression within the cluster; deeper red denotes a higher expression level. (B) Identification of known amacrine types among clusters. The twenty-one amacrine clusters consisted of twelve GABAergic, five glycinergic, one glutamatergic and three non-GABAergic non-glycinergic clusters. Starburst amacrines were identified in cluster 3 by their expression of Chat; excitatory amacrines by expression of Slc17a8; A-II amacrines by their expression of Gjd2; and SEG amacrine neurons by their expression of Ebf3. (C) Nomination of novel candidate markers of amacrine subpopulations. Each cluster was screened for genes differentially expressed in that cluster relative to all other amacrine clusters (p<0.01, Bonferroni corrected) (McDavid et al., 2013), and filtered for those with highest relative enrichment. Expression of a single candidate marker for each cluster is shown across all amacrines. (D) Validation of MAF as a marker for a GABAergic amacrine population. Staining of a fixed adult retina from wild-type mice for MAF (panels i, ii, v, and green staining in iv and vii), GAD1 (panels iii and iv, red staining), and SLC6A9 (panels vi and vii, red staining), demonstrating co-localization of MAF with GAD1, but not SLC6A9. (E) Differential expression of cluster 7 (MAF+) with nearest neighboring amacrine cluster (#6). Average gene expression was compared between cells in clusters 6 and 7; sixteen genes (red dots) were identified with >2.8-fold enrichment in cluster 7 (p<10−9). (F) Validation of PPP1R17 as a marker for an amacrine subpopulation. Staining of a fixed adult retina from Mito-P mice, which express CFP in both nGnG amacrines and type 1 bipolars (Kay et al., 2011). Overlapping labeling by PPP1R17 antibody (green) and Mito-P CFP (red) supports Drop-Seq identification of Ppp1r17 expression in the nGnG amacrine neurons. 85% of CFP+ cells were PPP1R17+ and 50% of the PPP1R17+ cells were CFP-, suggesting a second amacrine type expressing this marker. Blue staining is for VSX2, a marker of bipolar neurons. (G) Differential expression of cluster 20 (PPP1R17+) with nearest neighboring amacrine cluster (#21). Average gene expression was compared between cells in clusters 20 and 21; twelve genes (red dots) were identified with >2.8-fold enrichment in cluster 20 (p<10−9). (H) Differential expression of melanopsin-positive and negative RGCs. Average expression was compared between Opn4-positive and –negative RGCs in cluster 2. Seven genes were identified as enriched in Opn4-positive cells (red dots, >2-fold, p<10−9).

Comment in

Similar articles

Cited by

References

    1. Amir el AD, Davis KL, Tadmor MD, Simonds EF, Levine JH, Bendall SC, Shenfeld DK, Krishnaswamy S, Nolan GP, Pe'er D. viSNE enables visualization of high dimensional single-cell data and reveals phenotypic heterogeneity of leukemia. Nature biotechnology. 2013;31:545–552. - PMC - PubMed
    1. Beer NR, Wheeler EK, Lee-Houghton L, Watkins N, Nasarabadi S, Hebert N, Leung P, Arnold DW, Bailey CG, Colston BW. On-chip single-copy real-time reverse-transcription PCR in isolated picoliter droplets. Analytical chemistry. 2008;80:1854–1858. - PubMed
    1. Berman GJ, Choi DM, Bialek W, Shaevitz JW. Mapping the stereotyped behaviour of freely moving fruit flies. Journal of the Royal Society, Interface / the Royal Society. 2014:11. - PMC - PubMed
    1. Brennecke P, Anders S, Kim JK, Kolodziejczyk AA, Zhang X, Proserpio V, Baying B, Benes V, Teichmann SA, Marioni JC, et al. Accounting for technical noise in single-cell RNA-seq experiments. Nature methods. 2013;10:1093–1095. - PubMed
    1. Britten RJ, Kohne DE. Repeated sequences in DNA. Hundreds of thousands of copies of DNA sequences have been incorporated into the genomes of higher organisms. Science. 1968;161:529–540. - PubMed

Publication types

Associated data