. 2015 May 22;10(5):e0127386.
doi: 10.1371/journal.pone.0127386. eCollection 2015.

The Roles of ROS and Caspases in TRAIL-Induced Apoptosis and Necroptosis in Human Pancreatic Cancer Cells

Affiliations

The Roles of ROS and Caspases in TRAIL-Induced Apoptosis and Necroptosis in Human Pancreatic Cancer Cells

Min Zhang et al. PLoS One. .

Abstract

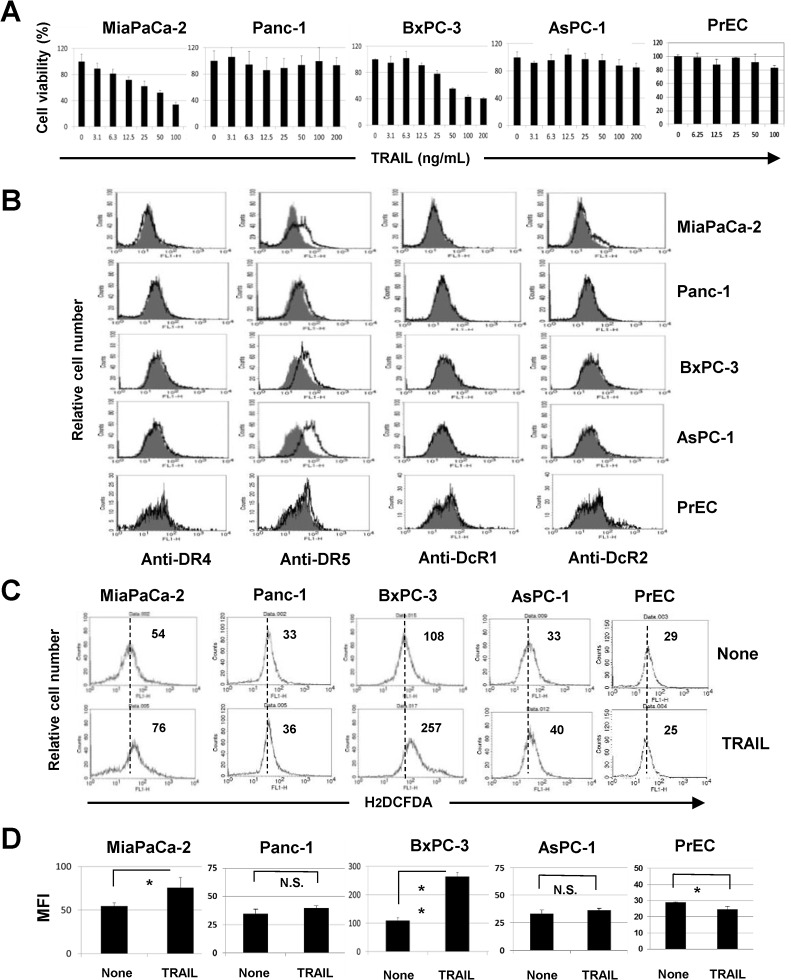
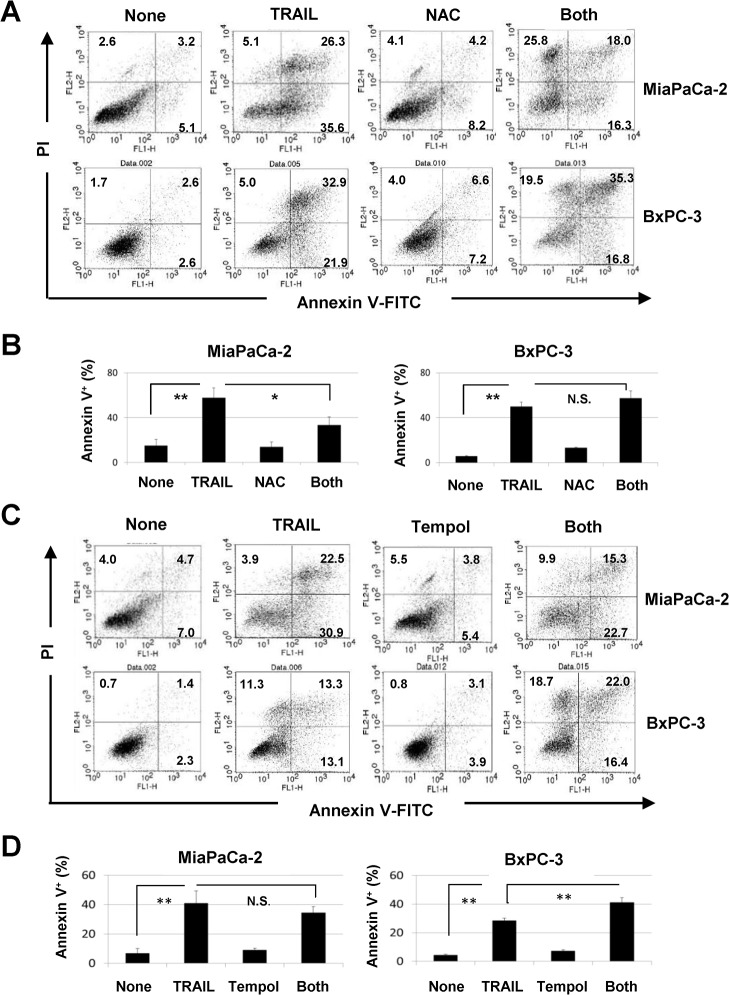
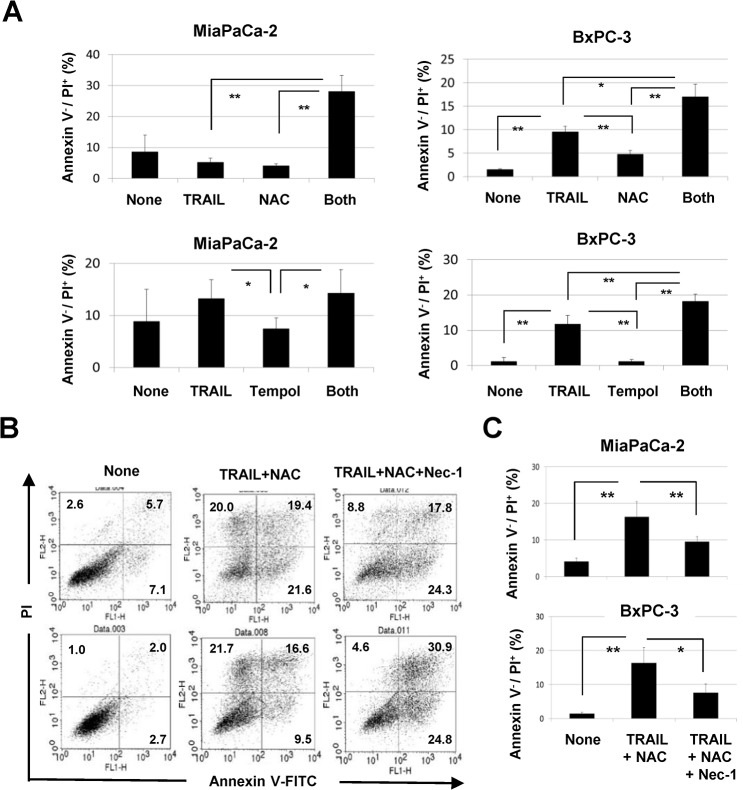
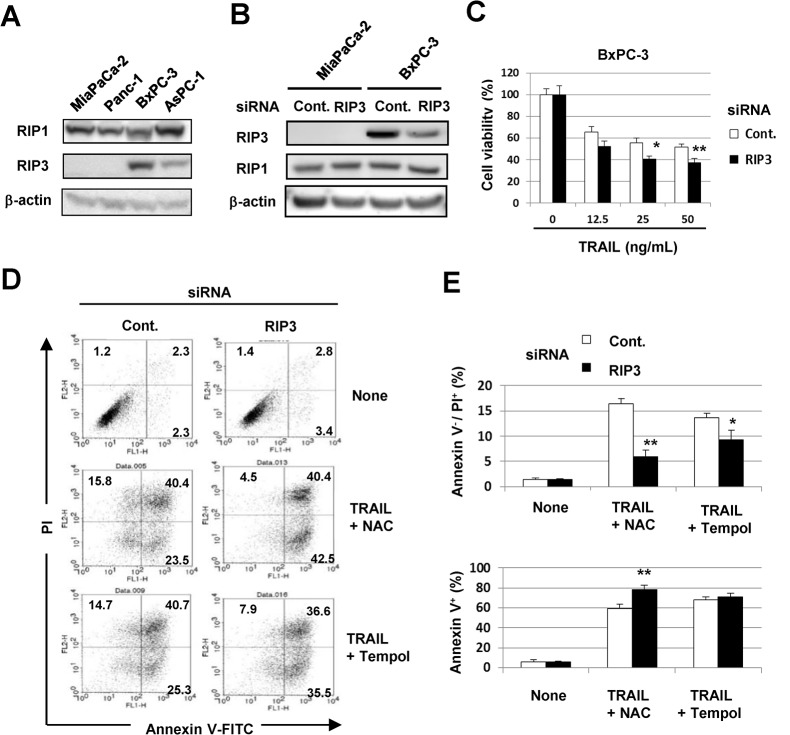
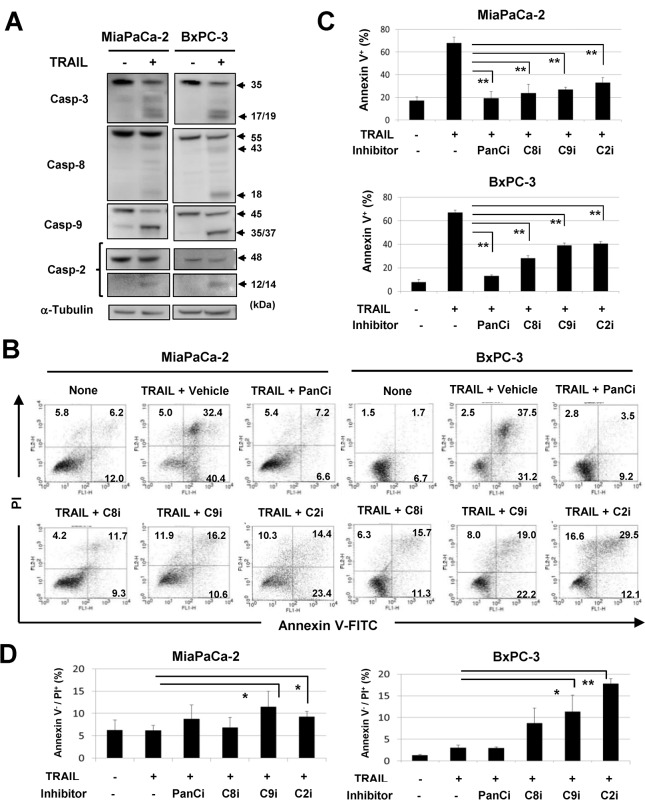
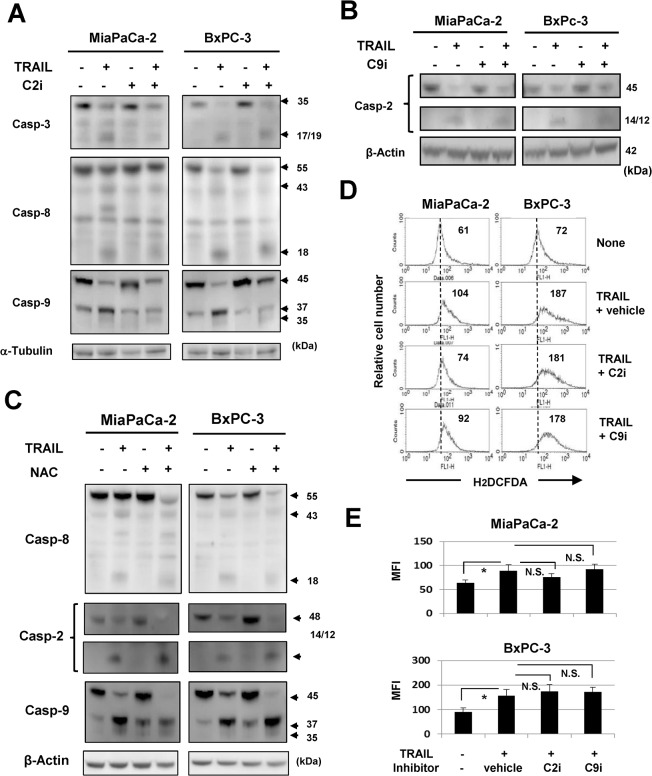
Death signaling provided by tumor necrosis factor (TNF)-related apoptosis-inducing ligand (TRAIL) can induce death in cancer cells with little cytotoxicity to normal cells; this cell death has been thought to involve caspase-dependent apoptosis. Reactive oxygen species (ROS) are also mediators that induce cell death, but their roles in TRAIL-induced apoptosis have not been elucidated fully. In the current study, we investigated ROS and caspases in human pancreatic cancer cells undergoing two different types of TRAIL-induced cell death, apoptosis and necroptosis. TRAIL treatment increased ROS in two TRAIL-sensitive pancreatic cancer cell lines, MiaPaCa-2 and BxPC-3, but ROS were involved in TRAIL-induced apoptosis only in MiaPaCa-2 cells. Unexpectedly, inhibition of ROS by either N-acetyl-L-cysteine (NAC), a peroxide inhibitor, or Tempol, a superoxide inhibitor, increased the annexin V-/propidium iodide (PI)+ early necrotic population in TRAIL-treated cells. Additionally, both necrostatin-1, an inhibitor of receptor-interacting protein kinase 1 (RIP1), and siRNA-mediated knockdown of RIP3 decreased the annexin V-/PI+ early necrotic population after TRAIL treatment. Furthermore, an increase in early apoptosis was induced in TRAIL-treated cancer cells under inhibition of either caspase-2 or -9. Caspase-2 worked upstream of caspase-9, and no crosstalk was observed between ROS and caspase-2/-9 in TRAIL-treated cells. Together, these results indicate that ROS contribute to TRAIL-induced apoptosis in MiaPaCa-2 cells, and that ROS play an inhibitory role in TRAIL-induced necroptosis of MiaPaCa-2 and BxPC-3 cells, with caspase-2 and -9 playing regulatory roles in this process.


Conflict of interest statement

Competing Interests: The authors have declared that no competing interests exist.

Figures

Fig 1
Fig 1. ROS production in TRAIL-sensitive human pancreatic cancer cell lines.
(A) Four human pancreatic cancer lines and PrEC cells were cultured in the presence of TRAIL. After 48 h, cell viability was determined by the WST-8 assay. The data shown represent the mean of three wells. (B) The expression of DR4, DR5, DcR1, and DcR2 in five cell lines was examined by flow cytometry. The line represents staining with mAb specific to either DR4 or DR5, followed by a FITC-conjugated secondary antibody. Solid gray represents staining with FITC-conjugated anti-mouse IgG alone. Regarding the expression of DcR1 and DcR2, the line represents staining with mAb specific to DcR1 and DcR2; solid gray represents staining with isotype-matched FITC-conjugated anti-mouse IgG. (C) Five cell lines were cultured with TRAIL (50 ng/mL). After 6 h for MiaPaCa-2 and 12 h for the other four lines, these cells were cultured with carboxy-H2DCFDA (50 μM) for 30 min and examined for their ROS levels by flow cytometry. The number represents the mean fluorescence intensity. (D) The data shown represent the mean of three wells. MFI: mean fluorescence intensity. *P<0.05, **P<0.01, N.S., not significant.
Fig 2
Fig 2. ROS-dependent apoptosis in TRAIL-treated MiaPaCa-2 cells.
(A) MiaPaCa-2 and BxPC-3 cells were cultured with TRAIL (50 ng/mL) with or without NAC (10 mM) for 24 h. After staining with annexin V-FITC/PI, flow cytometric analysis was performed. The numbers represent the proportions of each subset. (B) The percentages of annexin V+ cells are shown. (C) Both cell lines were cultured with TRAIL (50 ng/mL) with or without Tempol (1 mM) for 24 h and analyzed by flow cytometry. (D) The percentages of annexin V+ cells are shown. All data points shown represent the mean of three culture wells. *P<0.05, **P<0.01, N.S., not significant.
Fig 3
Fig 3. TRAIL-induced necroptosis in human pancreatic cancer cells under ROS inhibition.
(A) The percentages of annexin V-/PI+ cells were calculated based on the results of Fig 2. (B) Both cell lines were cultured with TRAIL (50 ng/mL) and NAC (10 mM), with or without necrostatin-1 (20 μM) for 24 h. After staining with annexin V-FITC/PI, flow cytometric analysis was performed. The numbers represent the proportions of each subset. (C) The percentages of annexin V-/PI+ cells were calculated. All data points shown represent the mean of three culture wells. *P<0.05, **P<0.01.
Fig 4
Fig 4. RIP3-dependent necroptosis in TRAIL-treated BxPC-3 cells under ROS inhibition.
(A) The expression of RIP3 and RIP1 protein was examined in four cancer cell lines. β-Actin was used as a control. (B) MiaPaCa-2 and BxPC-3 cells were transfected with control siRNA or RIP3 siRNA. Three days after transfection, the cells were harvested and examined for RIP3 and RIP1 protein expression. (C) BxPC-3 cells transfected with either control siRNA or RIP3 siRNA 3 days prior were cultured with TRAIL. After 48 h, cell viability was determined by the WST-8 assay. (D) BxPC-3 cells transfected with either control siRNA or RIP3 siRNA 3 days prior were cultured with TRAIL and with either NAC (10 mM) or Tempol (1 mM) for 24 h. After staining with annexin V-FITC/PI, flow cytometric analysis was performed. The numbers represent the proportions of each subset. (E) The percentages of annexin V-/PI+ cells and annexin V+ cells were calculated. All data points shown represent the mean of three culture wells. *P<0.05, **P<0.01.
Fig 5
Fig 5. The roles of caspases in apoptosis and necroptosis of TRAIL-treated cells.
(A) MiaPaCa-2 and BxPC-3 cells were cultured with TRAIL (50 ng/mL) for 12 h, and protein expression levels of caspase-3, caspase-8, caspase-9, and caspase-2 were evaluated by immunoblot. α-Tubulin was used as the control. (B) MiaPaCa-2 and BxPC-3 cells were cultured with TRAIL (50 ng/mL) in the presence of a panel of caspase inhibitors (20 μM) for 24 h. After staining with annexin V-FITC/PI, flow cytometric analysis was performed. The numbers represent the proportions of each subset. The percentages of annexin V+ cells (C) and annexin V-/PI+ cells (D) were determined by flow cytometry. All data points shown represent the mean of three culture wells. *P<0.05, **P<0.01. panCi, pan-caspase inhibitor; C9i, caspase-9 inhibitor; C8i, caspase-8 inhibitor; C2i, caspase-2 inhibitor. Vehicle controls received an equal volume of DMSO.
Fig 6
Fig 6. No crosstalk among caspase-2/-9 and ROS in TRAIL-treated cancer cells.
(A) MiaPaCa-2 and BxPC-3 cells were cultured with TRAIL (50 ng/mL) with or without caspase-2 inhibitor (20 μM) for 12 h, and the protein expression levels of caspase-3, -8, and -9 were evaluated by immunoblot. α-Tubulin was used as the control. (B) MiaPaCa-2 and BxPC-3 cells were cultured with TRAIL (50 ng/mL) with or without caspase-9 inhibitor (20 μM) for 12 h, and the protein expression of caspase-2 was evaluated by immunoblot. β-Actin was used as the control. (C) MiaPaCa-2 and BxPC-3 cells were cultured with TRAIL (50 ng/mL) with or without NAC (10 mM) for 12 h, and the protein expression of caspase-8, -2, and -9 was evaluated by immunoblot. β-Actin was used as the control. (D) MiaPaCa-2 and BxPC-3 cells were cultured with TRAIL (50 ng/mL) with the indicated inhibitors (20 μM). As a vehicle control, an equal volume of DMSO was added. After 6 h for MiaPaCa-2 and 12 h for BxPC-3, these cells were cultured with carboxy-H2DCFDA for 30 min and examined for ROS levels by flow cytometry. The number represents the mean fluorescence intensity. (E) Data represent the mean of three culture wells. MFI: mean fluorescence intensity. *P<0.05, N.S., not significant.

References

    1. Ashkenazi A, Dixit VM (1999) Apoptosis control by death and decoy receptors. Curr Opin Cell Biol 11: 255–60. - PubMed
    1. Almasan A, Ashkenazi A (2003) Cytokine & Growth Factor Reviews 14: 337–48. - PubMed
    1. Almasan A, Ashkenazi A (2003) Apo2L/TRAIL: apoptosis signaling, biology, and potential for cancer therapy. Cytokine Growth Factor Rev 14:337–348. - PubMed
    1. Pan G, Ni J, Wei YF, Yu G, Gentz R, Dixit VM (1997) An antagonist decpy receptor and a death domain-containing receptor for TRAIL. Science 277:815–818. - PubMed
    1. Herbst RS, Eckhardt G, Kurzrock R, Ebbinghaus S, O’Dwyer PJ, Gordon MS (2010) Phase I dose-escalation study of recombinant human Apo2L/TRAIL, a dual proapoptotic receptor agonist, in patients with advanced cancer. J Clin Oncol 28: 2839–2846. 10.1200/JCO.2009.25.1991 - DOI - PubMed

Publication types

MeSH terms