. 2015 May;7(5):294-306.
doi: 10.18632/aging.100742.

The cerebellum ages slowly according to the epigenetic clock

Affiliations

The cerebellum ages slowly according to the epigenetic clock

Steve Horvath et al. Aging (Albany NY). 2015 May.

Abstract

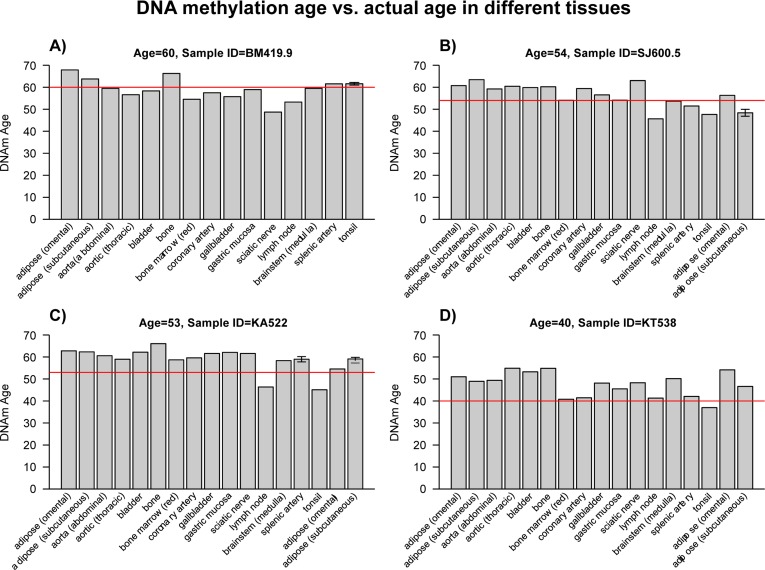
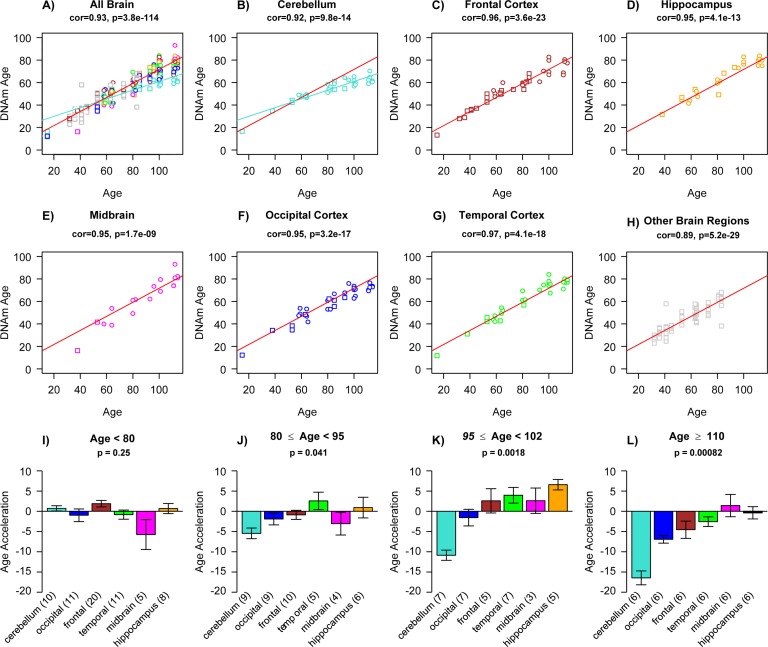
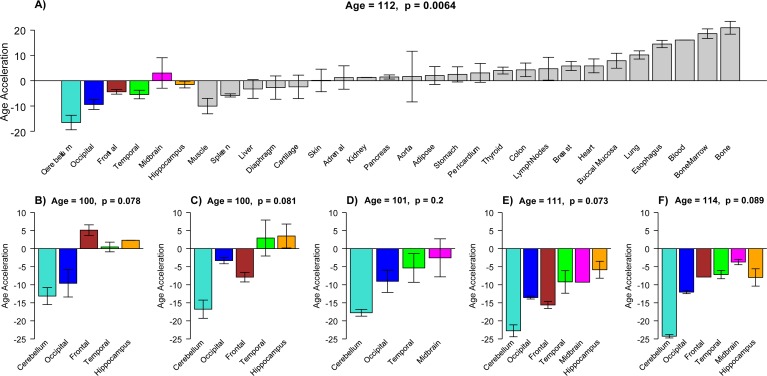
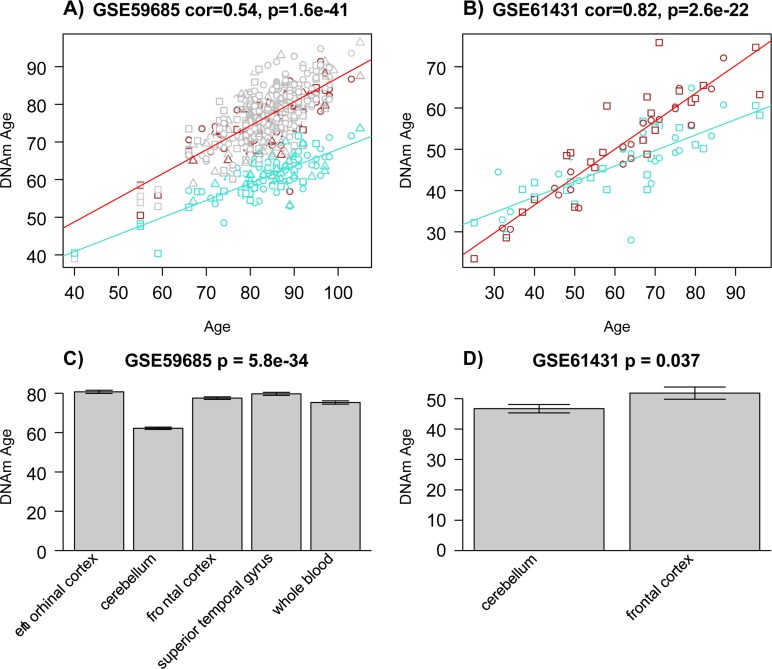
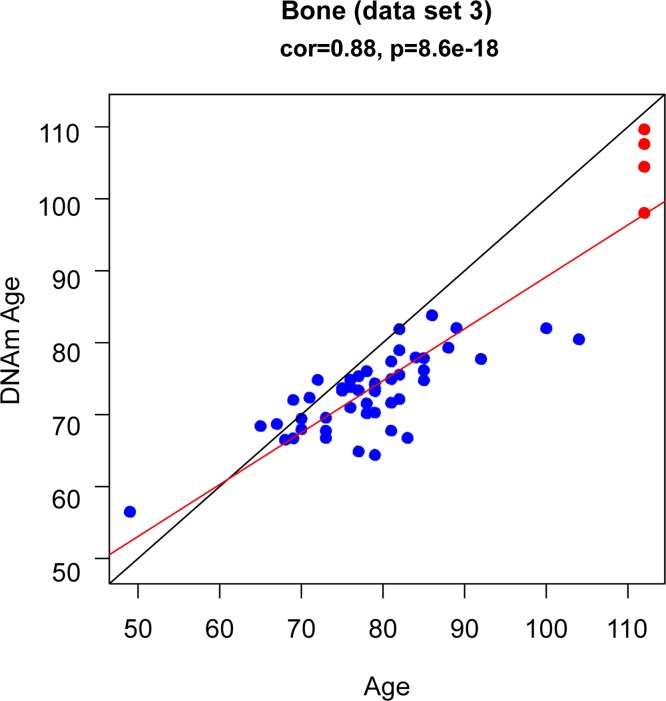
Studies that elucidate why some human tissues age faster than others may shed light on how we age, and ultimately suggest what interventions may be possible. Here we utilize a recent biomarker of aging (referred to as epigenetic clock) to assess the epigenetic ages of up to 30 anatomic sites from supercentenarians (subjects who reached an age of 110 or older) and younger subjects. Using three novel and three published human DNA methylation data sets, we demonstrate that the cerebellum ages more slowly than other parts of the human body. We used both transcriptional data and genetic data to elucidate molecular mechanisms which may explain this finding. The two largest superfamilies of helicases (SF1 and SF2) are significantly over-represented (p=9.2x10⁻⁹) among gene transcripts that are over-expressed in the cerebellum compared to other brain regions from the same subject. Furthermore, SNPs that are associated with epigenetic age acceleration in the cerebellum tend to be located near genes from helicase superfamilies SF1 and SF2 (enrichment p=5.8x10⁻³). Our genetic and transcriptional studies of epigenetic age acceleration support the hypothesis that the slow aging rate of the cerebellum is due to processes that involve RNA helicases.

Keywords: biomarker of aging; brain; centenarian; epigenetics; tissue aging.


Conflict of interest statement

Conflict of interest statement

The authors declare no conflicts of interest.

Figures

Figure 1
Figure 1. DNA methylation ages of various tissues from four middle-aged individuals
Here we use data set 4 (Lokk, et al; 2014) to assess the tissue ages of 4 subjects (each of which corresponds to a different panel and person identifier such as BM419.9). Bars report the DNAm age in the corresponding tissue. The red horizontal line reports the chronological age. These plots confirm that tissues from the same middle aged individuals exhibit similar DNAm ages.
Figure 2
Figure 2. Epigenetic age acceleration in various brain regions
(a) Scatter plot relating the DNAm age of each brain sample (y-axis) versus the corresponding chronological age (x-axis). Points are colored by brain regions (e.g. turquoise for cerebellum) as indicated in (b-h). Linear regression lines through cerebellar samples and non-cerebellar samples are colored in turquoise and red, respectively. Note that cerebellar samples (turquoise points) exhibit a lower rate of change (i.e. slope of the turquoise line) than non-cerebellar samples. In the scatter plots, circles and squares correspond to brain regions from Alzheimer's disease subjects and controls, respectively. Scatter plots show (b) cerebellar samples only, (c) frontal lobe, (d) hippocampus, (e) midbrain, (f) occipital cortex, (g) temporal cortex, and (h) remaining brain regions, which include caudate nucleus, cingulate gyrus, motor cortex, sensory cortex and parietal cortex. The subtitle of each scatter plot reports a Pearson correlation coefficient and corresponding p-value. Epigenetic age acceleration was defined as the vertical distance of each sample from the red regression line in (a). (i-l) Age acceleration versus brain region in different age groups as indicated in the respective titles. Cerebellar samples tend have the lowest (negative) age acceleration (turquoise bars) followed by occipital cortex (blue bars). Each bar plot depicts the mean value and one standard error and reports a non-parametric group comparison test p-value (Kruskal Wallis Test).
Figure 3
Figure 3. Epigenetic age acceleration in tissues from individual centenarians
(a) Mean DNAm age acceleration per tissue (y-axis) for the 30 tissues and organs collected from a 112 year old woman. (b-f) Age acceleration in brain regions of 5 additional centenarians (whose age is in the title). Age acceleration here is defined relative to age of non-cerebellar brain samples as indicated by the red regression line in Figure 2a. Bars corresponding to different brain regions are colored as in Figure 2. For each of the six centenarians, cerebellar samples (turquoise bars) take on the lowest (negative values). Each bar plot reports the mean value and one standard error. Number of replicate measurements for each tissue was two except for bone and bone marrow, which were four.
Figure 4
Figure 4. Reproducibility of DNAm age in the 112 year old supercentenarian
For each of the 30 tissues of the supercente-narian, we assessed at least two replicates (two independent DNA extractions for distant regions of the same tissue).
Figure 5
Figure 5. Epigenetic age acceleration in two multi-tissue data sets
The first column (a, c) report results for samples from data set 5 [42]. The last column (b, d) reports findings for data set 6 [43]. (a-b) Scatter plots relating the DNAm age of each sample (y-axis) versus the corresponding chronological age (x-axis). Linear regression lines through cerebellar samples and non-cerebellar samples are colored in turquoise and red, respectively. Note that cerebellar samples (turquoise points) tend to lie below non-cerebellar samples. (a) Squares, circles, and triangles correspond to samples from controls, AD, and mixed dementia subjects, respectively. (b) Squares and circles corresponds to controls and schizophrenia subjects, respectively. (c) The barplots depict the mean DNAmAge (y-axis) versus tissue type for all subjects from panel A for whom all 5 tissue types (including whole blood) were available. (d) Analogous plot for all subjects from data set 6 for whom both brain regions were available.
Figure 6
Figure 6. DNAm age (y-axis) versus age (x-axis) in bone (osteocytes/osteoblasts)
The blue dots corresponds to the samples in data set 3 (bone). The red dots corresponds to the replicate bone samples from the 112 year old super centenarian.

References

    1. Baker G, Sprott R. Biomarkers of aging. Exp Gerontol. 1988;23:223–239. - PubMed
    1. Sanders J, Boudreau R. Dordrecht Heidelberg. New York: Springer; 2012. Understanding the Aging Process Using Epidemiologic Approaches.
    1. Blackburn EH, Gall JG. A tandemly repeated sequence at the termini of the extrachromosomal ribosomal RNA genes in Tetrahymena. J Mol Biol. 1978;120:33–53. - PubMed
    1. Lin J, Epel E, Cheon J, Kroenke C, Sinclair E, Bigos M, Wolkowitz O, Mellon S, Blackburn E. Analyses and comparisons of telomerase activity and telomere length in human T and B cells: insights for epidemiology of telomere maintenance. J Immunol Methods. 2010;352:71–80. - PMC - PubMed
    1. Christensen B, Houseman E, Marsit C, Zheng S, Wrensch M, Wiemels J, Nelson H, Karagas M, Padbury J, Bueno R, Sugarbaker D, Yeh R, Wiencke J, et al. Aging and Environmental Exposures Alter Tissue-Specific DNA Methylation Dependent upon CpG Island Context. PLoS Genet. 2009;5:e1000602. - PMC - PubMed

Publication types