. 2015 May;20(5):56009.
doi: 10.1117/1.JBO.20.5.056009.

Optimization of image reconstruction for magnetic resonance imaging-guided near-infrared diffuse optical spectroscopy in breast

Affiliations

Optimization of image reconstruction for magnetic resonance imaging-guided near-infrared diffuse optical spectroscopy in breast

Yan Zhao et al. J Biomed Opt. 2015 May.

Abstract

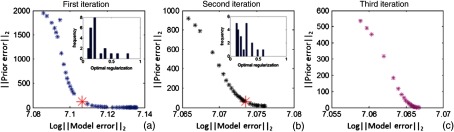
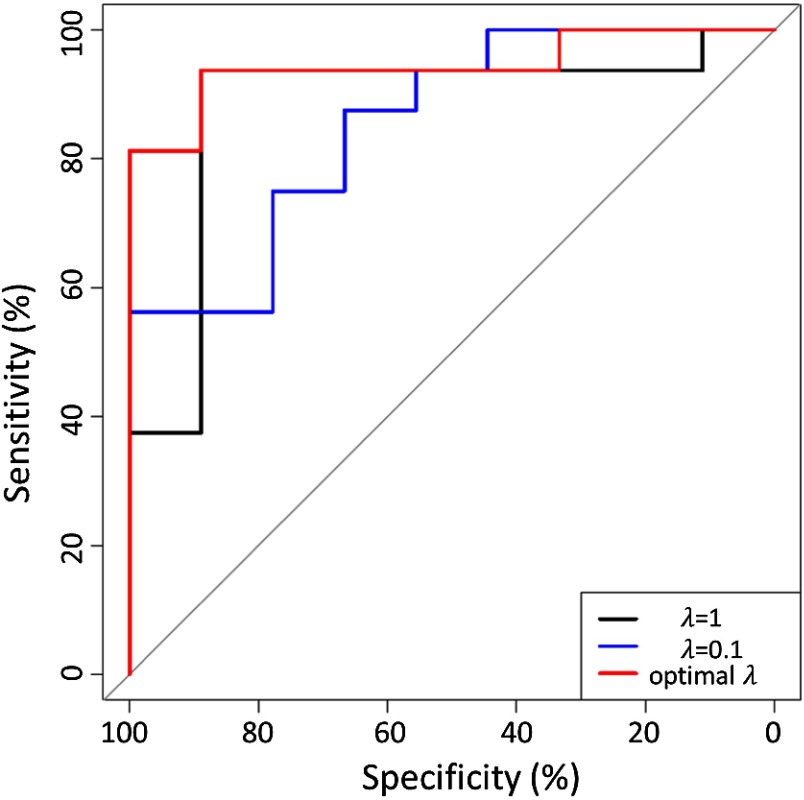
An optimized approach to nonlinear iterative reconstruction of magnetic resonance imaging (MRI)-guided near-infrared spectral tomography (NIRST) images was developed using an L-curve-based algorithm for the choice of regularization parameter. This approach was applied to clinical exam data to maximize the reconstructed values differentiating malignant and benign lesions. MRI/NIRST data from 25 patients with abnormal breast readings (BI-RADS category 4-5) were analyzed using this optimal regularization methodology, and the results showed enhanced p values and area under the curve (AUC) for the task of differentiating malignant from benign lesions. Of the four absorption parameters and two scatter parameters, the most significant differences for benign versus malignant were total hemoglobin (HbT) and tissue optical index (TOI) with p values = 0.01 and 0.001, and AUC values = 0.79 and 0.94, respectively, in terms of HbT and TOI. This dramatically improved the values relative to fixed regularization (p value = 0.02 and 0.003; AUC = 0.75 and 0.83) showing that more differentiation was possible with the optimal method. Through a combination of both biomarkers, HbT and TOI, the AUC increased from 82.9% (fixed regulation = 0.1) to 94.3% (optimal method).


Figures

Fig. 1
Fig. 1
(a) Flowchart outlining the sequence for the optimization algorithm. (b) The L2 norm of the prior property error versus L2 norm of the model error creates the L-curve of values for each regularization parameter values from 0.001 to 100. The optimization algorithm is implemented at each iteration, and optimal regularization parameter from previous iteration is used once the L metric falls behind the threshold.
Fig. 2
Fig. 2
Images from a 33-year-old patient with a 11×21×14-mm3 biopsy-confirmed invasive ductal carcinoma (IDC) in her right breast. (a) Noncontrast T1 MRI with tumor location indicated (arrow); (b) Reconstructed images for total hemoglobin (HbT), (c) oxygen saturation (StO2), (d) water, (e) lipid, (f) scattering amplitude (SA), and (g) scattering power (SP) is overlaid on the MR scan. The value of each parameter in the adipose region is suppressed for clarity of visualization.
Fig. 3
Fig. 3
Tumor-to-adipose contrast in HbT versus regularization for (a) benign, and (b) malignant cases. Circles have a regularization of 0.1, and asterisks have a regularization of 1. Box plots of contrast for the two pathologies are shown with fixed regularizations of (c) 0.1 and (d) 1 for all patients.
Fig. 4
Fig. 4
L-curves are shown for the first three iterations of a single case with a malignant tumor. The regularization was varied from 0.001 to 100 at each iteration, and the optimal regularization was (a) 0.18, (b) 0.22, and (c) undefined for the three iterations, respectively.
Fig. 5
Fig. 5
(a) Log scale of projection error versus number of iterations. (b) Tumor-to-adipose contrast in HbT versus number of iterations.
Fig. 6
Fig. 6
Tumor-to-adipose contrast of HbT versus regularization for (a) benign conditions and (b) malignant tumors. Circles have a regularization of 0.1, and asterisks have a regularization of 1. Box plots of contrast are shown for regularizations of (c) 0.1, and (d) 1 for all patients. Both amplitude and phase data were used in the image reconstructions.
Fig. 7
Fig. 7
Receiver-operating characteristic (ROC) curve for fixed regularization of 1 (black) and 0.1 (blue), and optimal regularization (red), when HbT and TOI are combined. Both amplitude and phase data were used for image reconstruction.
Fig. 8
Fig. 8
Box plots of the contrast for: (a) HbT, (b) StO2, (c) tissue optical index (TOI), (d) scattering power (SA), and (e) scattering power (SP), as recovered using the optimal regularization and amplitude and phase data. aSignificant difference.

References

    1. Ntziachristos V., et al. , “MRI-guided diffuse optical spectroscopy of malignant and benign breast lesions,” Neoplasia 4, 347–354 (2002).10.1038/sj.neo.7900244 - DOI - PMC - PubMed
    1. Tromberg B. J., et al. , “Assessing the future of diffuse optical imaging technologies for breast cancer management,” Med. Phys. 35, 2443–2451 (2008).MPHYA610.1118/1.2919078 - DOI - PMC - PubMed
    1. Hsiang D., et al. , “In vivo absorption, scattering, and physiologic properties of 58 malignant breast tumors determined by broadband diffuse optical spectroscopy,” J. Biomed. Opt. 11, 044005 (2006).JBOPFO10.1117/1.2337546 - DOI - PubMed
    1. Corlu A., et al. , “Three-dimensional in vivo fluorescence diffuse optical tomography of breast cancer in humans,” Opt. Express 15, 6696–6716 (2007).OPEXFF10.1364/OE.15.006696 - DOI - PubMed
    1. Pogue B. W., et al. , “Characterization of hemoglobin, water, and NIR scattering in breast tissue: analysis of intersubject variability and menstrual cycle changes,” J. Biomed. Opt. 9, 541–552 (2004).JBOPFO10.1117/1.1691028 - DOI - PubMed

Publication types

Substances