. 2015 May 22;11(5):e1005243.
doi: 10.1371/journal.pgen.1005243. eCollection 2015 May.

The centrosomal linker and microtubules provide dual levels of spatial coordination of centrosomes

Affiliations

The centrosomal linker and microtubules provide dual levels of spatial coordination of centrosomes

Marko Panic et al. PLoS Genet. .

Abstract

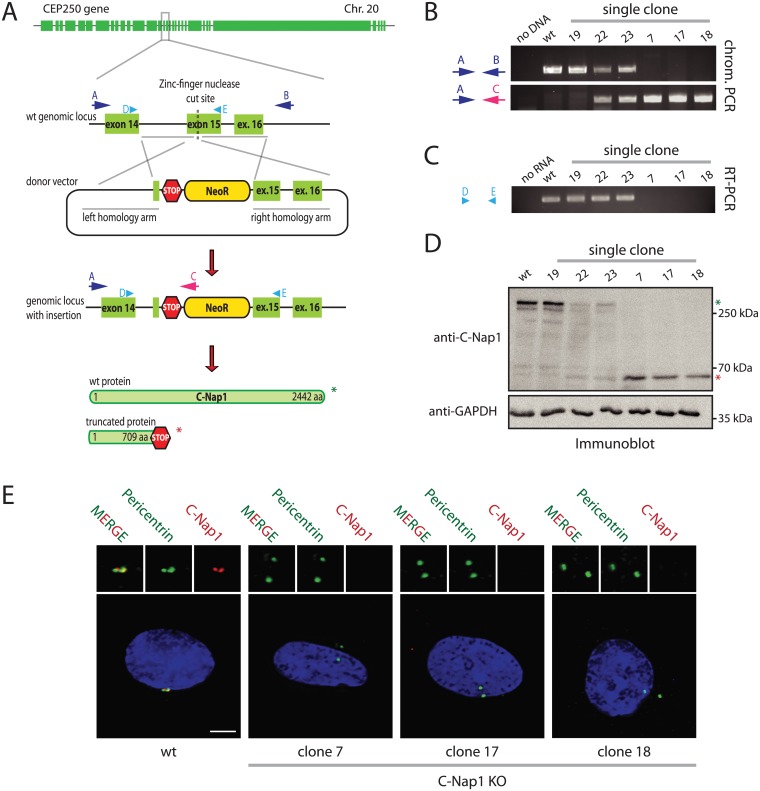
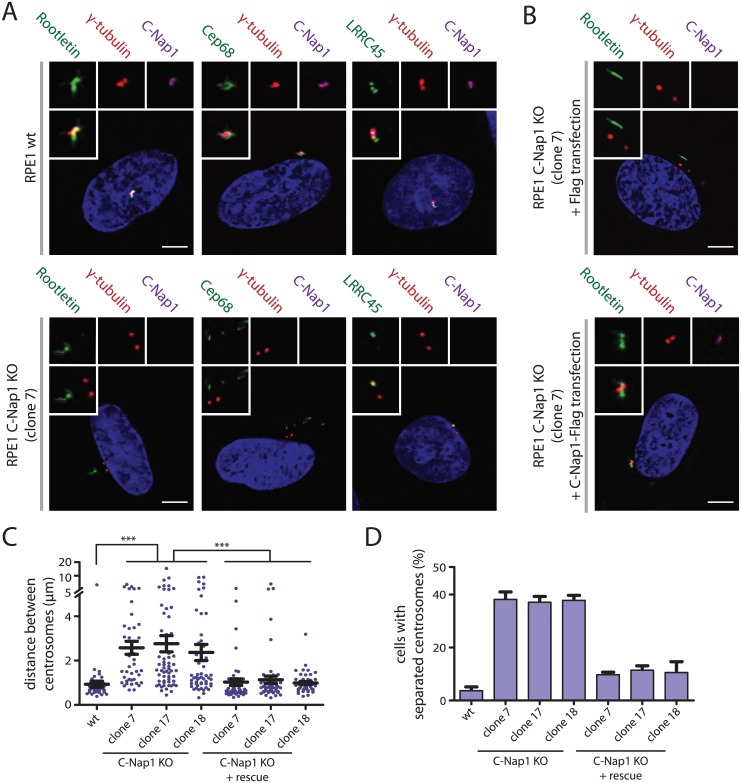
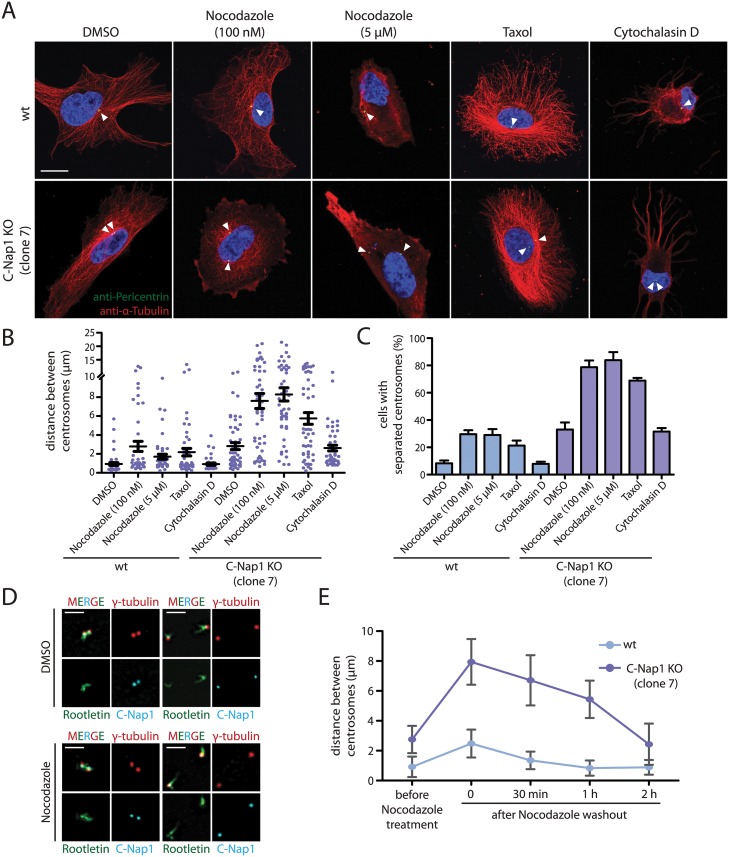
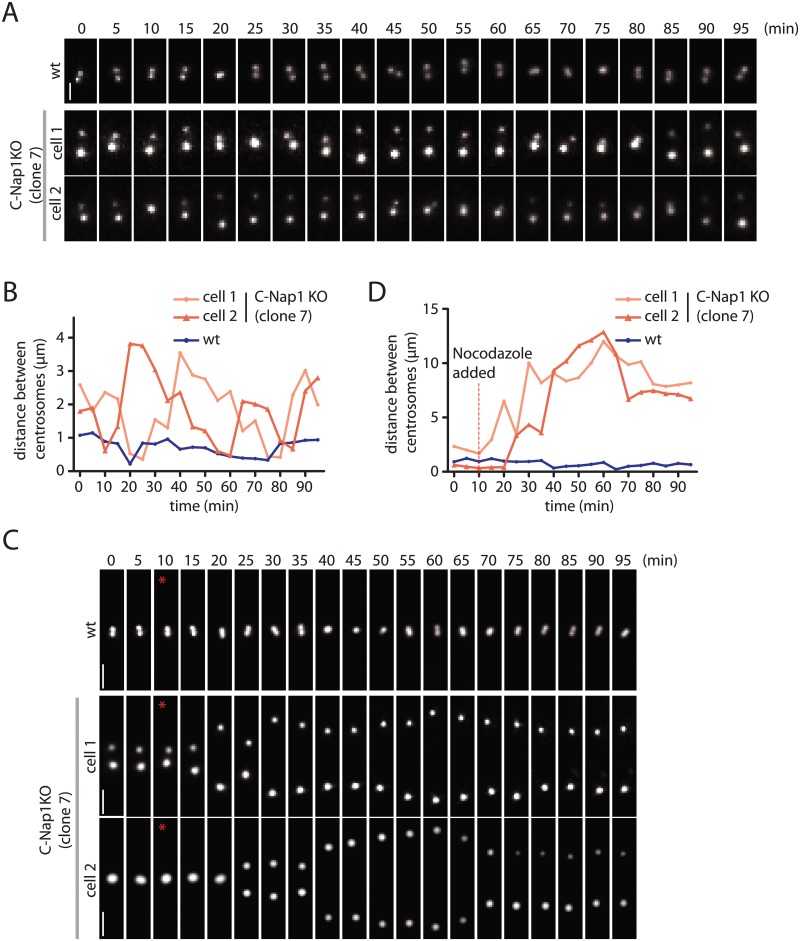
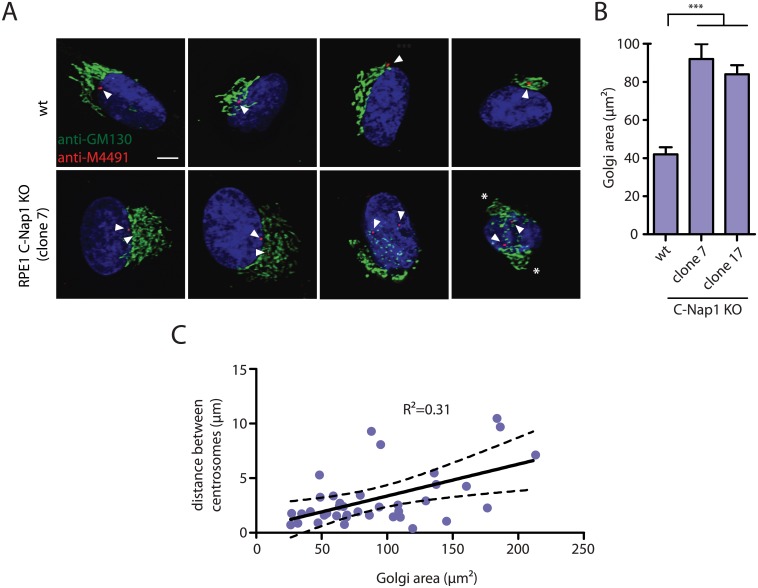
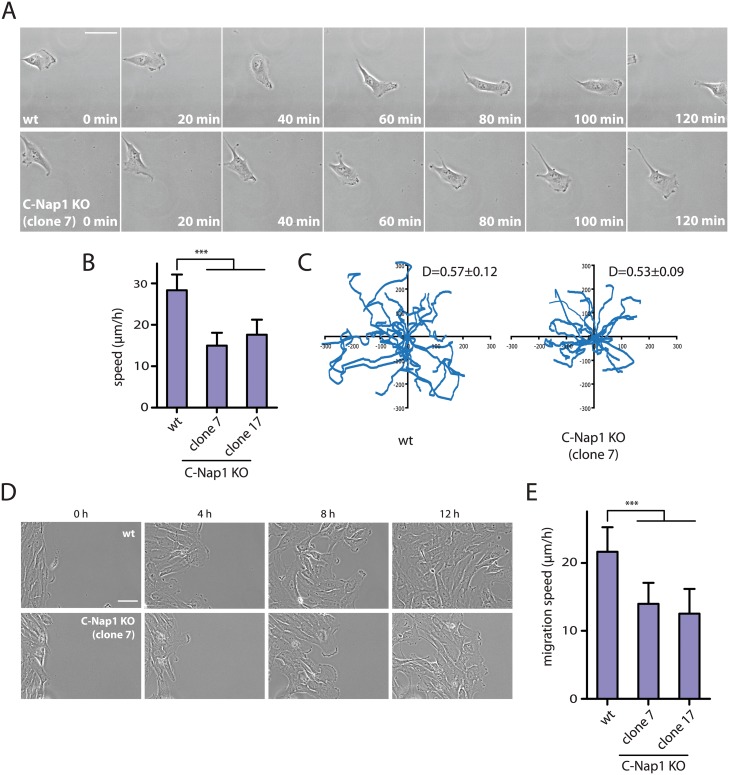
The centrosome is the principal microtubule organizing center in most animal cells. It consists of a pair of centrioles surrounded by pericentriolar material. The centrosome, like DNA, duplicates exactly once per cell cycle. During interphase duplicated centrosomes remain closely linked by a proteinaceous linker. This centrosomal linker is composed of rootletin filaments that are anchored to the centrioles via the protein C-Nap1. At the onset of mitosis the linker is dissolved by Nek2A kinase to support the formation of the bipolar mitotic spindle. The importance of the centrosomal linker for cell function during interphase awaits characterization. Here we assessed the phenotype of human RPE1 C-Nap1 knockout (KO) cells. The absence of the linker led to a modest increase in the average centrosome separation from 1 to 2.5 μm. This small impact on the degree of separation is indicative of a second level of spatial organization of centrosomes. Microtubule depolymerisation or stabilization in C-Nap1 KO cells dramatically increased the inter-centrosomal separation (> 8 μm). Thus, microtubules position centrosomes relatively close to one another in the absence of linker function. C-Nap1 KO cells had a Golgi organization defect with a two-fold expansion of the area occupied by the Golgi. When the centrosomes of C-Nap1 KO cells showed considerable separation, two spatially distinct Golgi stacks could be observed. Furthermore, migration of C-Nap1 KO cells was slower than their wild type RPE1 counterparts. These data show that the spatial organization of centrosomes is modulated by a combination of centrosomal cohesion and microtubule forces. Furthermore a modest increase in centrosome separation has major impact on Golgi organization and cell migration.


Conflict of interest statement

The authors have declared that no competing interests exist.

Figures

Fig 1
Fig 1. Construction of RPE1 C-Nap1 KO cells.
(A) Schematic representation of the CEP250 knockout strategy using a ZFN targeting exon 15 and a neomycin resistance (NeoR) donor construct. Emphasis was put on the exons of the gene. (B) Analysis of clonal RPE1 KO cells by PCR using the primers indicated in (A). The A-C primer pair only yielded a PCR product when NeoR is correctly inserted into CEP250. Primers A and B targeted the whole genomic locus outside of the homology arms. Clones with insertion of NeoR into both CEP250 alleles did not give a PCR product because of the increased length due to the insertion. The ZFN strategy produced rare random integrants (clone 19), but mostly single (clone 22 and 23) and double CEP250 neomycin integrants that targeted both copies of exon 15 (named C-Nap1 KO cells) (clones 7, 17 and 18). (C) RT-PCR of single clones indicating the presence of wt CEP250 mRNA. Primer pair D and E was designed to amplify from exon 14 to the end of exon 15. In case of NeoR integration into exon 15 of CEP250, we did not obtain a PCR product because of the large size. (D) Immunoblots of cell extracts of the indicated clonal cell lines with anti-C-Nap1 antibodies directed against the N-terminus C-Nap1 and anti-GAPDH antibodies. The latter was used as loading control. Single allele knockout clones 22 and 23 have reduced levels of full-length C-Nap1 (green asterisk). We did not detect full-length C-Nap1 in double allele knockout clones 7, 17, and 18. In these clones we observed a truncated version of C-Nap1 (red asterisk) as predicted by the knockout strategy. (E) Immunofluorescence analysis using antibodies directed against the N-terminus of C-Nap1 showed that the truncated C-Nap1 protein does not localize to the centrosome in contrast to the full-length C-Nap1 in wt cells. Bars: 5 μm.
Fig 2
Fig 2. Centrosomes of RPE1 C-Nap1 KO cells lack a centrosomal linker, yet they are kept relatively close together.
(A) RPE1 wt and RPE1 C-Nap1 KO cells were fixed and stained with the indicated linker specific antibodies. DNA was stained with DAPI. Three-fold magnifications of centrosomes are shown above. Note, linker proteins were no longer associated with centrosomes of C-Nap1 KO cells. Bars: 5 μm. (B) Complementation of the linker defect in RPE1 C-Nap1-KO cell lines by transient C-Nap1 expression. Cells were fixed and analyzed with the indicated antibodies. Note, strong C-Nap1 overexpression resulted in C-Nap1 aggregates in the cytoplasm. We picked cells with close to physiological C-Nap1 expression levels. Bars: 5 μm. (C) Average distance of centrosomes in fixed RPE1 wt and several independent clonal RPE1 C-Nap1 KO cell lines. C-Nap1 KO cells show an increase of average centrosome distance from 1 to 2.5 μm. N = 40–60 cells were analyzed per cell line. *** p<0.001. Error bars are SEM around the mean value. (D) Cells of (C) were categorized according to centrosome distance. Centrosome distance of >2 μm was taken as “separated centrosomes”. N = 50 cells were analyzed per cell line. Error bars represent SEM of 3 independent experiments.
Fig 3
Fig 3. In the absence of a centrosomal linker, microtubules position the two centrosomes of a cell relatively close together.
(A) RPE1 wt and RPE1 C-Nap1 KO cells were treated with the indicated reagents for 1 h at 37°C. Fixed cells were analyzed by indirect immunofluorescence with the indicated antibodies. Size bar: 10 μm. (B) Distance between centrosomes of RPE1 C-Nap1 KO cells increases upon treatment of cells with the microtubule drugs nocodazole and taxol. Cells were incubated with the indicated drugs for 1 h at 37°C and subsequently fixed and stained with γ-tubulin antibodies. The distance between centrosomes was determined as described in Materials and Methods. N = 40–60 per condition. Error bars are SEM around the mean value. (C) Cells from (B) were grouped into “cells with separated centrosomes” when the centrosomal distance was >2 μm. Error bars are SEM between 3 independent experiments. (D) Linker morphology in RPE1 cells. RPE1 wt cells were incubated for 1 h with 5 μM nocodazole or the solvent control DMSO. Cells were fixed and stained with the indicated linker antibodies and the centrosome marker γ-tubulin. RPE1 wt cells with a centrosome distance <2 μm have a functional centrosomal linker. Centrosomes of cells with a distance >2 μm are associated with linker proteins but the connection is not established. Nocodazole treatment does not cause displacement of C-Nap1 and rootletin from centrosomes. Bar: 2 μm. (E) The effect of nocodazole on the centrosome distance of RPE1 C-Nap1 KO cells is reversible. Cells were treated for 1 h with 100 nM nocodazole. Nocodazole was washed out (t = 0) the centrosome distance in fixed cells was determined 30, 60 and 120 min after wash out. N = 50 cells per time point and cell line. Error bars are SEM.
Fig 4
Fig 4. Live cell imaging of centrosome behaviour in RPE1 wt and RPE1 C-Nap1 KO cells.
(A) RPE1 wt and RPE1 C-Nap1 KO cells were transfected with NeonGreen-PACT DNA. Centrosome distance was analyzed over time. Size bar: 2 μm. Representative images from 20 analyzed cells are shown. (B) Quantification of (A). Centrosome distance over time. The fluctuation of centrosome distance in the RPE1 C-Nap1 KO cells is clearly greater than in RPE1 wt cells. (C) As in (A), however, 100 nM nocodazole was added 10 min after start of the imaging (red star). Size bar: 3 μm. Representative images from 20 analyzed cells are shown. (D) Quantification of (C). Centrosome distance over time. The red line indicates addition of 100 nM nocodazole. 10–15 min after addition of nocodazole, centrosomes separated in RPE1 C-Nap1 KO cells while they were kept close together by the linker in the majority of RPE1 wt cells.
Fig 5
Fig 5. RPE1 C-Nap1 KO cells have Golgi organization defects.
(A) Interphase RPE1 wt and RPE1 C-Nap1 KO cells were fixed and stained with the indicated antibodies. DNA was stained with DAPI. Arrowheads mark the position of the two centrosomes of an interphase cell. The white asterisks in the right picture highlight two well separated Golgi stacks. Size bar: 5 μm. (B) The Golgi area that is occupied by cells in (A) was quantified. The Golgi of RPE1 C-Nap1 KO cells occupies a two-fold larger area then the Golgi of RPE1 wt cells. N = 30. Bars are SEM. *** p<0.001. (C) Correlation analysis between Golgi area and centrosome distance. Data from (A) were analyzed as described in Materials and Methods. The dashed lines indicate 95% confidence interval. N = 30.
Fig 6
Fig 6. RPE1 C-Nap1 KO cells have reduced migration speed.
(A) Analysis of migration speed of RPE1 wt and RPE1 C-Nap1-KO cells. Phase contrast images of migrating cells over time. Bar: 30 μm. (B) Quantification of migration speed of cells from (A). Two independent C-Nap1 KO cell lines were analyzed. RPE1 C-Nap1 KO cells have reduced migration speed compared to RPE1 wt cells. N = 20–30. Bars are SEM. *** p<0.001 (C) Tracking of RPE1 wt and RPE1 C-Nap1 KO cells. The results of the manual cell tracking over a period of 10 h are shown (interval time—15 min). RPE1 wt and RPE1 C-Nap1 KO cells did not show a difference in migration directionality. Values of the directionality index (D±SEM) are shown at the upper right corner of the graph. (D) The wound healing assay showed that C-Nap1 KO clones have a reduced migration speed. Bar 50 μm. (E) Quantification of (D) shows that C-Nap1 KO clones 7 and 17 have reduced migration speed compared to the RPE1 wt control, but to a slightly lesser extent in comparison to the random migration results from (A). Bars are SEM. N = 25–30, *** p<0.001.

Similar articles

Cited by

References

    1. Bornens M (2012) The centrosome in cells and organisms. Science 335: 422–426. 10.1126/science.1209037 - DOI - PubMed
    1. Bornens M (2002) Centrosome composition and microtubule anchoring mechanisms. Current Opinion in Cell Biology 14: 25–34. - PubMed
    1. Tsou MF, Stearns T (2006) Mechanism limiting centrosome duplication to once per cell cycle. Nature 442: 947–951. - PubMed
    1. Tsou MF, Wang WJ, George KA, Uryu K, Stearns T, et al. (2009) Polo kinase and separase regulate the mitotic licensing of centriole duplication in human cells. Dev Cell 17: 344–354. 10.1016/j.devcel.2009.07.015 - DOI - PMC - PubMed
    1. Agircan FG, Schiebel E, Mardin BR (2014) Separate to operate: control of centrosome positioning and separation. Philos Trans R Soc Lond B Biol Sci 369. - PMC - PubMed

Publication types