

High resolution structural characterization of Aβ42 amyloid fibrils by magic angle spinning NMR
- PMID: 26001057
- PMCID: PMC4623963
- DOI: 10.1021/jacs.5b03997
High resolution structural characterization of Aβ42 amyloid fibrils by magic angle spinning NMR
Abstract
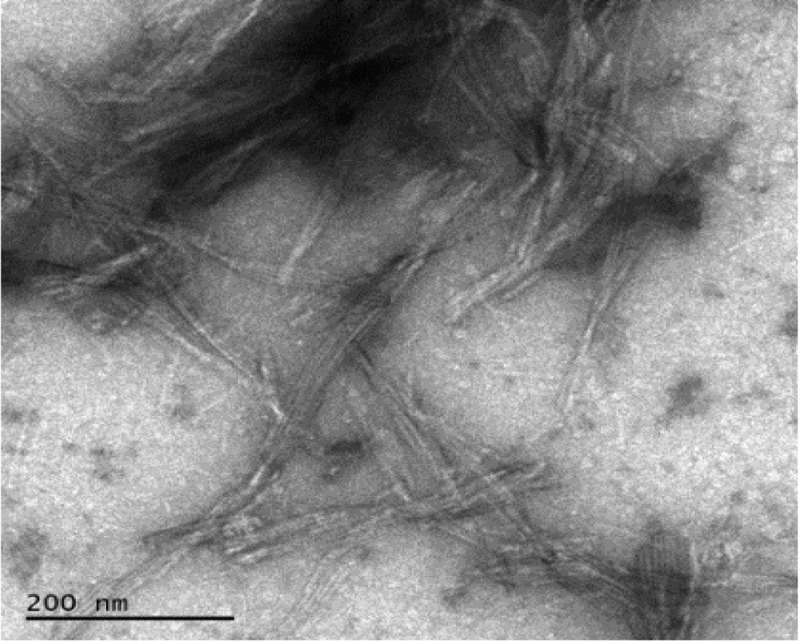
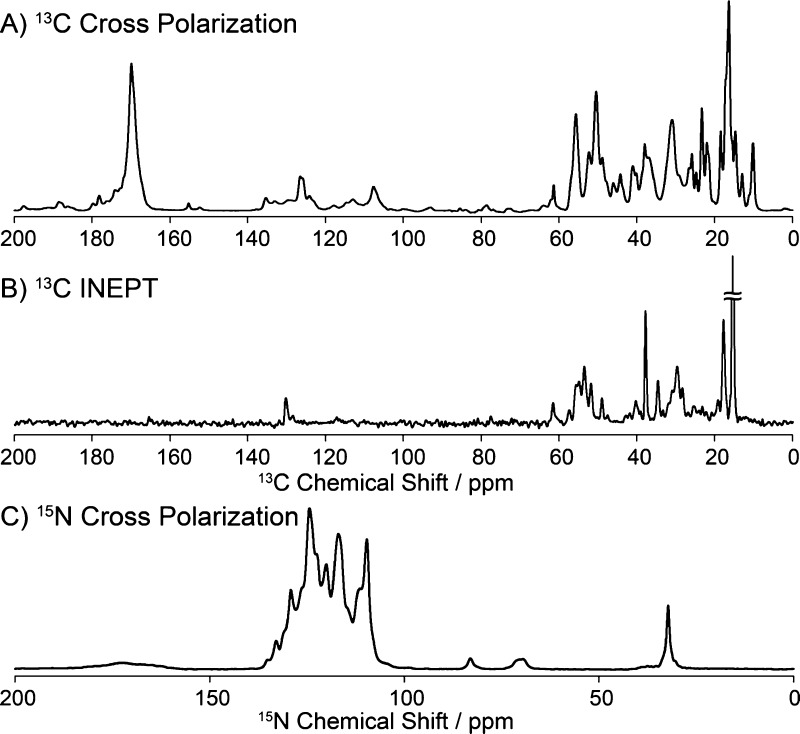
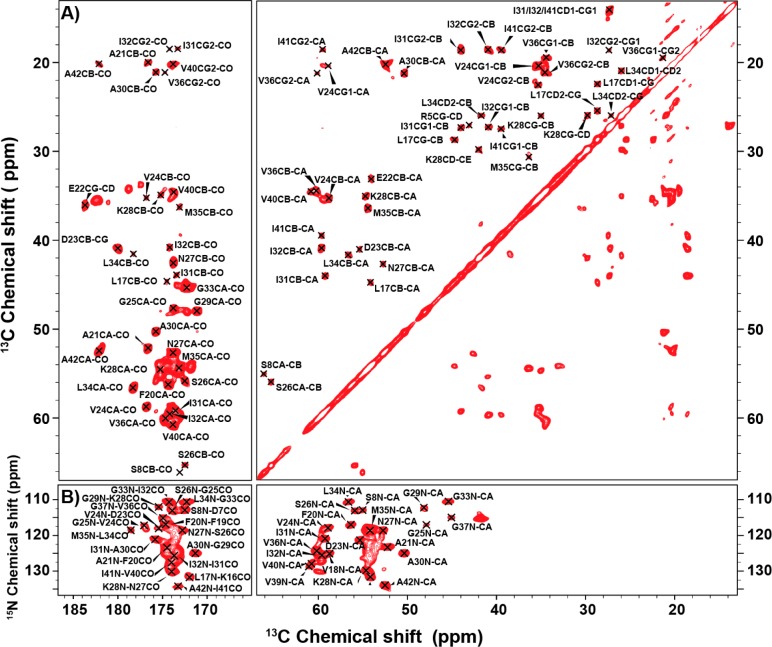
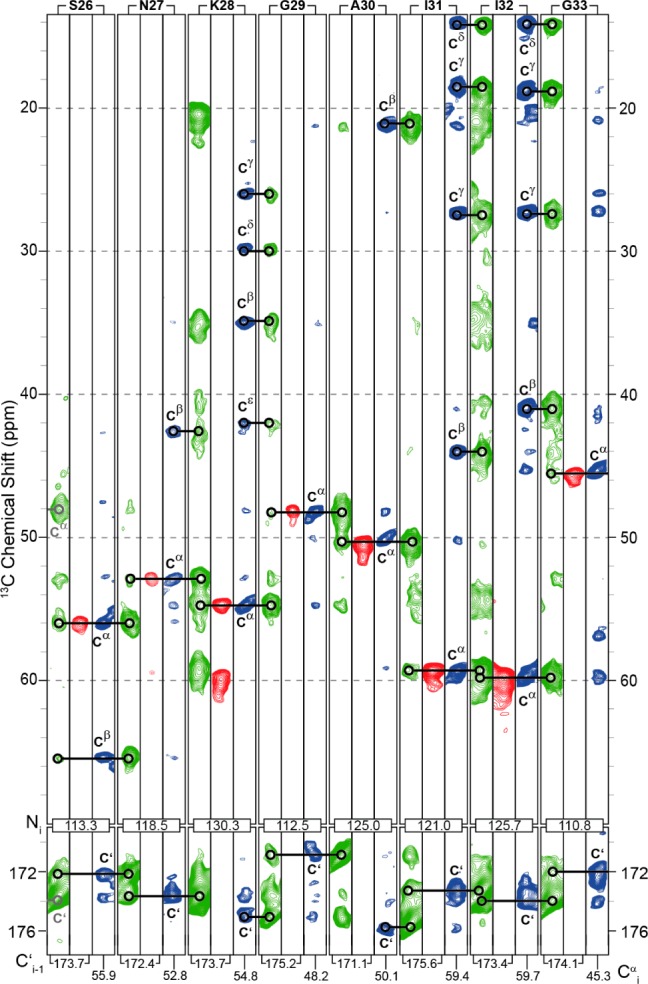
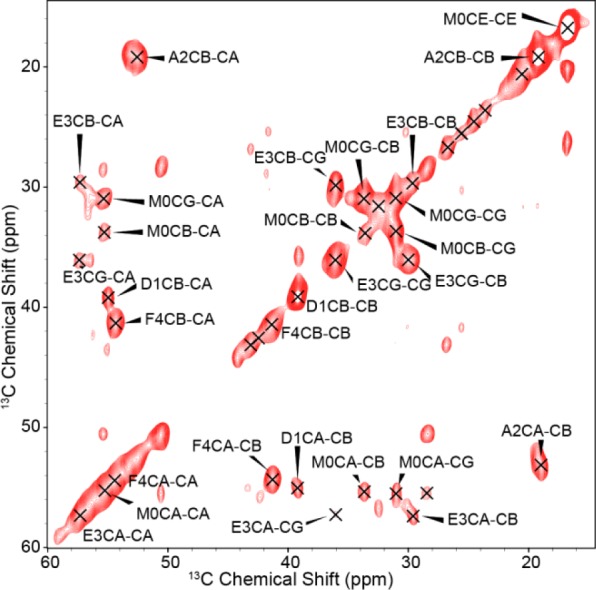
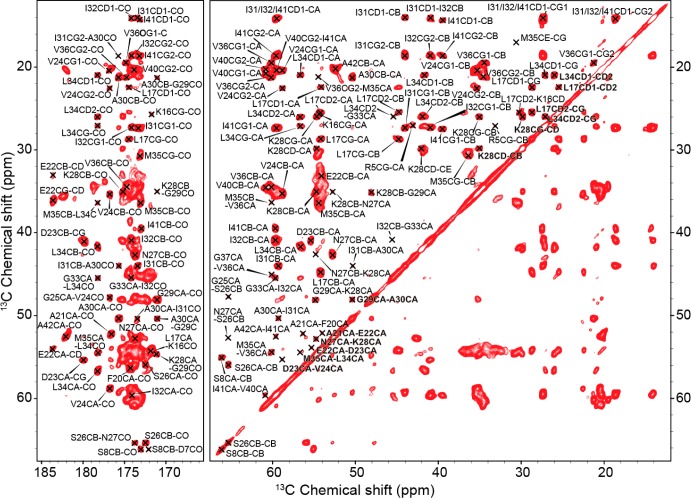
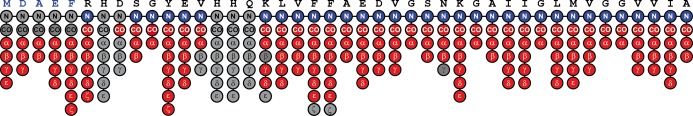
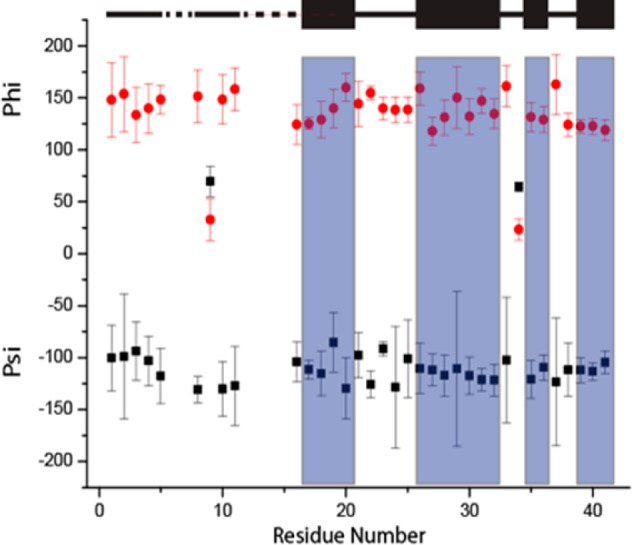
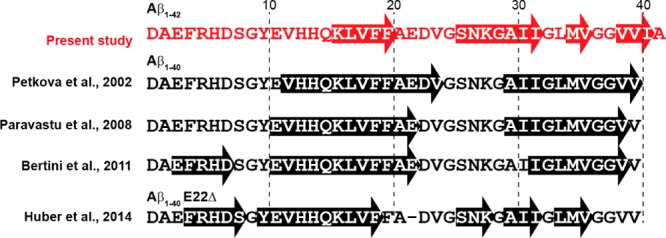
The presence of amyloid plaques composed of amyloid beta (Aβ) fibrils is a hallmark of Alzheimer's disease (AD). The Aβ peptide is present as several length variants with two common alloforms consisting of 40 and 42 amino acids, denoted Aβ1-40 and Aβ1-42, respectively. While there have been numerous reports that structurally characterize fibrils of Aβ1-40, very little is known about the structure of amyloid fibrils of Aβ1-42, which are considered the more toxic alloform involved in AD. We have prepared isotopically (13)C/(15)N labeled AβM01-42 fibrils in vitro from recombinant protein and examined their (13)C-(13)C and (13)C-(15)N magic angle spinning (MAS) NMR spectra. In contrast to several other studies of Aβ fibrils, we observe spectra with excellent resolution and a single set of chemical shifts, suggesting the presence of a single fibril morphology. We report the initial structural characterization of AβM01-42 fibrils utilizing (13)C and (15)N shift assignments of 38 of the 43 residues, including the backbone and side chains, obtained through a series of cross-polarization based 2D and 3D (13)C-(13)C, (13)C-(15)N MAS NMR experiments for rigid residues along with J-based 2D TOBSY experiments for dynamic residues. We find that the first ∼5 residues are dynamic and most efficiently detected in a J-based TOBSY spectrum. In contrast, residues 16-42 are easily observed in cross-polarization experiments and most likely form the amyloid core. Calculation of ψ and φ dihedral angles from the chemical shift assignments indicate that 4 β-strands are present in the fibril's secondary structure.
Conflict of interest statement
The authors declare no competing financial interest.
Figures
Similar articles
-
Amyloid fibril formation by A beta 16-22, a seven-residue fragment of the Alzheimer's beta-amyloid peptide, and structural characterization by solid state NMR.Biochemistry. 2000 Nov 14;39(45):13748-59. doi: 10.1021/bi0011330. Biochemistry. 2000. PMID: 11076514
-
Atomic Resolution Structure of Monomorphic Aβ42 Amyloid Fibrils.J Am Chem Soc. 2016 Aug 3;138(30):9663-74. doi: 10.1021/jacs.6b05129. Epub 2016 Jul 14. J Am Chem Soc. 2016. PMID: 27355699 Free PMC article.
-
Structural characterization of E22G Aβ1-42 fibrils via1H detected MAS NMR.Phys Chem Chem Phys. 2024 May 22;26(20):14664-14674. doi: 10.1039/d4cp00553h. Phys Chem Chem Phys. 2024. PMID: 38715538 Free PMC article.
-
Understanding amyloid fibril nucleation and aβ oligomer/drug interactions from computer simulations.Acc Chem Res. 2014 Feb 18;47(2):603-11. doi: 10.1021/ar4002075. Epub 2013 Dec 24. Acc Chem Res. 2014. PMID: 24368046 Review.
-
New Mechanism of Amyloid Fibril Formation.Curr Protein Pept Sci. 2019;20(6):630-640. doi: 10.2174/1389203720666190125160937. Curr Protein Pept Sci. 2019. PMID: 30686252 Review.
Cited by
-
E22G Aβ40 fibril structure and kinetics illuminate how Aβ40 rather than Aβ42 triggers familial Alzheimer's.Nat Commun. 2024 Aug 15;15(1):7045. doi: 10.1038/s41467-024-51294-w. Nat Commun. 2024. PMID: 39147751 Free PMC article.
-
Amyloid β 42 fibril structure based on small-angle scattering.Proc Natl Acad Sci U S A. 2021 Nov 30;118(48):e2112783118. doi: 10.1073/pnas.2112783118. Proc Natl Acad Sci U S A. 2021. PMID: 34815346 Free PMC article.
-
Structural Characterization of Fibrils from Recombinant Human Islet Amyloid Polypeptide by Solid-State NMR: The Central FGAILS Segment Is Part of the β-Sheet Core.PLoS One. 2016 Sep 8;11(9):e0161243. doi: 10.1371/journal.pone.0161243. eCollection 2016. PLoS One. 2016. PMID: 27607147 Free PMC article.
-
Amyloid Fibril Formation of Arctic Amyloid-β 1-42 Peptide is Efficiently Inhibited by the BRICHOS Domain.ACS Chem Biol. 2022 Aug 19;17(8):2201-2211. doi: 10.1021/acschembio.2c00344. Epub 2022 Jul 25. ACS Chem Biol. 2022. PMID: 35876740 Free PMC article.
-
Site-specific detection of protein secondary structure using 2D IR dihedral indexing: a proposed assembly mechanism of oligomeric hIAPP.Chem Sci. 2017 Nov 3;9(2):463-474. doi: 10.1039/c7sc03789a. eCollection 2018 Jan 14. Chem Sci. 2017. PMID: 29619202 Free PMC article.
References
Publication types
MeSH terms
Substances
Grants and funding
LinkOut - more resources
Full Text Sources
Other Literature Sources
