. 2015 May 22;10(5):e0127600.
doi: 10.1371/journal.pone.0127600. eCollection 2015.

Ribonucleotide reductase subunit M2 predicts survival in subgroups of patients with non-small cell lung carcinoma: effects of gender and smoking status

Affiliations

Ribonucleotide reductase subunit M2 predicts survival in subgroups of patients with non-small cell lung carcinoma: effects of gender and smoking status

Vei Mah et al. PLoS One. .

Abstract

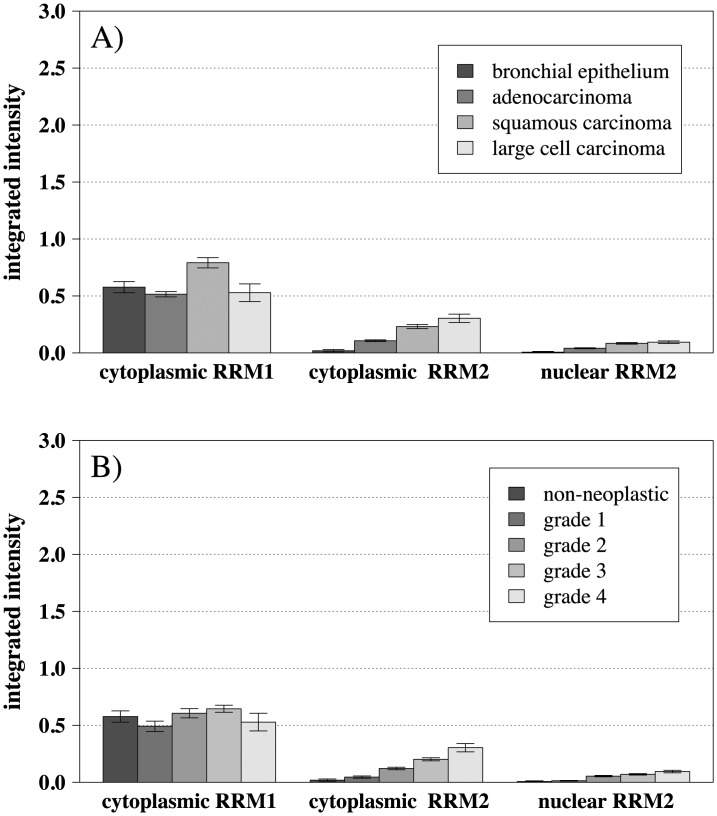
Background: Ribonucleotide reductase catalyzes the conversion of ribonucleotide diphosphates to deoxyribonucleotide diphosphates. The functional enzyme consists of two subunits - one large (RRM1) and one small (RRM2 or RRM2b) subunit. Expression levels of each subunit have been implicated in prognostic outcomes in several different types of cancers.

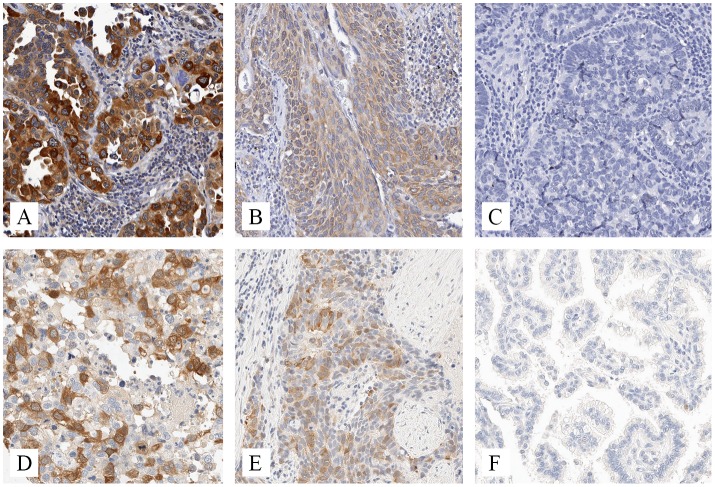
Experimental design: Immunohistochemistry for RRM1 and RRM2 was performed on a lung cancer tissue microarray (TMA) and analyzed. 326 patients from the microarray were included in this study.

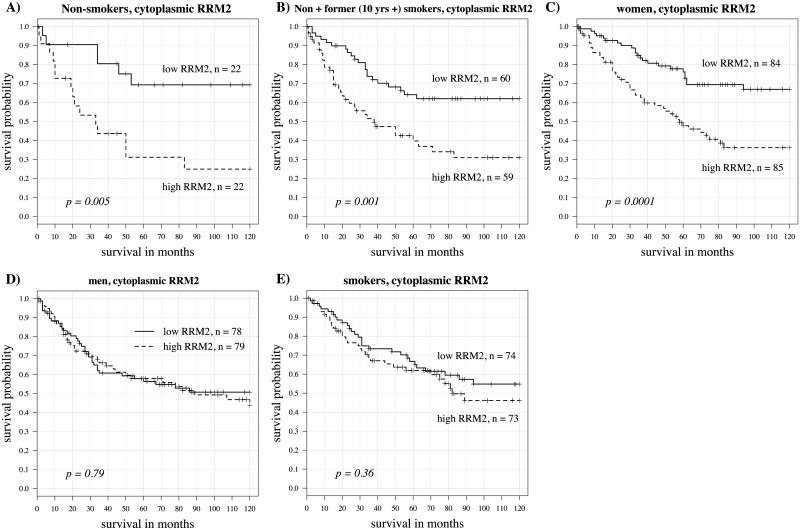
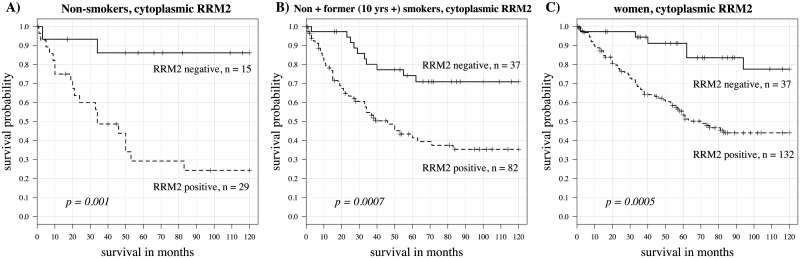
Results: In non-small cell lung cancer (NSCLC), RRM2 expression was strongly predictive of disease-specific survival in women, non-smokers and former smokers who had quit at least 10 years prior to being diagnosed with lung cancer. Higher expression was associated with worse survival. This was not the case for men, current smokers and those who had stopped smoking for shorter periods of time. RRM1 was not predictive of survival outcomes in any subset of the patient group.

Conclusion: RRM2, but not RRM1, is a useful predictor of survival outcome in certain subsets of NSCLC patients.


Conflict of interest statement

Competing Interests: The authors have declared that no competing interests exist.

Figures

Fig 1
Fig 1. Photomicrographs of RRM1 and RRM2.
Representative images (20x magnification) showing cellular variability for immunohistochemical staining of (A-C) RRM1 and (D-F) RRM2. Many tumors showed completely negative staining (C and F), while others showed variable staining of individual cells within the tumor (A,D,E) and some showed more uniform staining of individual tumor cells (B).
Fig 2
Fig 2. Histograms of RRM1 and RRM2 staining patterns.
Distribution for staining intensity (measured by integrated intensity: [(3x) + (2y) + (1z)] / 100 where x, y, and z are % staining at intensity 3, 2, and 1, respectively) of (A) cytoplasmic RRM1, (B) cytoplasmic RRM2 and (C) nuclear RRM2. Although variable, overall staining was stronger for cytoplasmic RRM1. Many patients showed weak or negative staining.
Fig 3
Fig 3. Barplots for relative RRM1 and RRM2 protein expression levels in cytoplasm (integrated intensity, scale from 0 to 3) by (A) histology and (B) grade.
Both RRM1 and RRM2 expression were higher in squamous carcinoma than adenocarcinoma (p < 10–5). RRM1 expression did not correlate with tumor grade (rho = 0.04, p = 0.55) while RRM2 expression correlated positively with grade (rho = 0.44, p < 10–5 for cytoplasm and rho = 0.36, p < 10–5 for nucleus).
Fig 4
Fig 4. Kaplan Meier curves for RRM1 and RRM2 in all patients.
(A) cytoplasmic RRM2, split by median expression levels (p = 0.002, hazard ratio = 1.70). (B) cytoplasmic RRM1, split by median expression levels (p = 0.497, hazard ratio = 1.12).
Fig 5
Fig 5. Kaplan Meier curves for cytoplasmic RRM2 split by median expression levels in patient subgroups.
(A) non-smokers (p = 0.005, hazard ratio = 3.58). (B) non-smokers plus those quitting more than 10 years (p = 0.001, hazard ratio = 2.38). (C) women (p = 0.0001, hazard ratio = 2.57). (D) men (p = 0.79, hazard ratio = 1.07). (E) smokers—includes current smokers plus those quitting 10 years or less (p = 0.36, hazard ratio = 1.27).
Fig 6
Fig 6. Kaplan Meier curve for cytoplasmic RRM2 split by positive vs. negative staining.
(A) non-smokers (p = 0.001, hazard ratio = 7.81). (B) non-smokers plus those quitting more than 10 years (p = 0.0007, hazard ratio = 3.11). (C) women (p = 0.0005, hazard ratio = 3.99).

Similar articles

Cited by

References

    1. American Cancer Society: Cancer Facts & Figures 2014. Available: http://www.cancer.org/acs/groups/content/@research/documents/webcontent/....
    1. Govindan R, Ding L, Griffith M, Subramanian J, Dees ND, Kanchi KL, et al. Genomic landscape of non-small cell lung cancer in smokers and never-smokers. Cell. 2012;150(6):1121–34. Epub 2012/09/18. S0092-8674(12)01022-7 [pii] 10.1016/j.cell.2012.08.024 . - DOI - PMC - PubMed
    1. Couraud S, Zalcman G, Milleron B, Morin F, Souquet PJ. Lung cancer in never smokers—a review. Eur J Cancer. 2012;48(9):1299–311. Epub 2012/04/03. S0959-8049(12)00252-3 [pii] 10.1016/j.ejca.2012.03.007 . - DOI - PubMed
    1. Sakurai H, Asamura H, Goya T, Eguchi K, Nakanishi Y, Sawabata N, et al. Survival differences by gender for resected non-small cell lung cancer: a retrospective analysis of 12,509 cases in a Japanese Lung Cancer Registry study. J Thorac Oncol. 2010;5(10):1594–601. Epub 2010/08/26. 10.1097/JTO.0b013e3181f1923b . - DOI - PubMed
    1. Subramanian J, Govindan R. Molecular genetics of lung cancer in people who have never smoked. Lancet Oncol. 2008;9(7):676–82. Epub 2008/07/05. S1470-2045(08)70174-8 [pii] 10.1016/S1470-2045(08)70174-8 . - DOI - PubMed

Publication types

Substances