. 2015 Jul 7;22(1):164-74.
doi: 10.1016/j.cmet.2015.05.010. Epub 2015 May 19.

GDF11 Increases with Age and Inhibits Skeletal Muscle Regeneration

Affiliations

GDF11 Increases with Age and Inhibits Skeletal Muscle Regeneration

Marc A Egerman et al. Cell Metab. .

Abstract

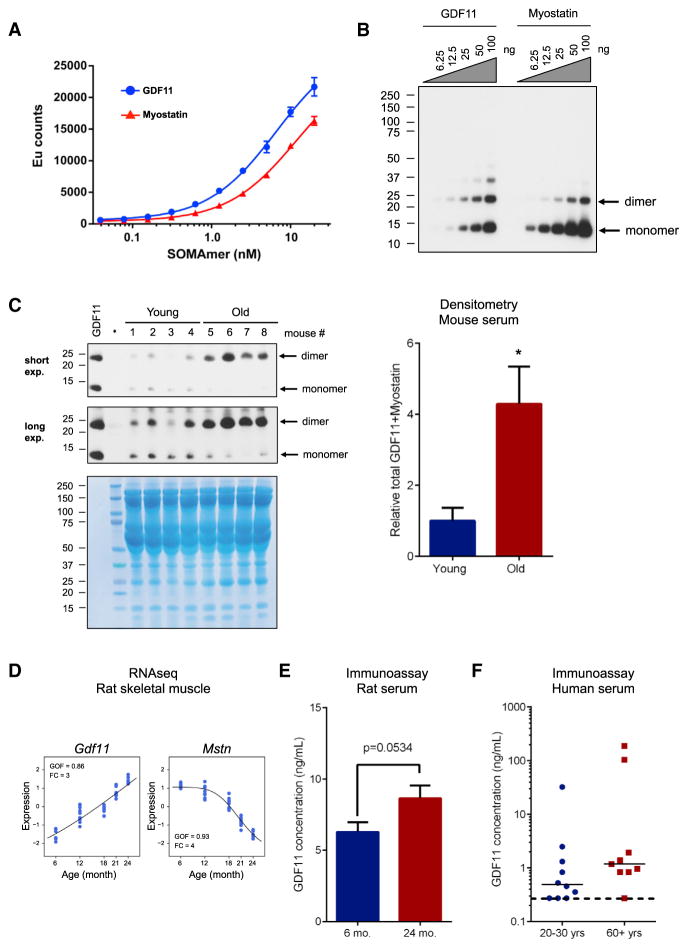
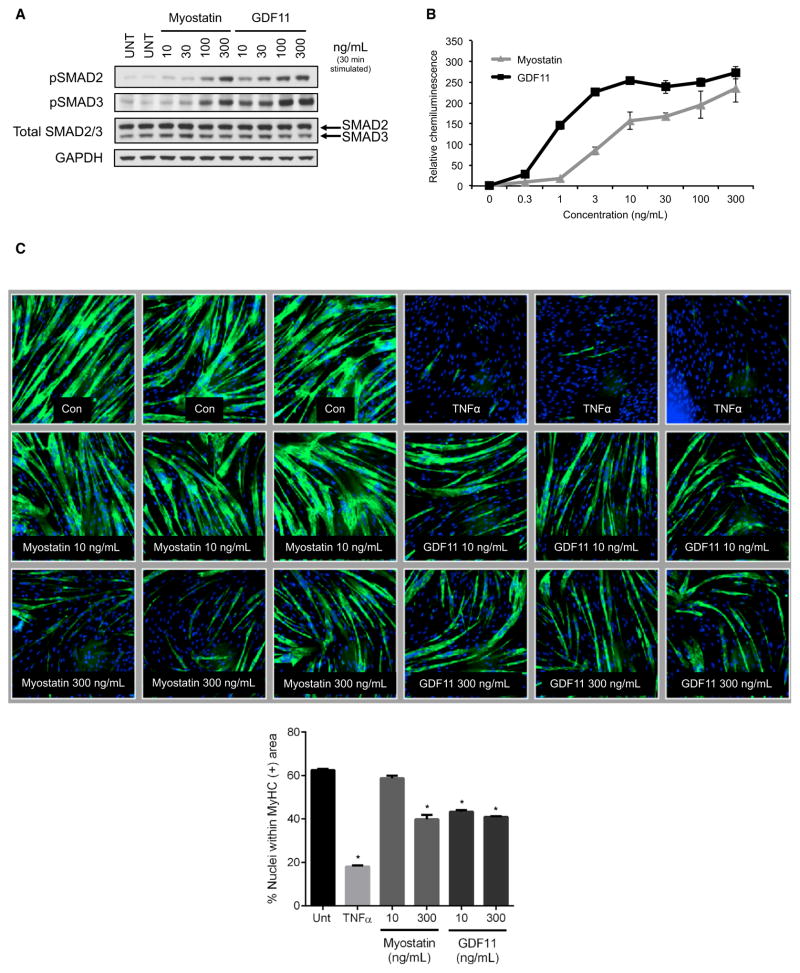
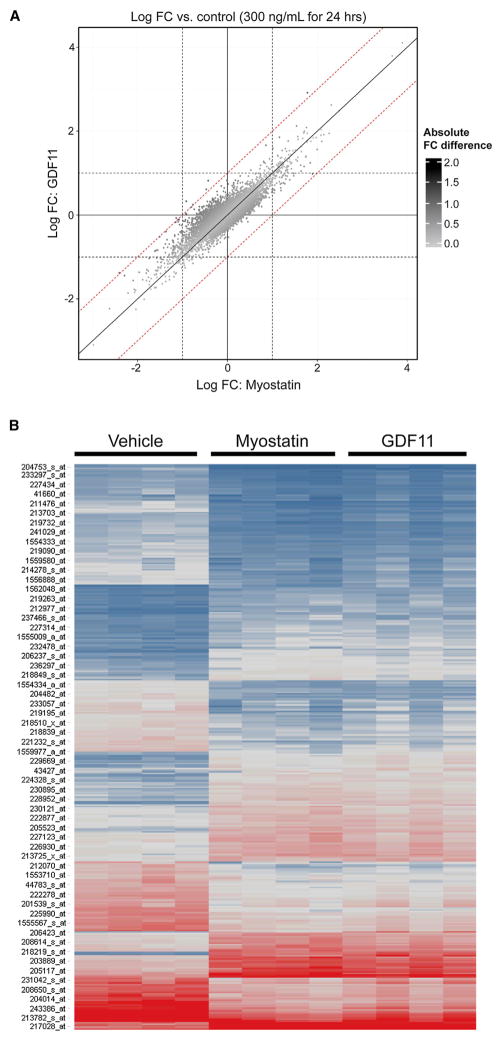
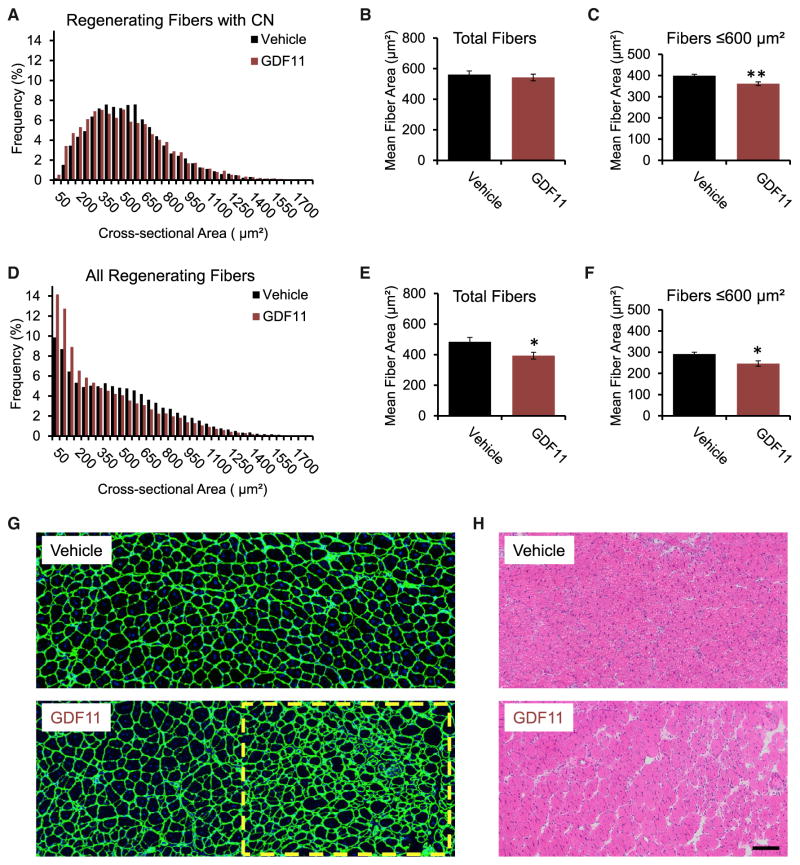
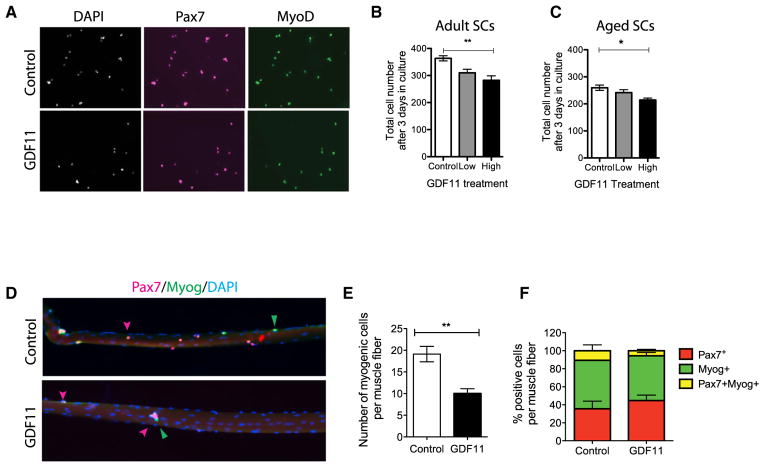
Age-related frailty may be due to decreased skeletal muscle regeneration. The role of TGF-β molecules myostatin and GDF11 in regeneration is unclear. Recent studies showed an age-related decrease in GDF11 and that GDF11 treatment improves muscle regeneration, which were contrary to prior studies. We now show that these recent claims are not reproducible and the reagents previously used to detect GDF11 are not GDF11 specific. We develop a GDF11-specific immunoassay and show a trend toward increased GDF11 levels in sera of aged rats and humans. GDF11 mRNA increases in rat muscle with age. Mechanistically, GDF11 and myostatin both induce SMAD2/3 phosphorylation, inhibit myoblast differentiation, and regulate identical downstream signaling. GDF11 significantly inhibited muscle regeneration and decreased satellite cell expansion in mice. Given early data in humans showing a trend for an age-related increase, GDF11 could be a target for pharmacologic blockade to treat age-related sarcopenia.


Conflict of interest statement

H.N.N. and A.S.B. declare no conflicts.

Figures

Figure 1
Figure 1. Prior Reagents Used to Measure GDF11 Are Not Specific, but Show that the Combination of GDF11 and Myostatin Increases with Age; Specific Methods show GDF11 Levels Increase with Age
(A) Affinity of GDF11 SOMAmer for recombinant GDF11 and myostatin. Binding of the GDF11 SOMAmer to GDF11 (shown in blue) and myostatin (shown in red) proteins as measured by dissociation-enhanced lanthanide fluorescent immunoassay (DELFIA). Data represent means ± SD from three technical replicates. (B) Western blot analysis to determine specificity of Abcam antibody to GDF11 versus myostatin (GDF8). An anti-GDF11 antibody from Abcam was tested for specificity using a concentration gradient of recombinant GDF11 and myostatin, ranging from 6.25 ng to 100 ng, and was found to cross-react with myostatin. Even though this is a denaturing gel, bands consistent with dimer and even high molecular forms consistent with aggregates of the recombinant material are evident. (C) Western analysis on sera from young and old mice. Sera samples from four different young animals (4 months old; 1, 2, 3, 4) and four different old animals (23 months old; 5, 6, 7, 8) were tested by western analysis for myostatin/GDF11 levels (top). Coomasie staining (bottom) demonstrates equivalent loading of each lane. Lane with ladder is indicated. The dimer band was not fully denatured to monomer. There was an increase in GDF11/myostatin dimer levels in the sera from older animals in comparison to young animals. Densitometry of monomer + dimer is provided on the right, indicating an overall increase in myostatin/GDF11 levels in the mouse sera (*p < 0.05). (D) GDF11 and myostatin mRNA content in in skeletal muscles of Sprague-Dawley male rats aged 6, 12, 18, 21, and 24 months (data derived from the RNA-seq analyses). RNA-seq analysis demonstrates that GDF11 expression increases as a function of age (comparing mRNA obtained from muscles from 6-, 12-, 18-, 21-, and 24-month-old rats). In contrast, myostatin (MSTN) expression decreases with age in rats. The y axis is the standardized expression level, with mean of 0 and standard deviation of 1. GOF, goodness of fit to a sigmoidal curve; FC, fold change between 24 m and 6 m. (E) GDF11 protein levels in sera from young and old rats determined by immunoassay. GDF11 protein content in serum from young (6 months) or old (24 months) rats was measured by immunoassay. Old rats had higher levels of GDF11 compared with young. Data are mean ± SEM (p = 0.0534, Student’s t test). (F) GDF11 protein levels in sera from young and older humans determined by immunoassay. GDF11 protein content was measured in serum samples from nine older (aged >60 years, males, shown in red) or ten young (aged 20–30 years, males, shown in blue). The median GDF11 concentration in serum of older humans was higher than in younger humans, but this did not reach statistical significance. Serum samples from three young and one old subject had GDF11 below a detection limit (less than 0.274 ng/ml), shown with a dotted horizontal line.
Figure 2
Figure 2. GDF11 and Myostatin Signal through Identical Pathways in Skeletal Muscle
(A) Western blot analysis to determine myostatin versus GDF11 activation of downstream signaling. Human myotubes were stimulated with vehicle (UNT), as a negative control, or with increasing doses of myostatin or GDF11 (10, 30, 100, 300 ng/ml). Both proteins stimulated SMAD2 and SMAD3 phosphorylation (pSMAD2 and pSMAD3) in a dose-dependent manner. (B) SMAD2/3 reporter assay. A CAGA-luc reporter gene assay treated with either myostatin (GDF8) or GDF11 was used to assess recombinant protein activity. Data are expressed as chemiluminescence units, relative to untreated, and shown as means ± SEM. Both myostatin and GDF11 were shown to be active. (C) Human myoblast differentiation assay. Myoblasts were differentiated into myotubes without any treatment (−) as a negative control, TNF-α (30ng/ml) as a positive control, and two concentrations of myostatin (GDF8) (10 ng/ml and 300 ng/ml) and GDF11 (10 ng/ml and 300 ng/ml). Biological triplicates are shown for each treatment, with myotubes identified using anti-MyHC antibody staining. Both myostatin and GDF11 can block myoblast differentiation. Differentiation was quantified in the bar graph by evaluating the percentage of nuclei within myotubes that were positively identified using anti-MyHC antibody staining. Differences between groups were analyzed using one-way ANOVA (compared to UNT group). Data are means ± SEM. Values were considered statistically significant at p < 0.05 (*).
Figure 3
Figure 3. Microarray Analysis of hSkMDCs Treated with GDF11 or Myostatin Demonstrate that GDF11 and Myostatin Induce Almost Identical Expression Changes
(A) The log fold-change (FC) versus control samples for samples (n = 4 biological replicates per group) stimulated for 24 hr with 300 ng/ml myostatin or GDF11 (x and y axes, respectively). Data points are colored by absolute FC difference, with darker points representing larger differences. Reference lines are included for log FC differences of 1/−1 (dashed) and 0 (solid). (B) Gene expression was generated for hSkMDCs treated with GDF11 or myostatin. There were 243 genes (356 probe sets) regulated by either GDF11 or MSTN. Intensities are shown for vehicle and the two treatments (GDF11 and myostatin; 24 hr at 300 ng/ml). Blue, low expression; red, high expression; gray, median expression. Genes are regulated similarly by GDF11 and MSTN.
Figure 4
Figure 4. GDF11 Delays Regeneration of Tibialis Anterior Muscle following Cardiotoxin Injury
(A–D) In regenerating fibers positive for centralized nuclei, GDF11 treatment induced (A) a leftward shift in fiber cross-sectional area frequency distribution, but no change in (B) total mean fiber area; however, (C) mean fiber area of fibers with cross-sectional areas ≤600 μm2 was significantly reduced with GDF11 treatment (p = 0.0045). In GDF11-treated mice, regenerating muscles had (D) a greater frequency of smaller-size fibers (positive and undetectable for centralized nuclei). (E and F) Total mean fiber area (E) and mean area of fibers ≤ 600 μm2 (F) was significantly decreased with GDF11 treatment (p = 0.028 and p = 0.014, respectively). (G) Representative images of regenerating tibialis anterior muscles stained with an anti-laminin antibody (green) and Hoechst (blue) show regions of much smaller fibers that are indicative of delayed regeneration (yellow dashed box) with GDF11 compared to Vehicle treatment. (H) Representative images of H&E-stained tissues showing region of delayed regeneration with GDF11 treatment. *p < 0.05, **p < 0.01. CN, centralized nuclei. Scale bar, 100 μm.
Figure 5
Figure 5. GDF11 Limits Satellite Cell Expansion in Adult and Aged Mice
(A) Representative Pax7 (magenta) and MyoD (green) immunostaining of adult SCs after 3 days in culture treated with GDF11 (50 ng/ml) or vehicle control. DAPI marks myonuclei (white). (B and C) Histograms show the total number of (B) adult and (C) aged myogenic cells per well after 3 days of GDF11 (15 ng/ml, low or 50 ng/ml, high) or vehicle control treatment in culture (n = 1,645–2,185 cells, performed in triplicate). (D) Single muscle fibers from control (top) and GDF11-treated (bottom) 3-day cultures show Pax7+ (red) and myogenin (Myog)+ (green) cells. DAPI highlights myonuclei (blue). Arrowheads show representative cells. (E and F) Data are represented as mean ± SD. Cell growth assays were statistically analyzed by Kruskal-Wallis nonparametric test with Dunn’s post hoc test (*p < 0.05). Student’s t test was performed on single-fiber data followed by a Mann-Whitney U post hoc test (**p < 0.01).

Comment in

Similar articles

Cited by

References

    1. Bass J, Oldham J, Sharma M, Kambadur R. Growth factors controlling muscle development. Domest Anim Endocrinol. 1999;17:191–197. - PubMed
    1. Beggs ML, Nagarajan R, Taylor-Jones JM, Nolen G, Macnicol M, Peterson CA. Alterations in the TGFbeta signaling pathway in myogenic progenitors with age. Aging Cell. 2004;3:353–361. - PubMed
    1. Carlson ME, Conboy MJ, Hsu M, Barchas L, Jeong J, Agrawal A, Mikels AJ, Agrawal S, Schaffer DV, Conboy IM. Relative roles of TGF-beta1 and Wnt in the systemic regulation and aging of satellite cell responses. Aging Cell. 2009;8:676–689. - PMC - PubMed
    1. Egerman MA, Glass DJ. Signaling pathways controlling skeletal muscle mass. Crit Rev Biochem Mol Biol. 2014;49:59–68. - PMC - PubMed
    1. Gamer LW, Cox KA, Small C, Rosen V. Gdf11 is a negative regulator of chondrogenesis and myogenesis in the developing chick limb. Dev Biol. 2001;229:407–420. - PubMed

Publication types

MeSH terms

Associated data