

Probing long-range interactions by extracting free energies from genome-wide chromosome conformation capture data
- PMID: 26001583
- PMCID: PMC4492175
- DOI: 10.1186/s12859-015-0584-2
Probing long-range interactions by extracting free energies from genome-wide chromosome conformation capture data
Abstract
Background: A variety of DNA binding proteins are involved in regulating and shaping the packing of chromatin. They aid the formation of loops in the DNA that function to isolate different structural domains. A recent experimental technique, Hi-C, provides a method for determining the frequency of such looping between all distant parts of the genome. Given that the binding locations of many chromatin associated proteins have also been measured, it has been possible to make estimates for their influence on the long-range interactions as measured by Hi-C. However, a challenge in this analysis is the predominance of non-specific contacts that mask out the specific interactions of interest.
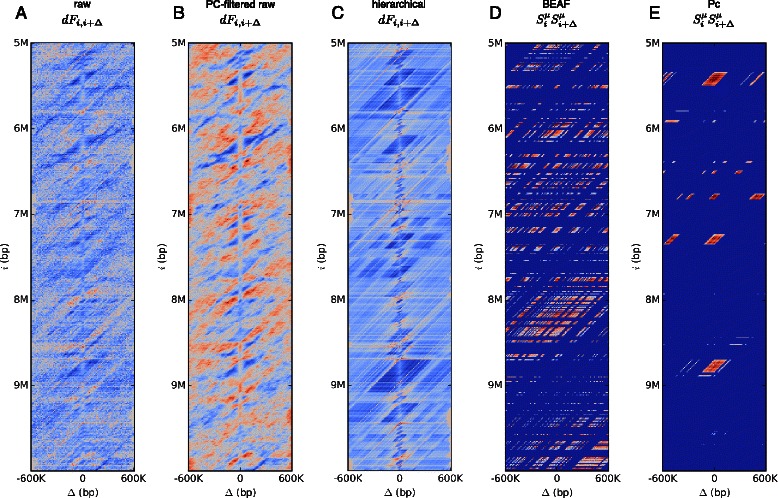
Results: We show that transforming the Hi-C contact frequencies into free energies gives a natural method for separating out the distance dependent non-specific interactions. In particular we apply Principal Component Analysis (PCA) to the transformed free energy matrix to identify the dominant modes of interaction. PCA identifies systematic effects as well as high frequency spatial noise in the Hi-C data which can be filtered out. Thus it can be used as a data driven approach for normalizing Hi-C data. We assess this PCA based normalization approach, along with several other normalization schemes, by fitting the transformed Hi-C data using a pairwise interaction model that takes as input the known locations of bound chromatin factors. The result of fitting is a set of predictions for the coupling energies between the various chromatin factors and their effect on the energetics of looping. We show that the quality of the fit can be used as a means to determine how much PCA filtering should be applied to the Hi-C data.
Conclusions: We find that the different normalizations of the Hi-C data vary in the quality of fit to the pairwise interaction model. PCA filtering can improve the fit, and the predicted coupling energies lead to biologically meaningful insights for how various chromatin bound factors influence the stability of DNA loops in chromatin.
Figures


Similar articles
-
Practical Analysis of Genome Contact Interaction Experiments.Methods Mol Biol. 2016;1418:177-89. doi: 10.1007/978-1-4939-3578-9_9. Methods Mol Biol. 2016. PMID: 27008015
-
Iteratively improving Hi-C experiments one step at a time.Methods. 2018 Jun 1;142:47-58. doi: 10.1016/j.ymeth.2018.04.033. Epub 2018 Apr 30. Methods. 2018. PMID: 29723572
-
Detecting Spatial Chromatin Organization by Chromosome Conformation Capture II: Genome-Wide Profiling by Hi-C.Methods Mol Biol. 2017;1589:47-74. doi: 10.1007/7651_2015_261. Methods Mol Biol. 2017. PMID: 26900130
-
Technical Review: A Hitchhiker's Guide to Chromosome Conformation Capture.Methods Mol Biol. 2018;1675:233-246. doi: 10.1007/978-1-4939-7318-7_14. Methods Mol Biol. 2018. PMID: 29052195 Review.
-
A (3D-Nuclear) Space Odyssey: Making Sense of Hi-C Maps.Genes (Basel). 2019 May 29;10(6):415. doi: 10.3390/genes10060415. Genes (Basel). 2019. PMID: 31146487 Free PMC article. Review.
Cited by
-
Computational Identification of Genomic Features That Influence 3D Chromatin Domain Formation.PLoS Comput Biol. 2016 May 20;12(5):e1004908. doi: 10.1371/journal.pcbi.1004908. eCollection 2016 May. PLoS Comput Biol. 2016. PMID: 27203237 Free PMC article.
-
A maximum-entropy model for predicting chromatin contacts.PLoS Comput Biol. 2018 Feb 5;14(2):e1005956. doi: 10.1371/journal.pcbi.1005956. eCollection 2018 Feb. PLoS Comput Biol. 2018. PMID: 29401453 Free PMC article.
References
MeSH terms
Substances
LinkOut - more resources
Full Text Sources
Other Literature Sources
Molecular Biology Databases
