

Automated acquisition and analysis of airway surface liquid height by confocal microscopy
- PMID: 26001773
- PMCID: PMC4504972
- DOI: 10.1152/ajplung.00027.2015
Automated acquisition and analysis of airway surface liquid height by confocal microscopy
Abstract
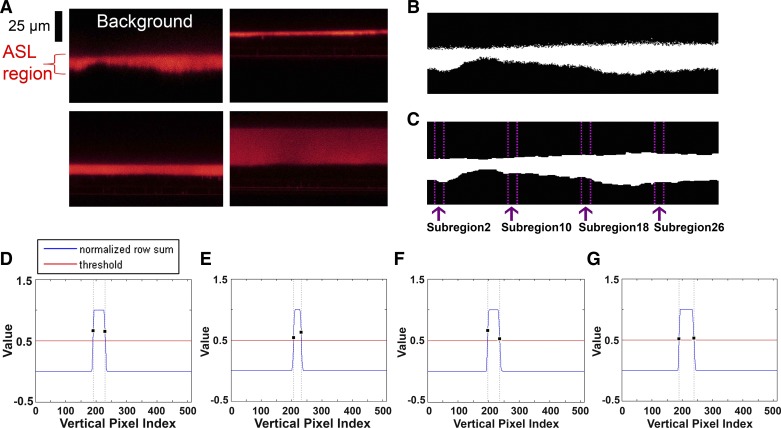
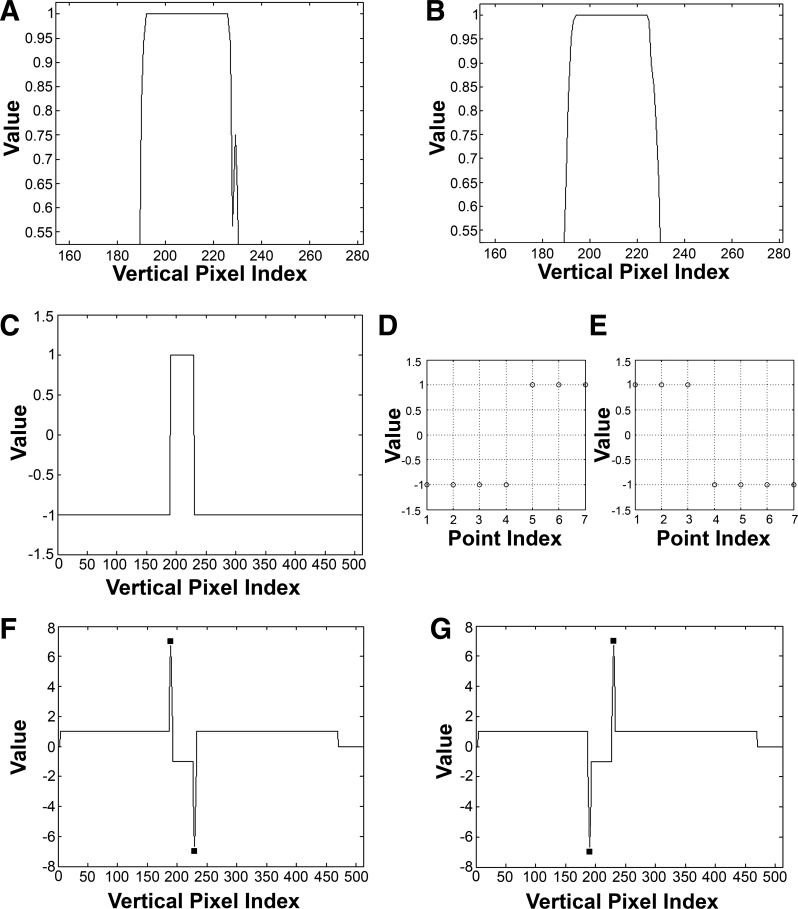
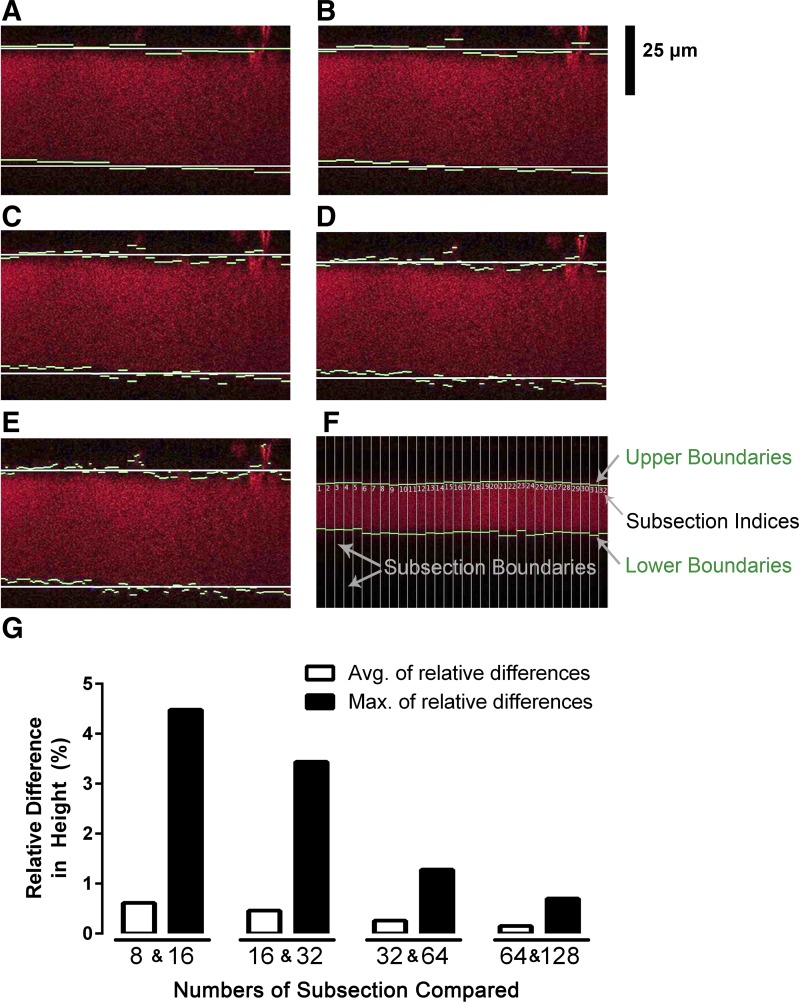
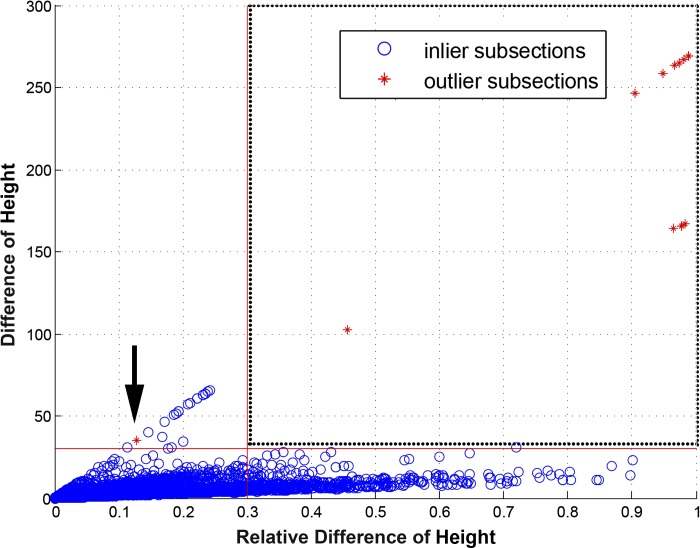
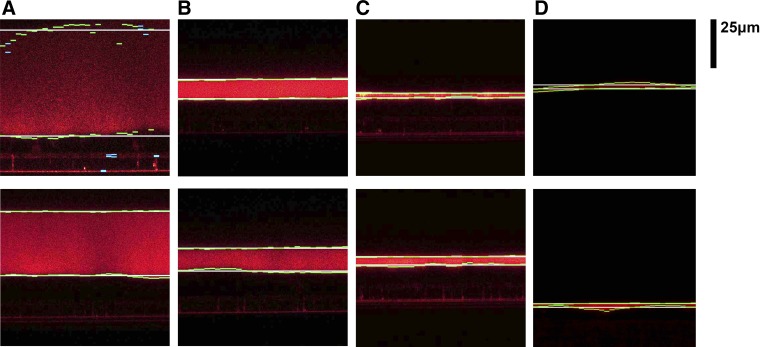
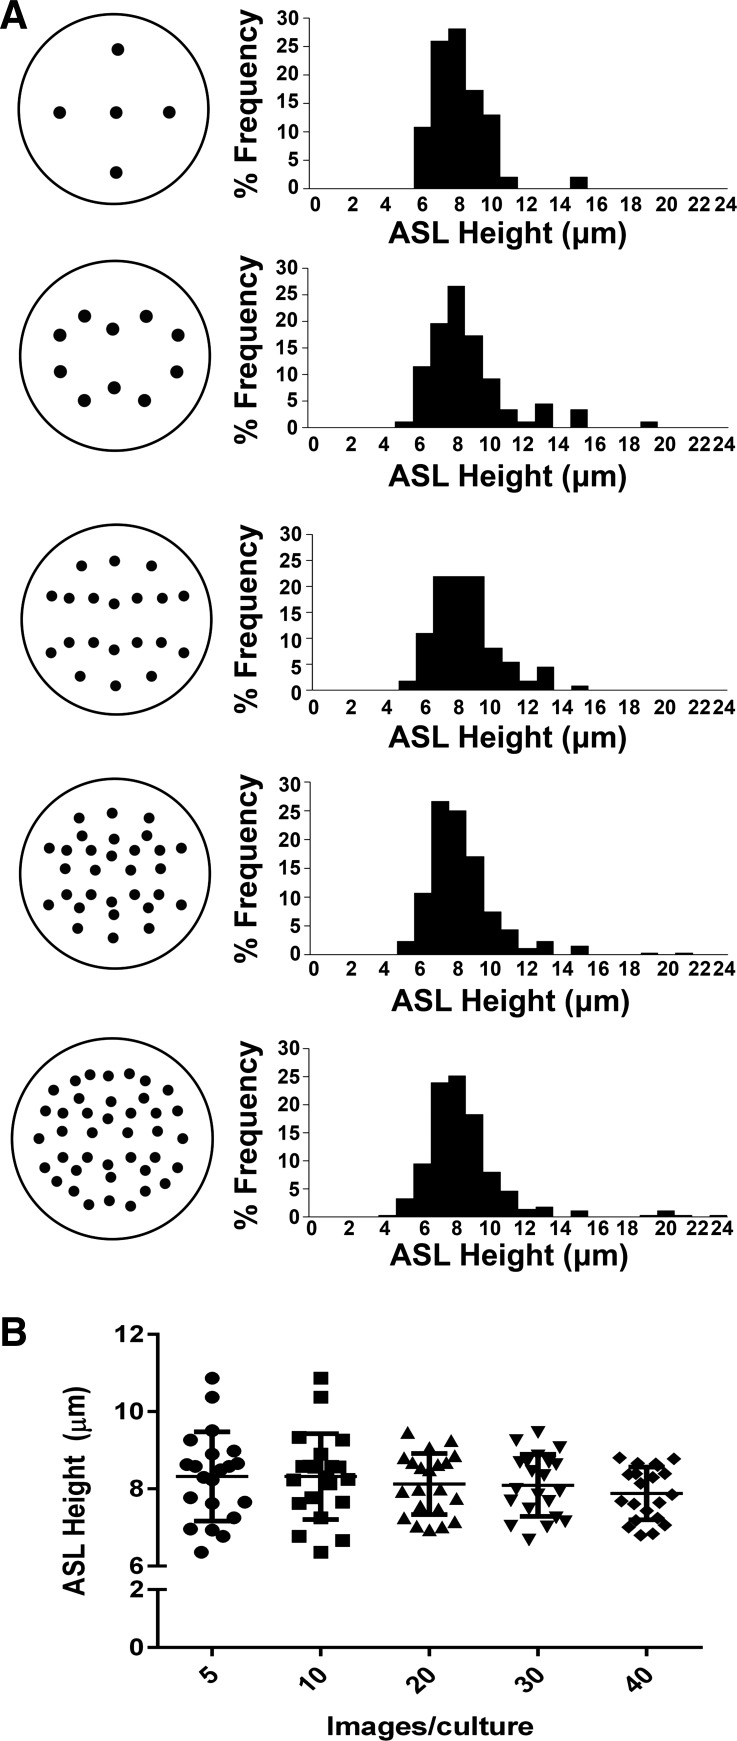
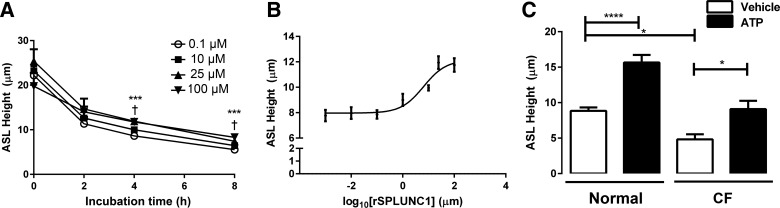
The airway surface liquid (ASL) is a thin-liquid layer that lines the luminal side of airway epithelia. ASL contains many molecules that are involved in primary innate defense in the lung. Measurement of ASL height on primary airway cultures by confocal microscopy is a powerful tool that has enabled researchers to study ASL physiology and pharmacology. Previously, ASL image acquisition and analysis were performed manually. However, this process is time and labor intensive. To increase the throughput, we have developed an automatic ASL measurement technique that combines a fully automated confocal microscope with novel automatic image analysis software that was written with image processing techniques derived from the computer science field. We were able to acquire XZ ASL images at the rate of ∼ 1 image/s in a reproducible fashion. Our automatic analysis software was able to analyze images at the rate of ∼ 32 ms/image. As proofs of concept, we generated a time course for ASL absorption and a dose response in the presence of SPLUNC1, a known epithelial sodium channel inhibitor, on human bronchial epithelial cultures. Using this approach, we determined the IC50 for SPLUNC1 to be 6.53 μM. Furthermore, our technique successfully detected a difference in ASL height between normal and cystic fibrosis (CF) human bronchial epithelial cultures and detected changes in ATP-stimulated Cl(-)/ASL secretion. We conclude that our automatic ASL measurement technique can be applied for repeated ASL height measurements with high accuracy and consistency and increased throughput.
Keywords: CFTR; COPD; ENaC; airway surface liquid; cystic fibrosis; fluorescent microscopy.
Copyright © 2015 the American Physiological Society.
Figures
Similar articles
-
Identification of the SPLUNC1 ENaC-inhibitory domain yields novel strategies to treat sodium hyperabsorption in cystic fibrosis airway epithelial cultures.Am J Physiol Lung Cell Mol Physiol. 2013 Dec;305(12):L990-L1001. doi: 10.1152/ajplung.00103.2013. Epub 2013 Oct 11. Am J Physiol Lung Cell Mol Physiol. 2013. PMID: 24124190 Free PMC article.
-
SPLUNC1 degradation by the cystic fibrosis mucosal environment drives airway surface liquid dehydration.Eur Respir J. 2018 Oct 4;52(4):1800668. doi: 10.1183/13993003.00668-2018. Print 2018 Oct. Eur Respir J. 2018. PMID: 30190268 Free PMC article.
-
Lipoxin A4 stimulates calcium-activated chloride currents and increases airway surface liquid height in normal and cystic fibrosis airway epithelia.PLoS One. 2012;7(5):e37746. doi: 10.1371/journal.pone.0037746. Epub 2012 May 25. PLoS One. 2012. PMID: 22662206 Free PMC article.
-
Mammalian short palate lung and nasal epithelial clone 1 (SPLUNC1) in pH-dependent airway hydration.Int J Biochem Cell Biol. 2014 Jul;52:130-5. doi: 10.1016/j.biocel.2014.03.002. Epub 2014 Mar 13. Int J Biochem Cell Biol. 2014. PMID: 24631954 Free PMC article. Review.
-
Airway surface liquid homeostasis in cystic fibrosis: pathophysiology and therapeutic targets.Thorax. 2016 Mar;71(3):284-7. doi: 10.1136/thoraxjnl-2015-207588. Epub 2015 Dec 30. Thorax. 2016. PMID: 26719229 Review.
Cited by
-
Structural Features Essential to the Antimicrobial Functions of Human SPLUNC1.Biochemistry. 2016 May 31;55(21):2979-91. doi: 10.1021/acs.biochem.6b00271. Epub 2016 May 17. Biochemistry. 2016. PMID: 27145151 Free PMC article.
-
E-cigarette constituents propylene glycol and vegetable glycerin decrease glucose uptake and its metabolism in airway epithelial cells in vitro.Am J Physiol Lung Cell Mol Physiol. 2020 Dec 1;319(6):L957-L967. doi: 10.1152/ajplung.00123.2020. Epub 2020 Sep 30. Am J Physiol Lung Cell Mol Physiol. 2020. PMID: 32996783 Free PMC article.
-
Epithelial sodium channel (ENaC) family: Phylogeny, structure-function, tissue distribution, and associated inherited diseases.Gene. 2016 Apr 1;579(2):95-132. doi: 10.1016/j.gene.2015.12.061. Epub 2016 Jan 7. Gene. 2016. PMID: 26772908 Free PMC article. Review.
-
Culture with apically applied healthy or disease sputum alters the airway surface liquid proteome and ion transport across human bronchial epithelial cells.Am J Physiol Cell Physiol. 2021 Dec 1;321(6):C954-C963. doi: 10.1152/ajpcell.00234.2021. Epub 2021 Oct 6. Am J Physiol Cell Physiol. 2021. PMID: 34613844 Free PMC article.
-
Adenine base editing of CFTR using receptor targeted nanoparticles restores function to G542X cystic fibrosis airway epithelial cells.Cell Mol Life Sci. 2025 Apr 7;82(1):144. doi: 10.1007/s00018-025-05587-y. Cell Mol Life Sci. 2025. PMID: 40192756 Free PMC article.
References
-
- Althaus M. ENaC inhibitors and airway re-hydration in cystic fibrosis: state of the art. Curr Mol Pharmacol 6: 3–12, 2013. - PubMed
-
- Arce G. Nonlinear Signaling Processing: A Statistical Approach. Hoboken, NJ: Wiley, 2005.
-
- Boucher RC. Airway surface dehydration in cystic fibrosis: pathogenesis and therapy. Annu Rev Med 58: 157–170, 2007. - PubMed
Publication types
MeSH terms
Substances
Grants and funding
LinkOut - more resources
Full Text Sources
Other Literature Sources
Medical
Research Materials