

Transcriptomic Changes in Zebrafish Embryos and Larvae Following Benzo[a]pyrene Exposure
- PMID: 26001963
- PMCID: PMC4607752
- DOI: 10.1093/toxsci/kfv105
Transcriptomic Changes in Zebrafish Embryos and Larvae Following Benzo[a]pyrene Exposure
Abstract
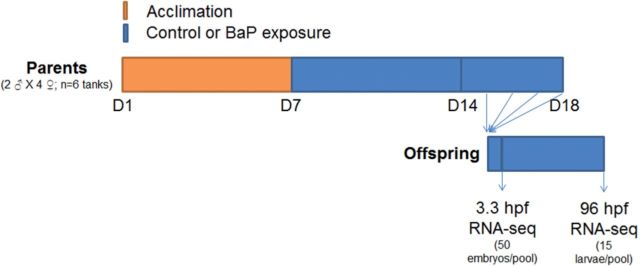
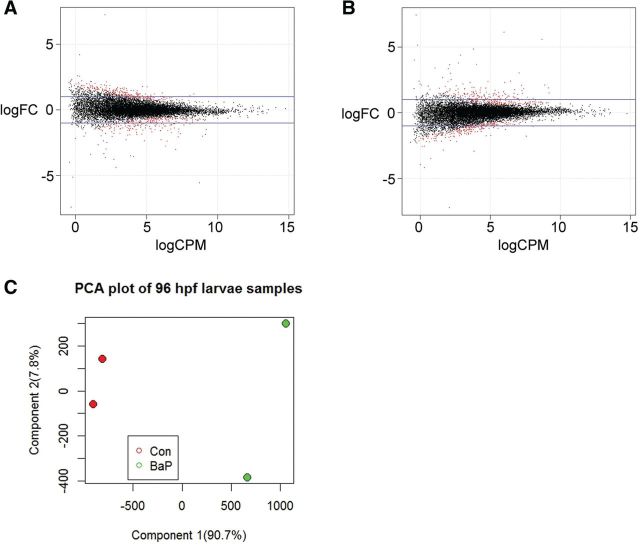
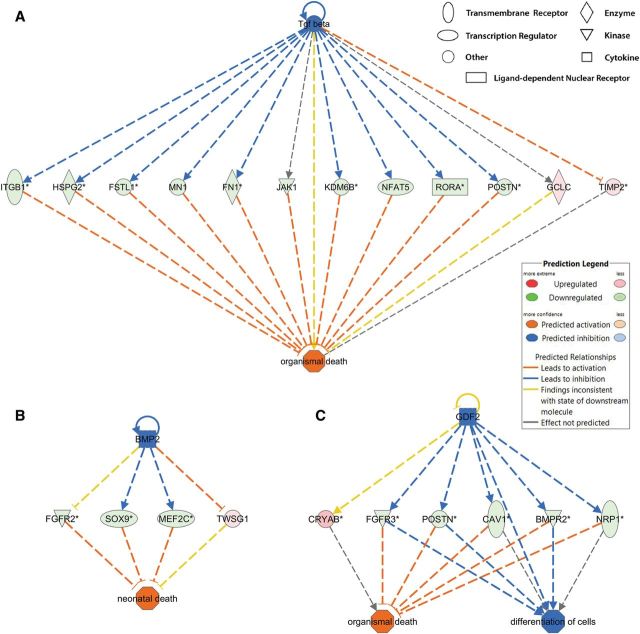
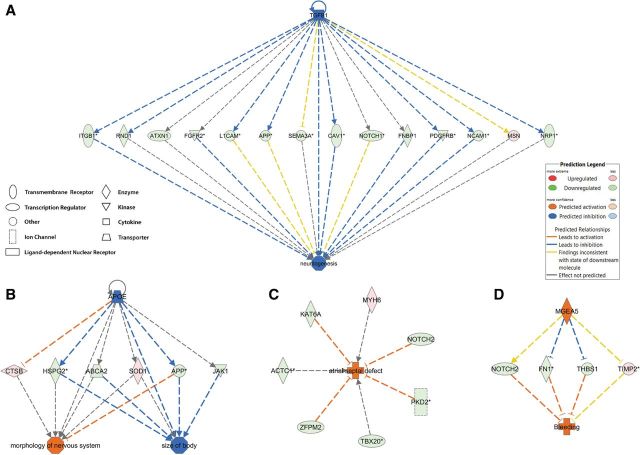
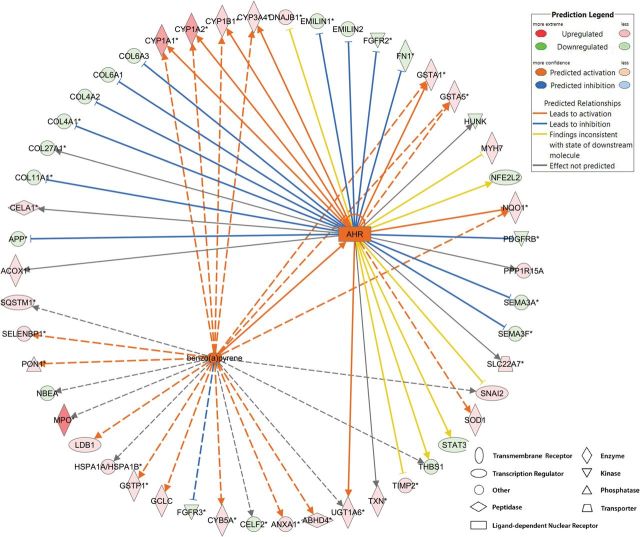
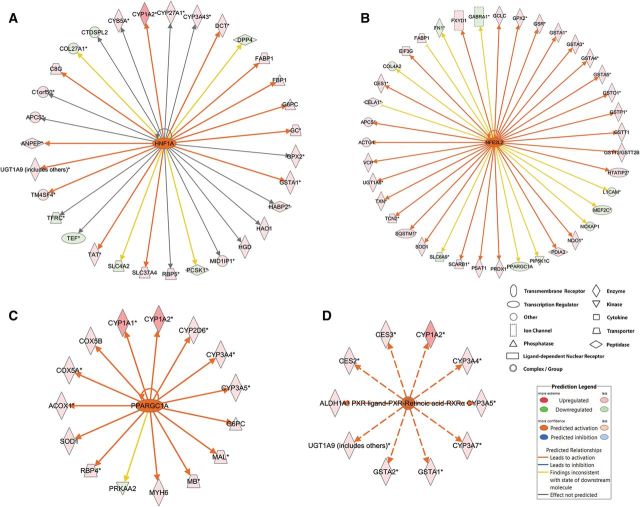
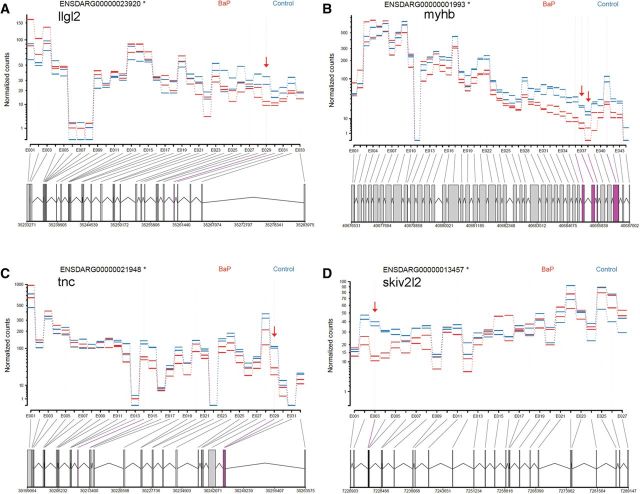
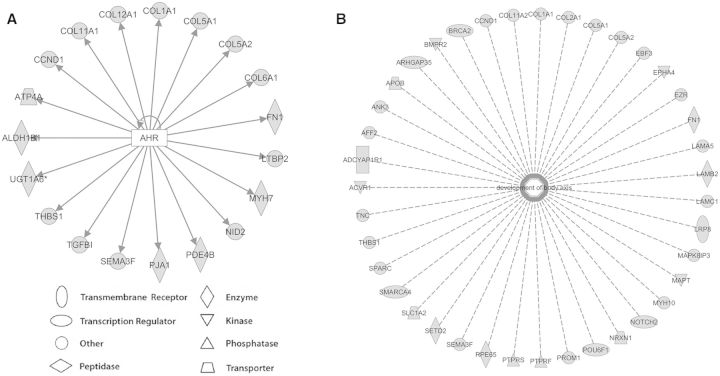
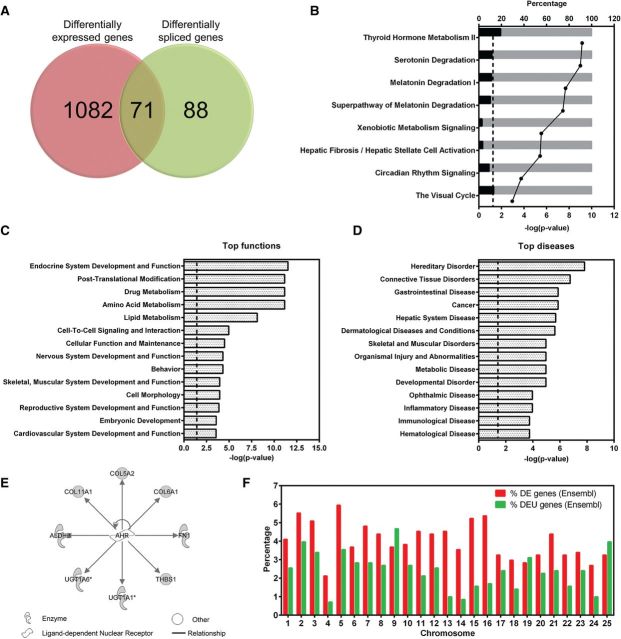
Benzo[a]pyrene (BaP) is an environmentally relevant carcinogenic and endocrine disrupting compound that causes immediate, long-term, and multigenerational health deficits in mammals and fish. Previously, we found that BaP alters DNA methylation patterns in developing zebrafish, which may affect gene expression. Herein, we performed a genome-wide transcriptional analysis and discovered differential gene expression and splicing in developing zebrafish. Adult zebrafish were exposed to control or 42.0 ± 1.9 µg/l BaP for 7 days. Eggs were collected and raised in control conditions or continuously exposed to BaP until 3.3 and 96 h post-fertilization (hpf). RNA sequencing (RNA-Seq) was conducted on zebrafish embryos and larvae. Data were analyzed to identify differentially expressed (DE) genes (changed at the gene or transcript variant level) and genes with differential exon usage (DEU; changed at the exon level). At 3.3 hpf, BaP exposure resulted in 8 DE genes and 51 DEU genes. At 96 hpf, BaP exposure altered expression in 1153 DE genes and 159 DEU genes. Functional ontology analysis by Ingenuity Pathway Analysis revealed that many disease pathways, including organismal death, growth failure, abnormal morphology of embryonic tissue, congenital heart disease, and adverse neuritogenesis, were significantly enriched for the DE and DEU genes, providing novel insights on the mechanisms of action of BaP-induced developmental toxicities. Collectively, we discovered substantial transcriptomic changes at the gene, transcript variant, and exon levels in developing zebrafish after early life BaP waterborne exposure, and these changes may lead to long-term adverse physiological consequences.
Keywords: RNA-Seq; alternative splicing; benzo[a]pyrene; development; gene expression; zebrafish.
© The Author 2015. Published by Oxford University Press on behalf of the Society of Toxicology. All rights reserved. For Permissions, please e-mail: journals.permissions@oup.com.
Figures
Similar articles
-
Mechanistic Evaluation of Benzo[a]pyrene's Developmental Toxicities Mediated by Reduced Cyp19a1b Activity.Toxicol Sci. 2017 Jan;155(1):135-147. doi: 10.1093/toxsci/kfw182. Epub 2016 Sep 14. Toxicol Sci. 2017. PMID: 27633980 Free PMC article.
-
Effects on specific promoter DNA methylation in zebrafish embryos and larvae following benzo[a]pyrene exposure.Comp Biochem Physiol C Toxicol Pharmacol. 2014 Jun;163:37-46. doi: 10.1016/j.cbpc.2014.02.005. Epub 2014 Feb 24. Comp Biochem Physiol C Toxicol Pharmacol. 2014. PMID: 24576477 Free PMC article.
-
Early-Life Benzo[a]Pyrene Exposure Causes Neurodegenerative Syndromes in Adult Zebrafish (Danio rerio) and the Mechanism Involved.Toxicol Sci. 2017 May 1;157(1):74-84. doi: 10.1093/toxsci/kfx028. Toxicol Sci. 2017. PMID: 28329817
-
AHR2-Mediated transcriptomic responses underlying the synergistic cardiac developmental toxicity of PAHs.Toxicol Sci. 2015 Feb;143(2):469-81. doi: 10.1093/toxsci/kfu245. Epub 2014 Nov 19. Toxicol Sci. 2015. PMID: 25412620 Free PMC article.
-
Adult and Developing Zebrafish as Suitable Models for Cardiac Electrophysiology and Pathology in Research and Industry.Front Physiol. 2021 Jan 13;11:607860. doi: 10.3389/fphys.2020.607860. eCollection 2020. Front Physiol. 2021. PMID: 33519514 Free PMC article. Review.
Cited by
-
Identification of candidate genes and chemicals associated with osteonecrosis of femoral head by multiomics studies and chemical-gene interaction analysis.Front Endocrinol (Lausanne). 2024 Aug 26;15:1419742. doi: 10.3389/fendo.2024.1419742. eCollection 2024. Front Endocrinol (Lausanne). 2024. PMID: 39253583 Free PMC article.
-
In Utero Caffeine Exposure Induces Transgenerational Effects on the Adult Heart.Sci Rep. 2016 Sep 28;6:34106. doi: 10.1038/srep34106. Sci Rep. 2016. PMID: 27677355 Free PMC article.
-
A Review of the Functional Roles of the Zebrafish Aryl Hydrocarbon Receptors.Toxicol Sci. 2020 Dec 1;178(2):215-238. doi: 10.1093/toxsci/kfaa143. Toxicol Sci. 2020. PMID: 32976604 Free PMC article. Review.
-
The role of DNA methylation on gene expression in the vertebrae of ancestrally benzo[a]pyrene exposed F1 and F3 male medaka.Epigenetics. 2023 Dec;18(1):2222246. doi: 10.1080/15592294.2023.2222246. Epigenetics. 2023. PMID: 37322851 Free PMC article.
-
Mechanistic Evaluation of Benzo[a]pyrene's Developmental Toxicities Mediated by Reduced Cyp19a1b Activity.Toxicol Sci. 2017 Jan;155(1):135-147. doi: 10.1093/toxsci/kfw182. Epub 2016 Sep 14. Toxicol Sci. 2017. PMID: 27633980 Free PMC article.
References
-
- Bolos V., Grego-Bessa J., de la Pompa J. L. (2007). Notch signaling in development and cancer. Endoc. Rev. 28, 339–363. - PubMed
Publication types
MeSH terms
Substances
Grants and funding
LinkOut - more resources
Full Text Sources
Other Literature Sources
Molecular Biology Databases
