. 2015 Jul 13;43(12):5716-29.
doi: 10.1093/nar/gkv532. Epub 2015 May 22.

Global transcription network incorporating distal regulator binding reveals selective cooperation of cancer drivers and risk genes

Affiliations

Global transcription network incorporating distal regulator binding reveals selective cooperation of cancer drivers and risk genes

Kwoneel Kim et al. Nucleic Acids Res. .

Abstract

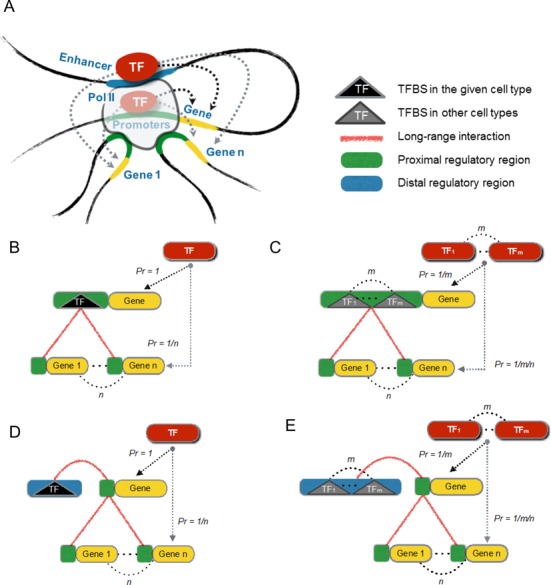
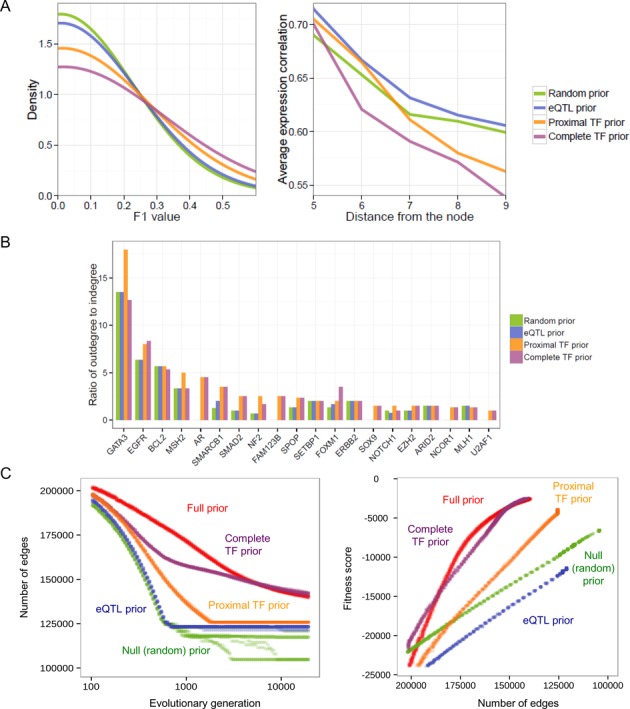
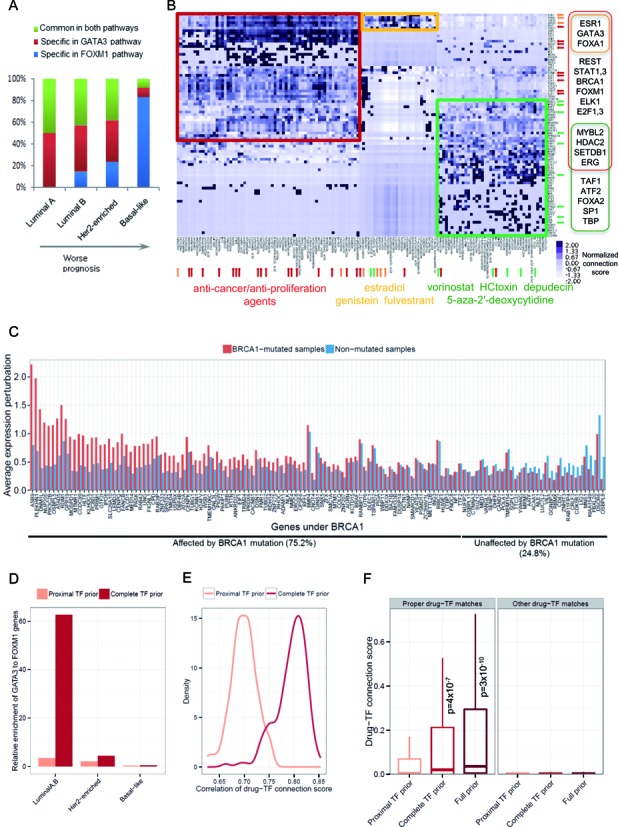
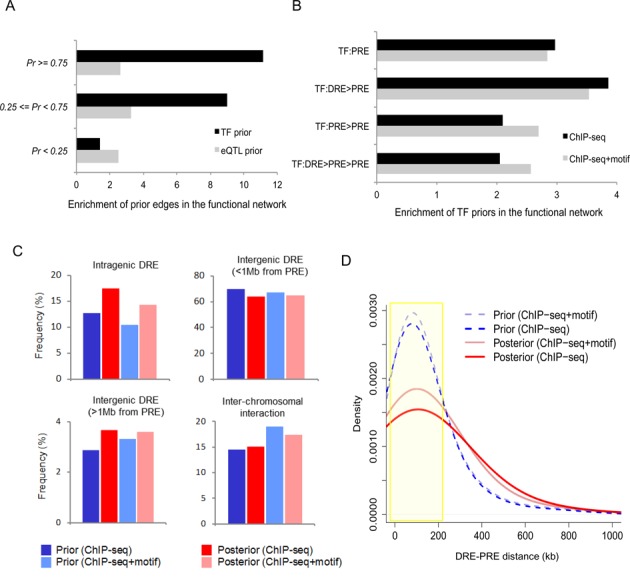
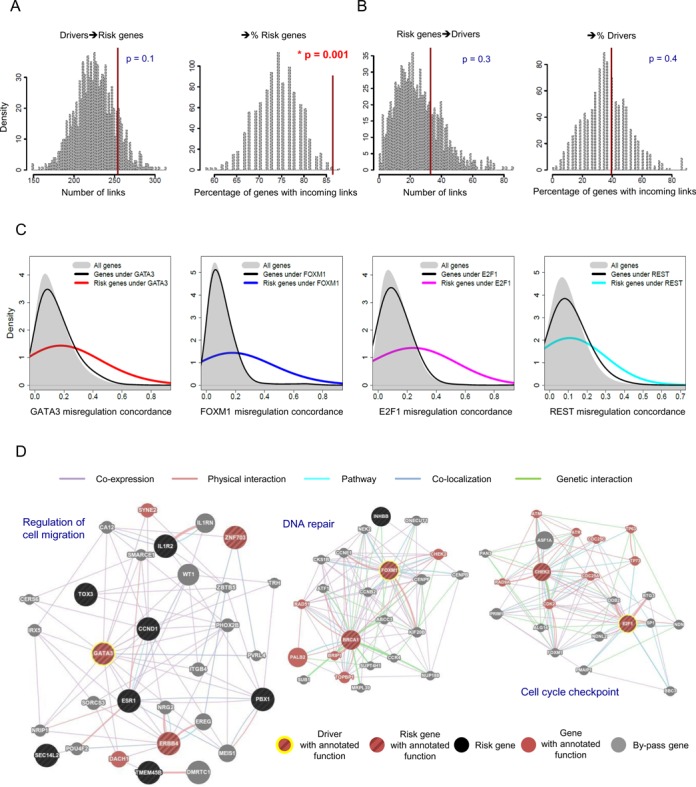
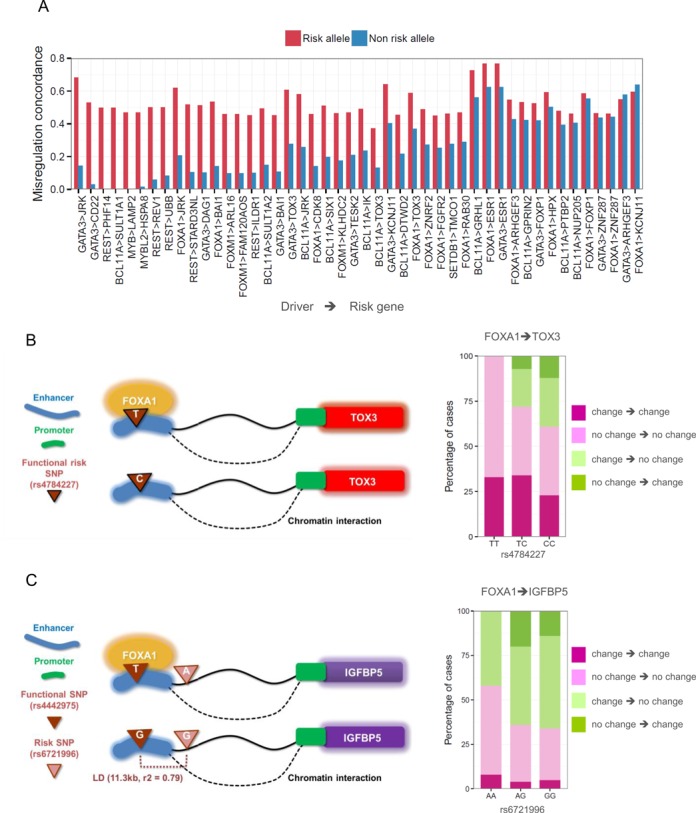
Global network modeling of distal regulatory interactions is essential in understanding the overall architecture of gene expression programs. Here, we developed a Bayesian probabilistic model and computational method for global causal network construction with breast cancer as a model. Whereas physical regulator binding was well supported by gene expression causality in general, distal elements in intragenic regions or loci distant from the target gene exhibited particularly strong functional effects. Modeling the action of long-range enhancers was critical in recovering true biological interactions with increased coverage and specificity overall and unraveling regulatory complexity underlying tumor subclasses and drug responses in particular. Transcriptional cancer drivers and risk genes were discovered based on the network analysis of somatic and genetic cancer-related DNA variants. Notably, we observed that the risk genes were functionally downstream of the cancer drivers and were selectively susceptible to network perturbation by tumorigenic changes in their upstream drivers. Furthermore, cancer risk alleles tended to increase the susceptibility of the transcription of their associated genes. These findings suggest that transcriptional cancer drivers selectively induce a combinatorial misregulation of downstream risk genes, and that genetic risk factors, mostly residing in distal regulatory regions, increase transcriptional susceptibility to upstream cancer-driving somatic changes.


Figures

Figure 1.
Figure 1.
Bayesian prior model based on physical TF binding and long-range chromatin looping. (A) Schematic view of possible regulator-target interactions. (B) Model for PRE binding observed in breast cancer cells. (C) Model for PRE binding observed in other cell types but within accessible chromatin in breast cancer. (D) Model for DRE binding observed in breast cancer cells. (E) Model for DRE binding observed in other cell types but within accessible chromatin in breast cancer. (B–E) TF binding was defined either as the peak of ChIP-seq tags or as the presence of cognate motifs within DHSs.
Figure 2.
Figure 2.
Quantitative prior evaluation. (A) Evaluation of four different test networks built on four different prior subsets. (Left) Distribution of the F1 scores for edges in a key breast cancer subnetwork as calculated by interrogating a manually curated and peer-reviewed pathway database. (Right) The average gene expression correlation of a node with other nodes at a varying network distance. (B) Ratio of the outdegree to indegree of TF nodes in the tested subnetworks. (C) Global network performance of four partial prior models. Convergence patterns were observed in 10 independent GA runs that used each prior subset by tracing the number of recovered edges according to the number of GA generations (left) and by tracing the fitness score according to the number of edges (right).
Figure 3.
Figure 3.
Tumor subclass and drug response analysis based on the global transcription network. (A) Frequency of subclass-specific genes present in the GATA3 or FOXM1 pathways. (B) Connectivity between small molecules (columns) and responsible TFs (rows) computed based on the mapping of transcription response signatures to the network. Unsupervised clustering was performed using the normalized connection scores, leading to three major clusters, a anti-cancer cluster (red), an epigenetic-drugs cluster (green) and an estrogen-receptor cluster (orange). (C) Expression perturbation of gene under BRCA1 in the global transcription network according to the mutation status of BRCA1 (D) Relative frequency of subclass-specific genes present in the GATA3 pathway as a ratio to the FOXM1 pathway in the two test networks based on the complete TF priors or proximal TF priors. (E) Correlations of the drug-TF connections scores between the full-scale full-prior network and the two test networks based on the complete or proximal TF priors. (F) Comparison of the connection scores for the selected proper drug-TF pairs (red, orange and green arrows in B) between the full-scale full-prior network and the two test networks based on the complete or proximal TF priors.
Figure 4.
Figure 4.
Characterization of distal regulatory interactions in the prior framework and functional network. (A) Recovery rate of the TF prior and eQTL prior interactions in the functional network according to their prior probability. (B) Recovery rate of the TF prior interactions in the functional network according to regulator binding mode. (C) Frequency of DRE–PRE interactions in the prior (physical) and posterior (functional) network according to their positioning. (D) Frequency of DRE–PRE distances in the prior (physical) and posterior (functional) network.
Figure 5.
Figure 5.
Functional connectivity between the transcriptional drivers and risk genes. (A) The statistical significance of the number of causal links directed from the driver to risk genes (left) and that of the percentage of the risk genes with incoming links (right) were determined based on 1000 random samplings of the same number of genes as the true risk genes. (B) The same statistical tests were performed for the number of causal links directed from risk to driver genes (left) and the percentage of the driver genes with incoming links (right). (C) Misregulation concordance between selected key transcriptional drivers (GATA3, FOXM1, E2F1 and REST from left to right) and all genes in the network (gray), downstream genes in the network (black) and downstream genes that are risk genes (red, blue, pink and cyan). (D) GeneMANIA functional association analysis of transcriptional drivers (GATA3, FOXM1 and E2F1 from left to right) and their downstream risk genes with high misregulation concordance. Gene nodes connected via co-expression, physical interaction, pathway, co-localization, and genetic interaction and shared enriched functions (q < 0.1) are displayed.
Figure 6.
Figure 6.
DNA variant-mediated transcriptional cooperation of cancer drivers with risk genes. (A) The patients the carry the previously reported risk alleles present higher misregulation concordance between the associated risk genes and their upstream drivers than those carrying the non-risk alleles. Shown are the cases in which the risk group exhibits significant concordance (P < 0.01). (B and C) Examples of the synergistic role of risk SNPs supported by experimental evidence. A higher fraction of concordant cases (dark and light pink) and a lower fraction of discordant cases (dark and light green) are observed with the risk allele than with the non-risk allele. (B) Higher concordance for the risk allele T than for the non-risk allele C at rs4784227 suggests that in patients carrying the risk allele, FOXA1 binding affinity increases and TOX3 misregulation is more specifically associated with the expression change of FOXA1 (49). (C) Higher concordance for the risk allele A at rs6721996 suggests that in patients carrying the risk allele, FOXA1 binding to the functional site harboring rs4442975 increases and IGFBP expression is more responsive to FOXA1 expression changes (50).

Similar articles

Cited by

References

    1. Arda H.E., Benitez C.M., Kim S.K. Gene regulatory networks governing pancreas development. Dev. Cell. 2013;25:5–13. - PMC - PubMed
    1. Yosef N., Shalek A.K., Gaublomme J.T., Jin H., Lee Y., Awasthi A., Wu C., Karwacz K., Xiao S., Jorgolli M., et al. Dynamic regulatory network controlling TH17 cell differentiation. Nature. 2013;496:461–468. - PMC - PubMed
    1. Zhang B., Gaiteri C., Bodea L.-G., Wang Z., McElwee J., Podtelezhnikov A.A., Zhang C., Xie T., Tran L., Dobrin R., et al. Integrated systems approach identifies genetic nodes and networks in late-onset Alzheimer's disease. Cell. 2013;153:707–720. - PMC - PubMed
    1. Ernst J., Kheradpour P., Mikkelsen T.S., Shoresh N., Ward L.D., Epstein C.B., Zhang X., Wang L., Issner R., Coyne M., et al. Mapping and analysis of chromatin state dynamics in nine human cell types. Nature. 2011;473:43–49. - PMC - PubMed
    1. Hnisz D., Abraham B.J., Lee T.I., Lau A., Saint-André V. Super-enhancers in the control of cell identity and disease. Cell. 2013;155:934–947. - PMC - PubMed

Publication types

Substances

LinkOut - more resources