

Live Cell Imaging with R-GECO1 Sheds Light on flg22- and Chitin-Induced Transient [Ca(2+)]cyt Patterns in Arabidopsis
- PMID: 26002145
- PMCID: PMC5134422
- DOI: 10.1016/j.molp.2015.05.006
Live Cell Imaging with R-GECO1 Sheds Light on flg22- and Chitin-Induced Transient [Ca(2+)]cyt Patterns in Arabidopsis
Abstract
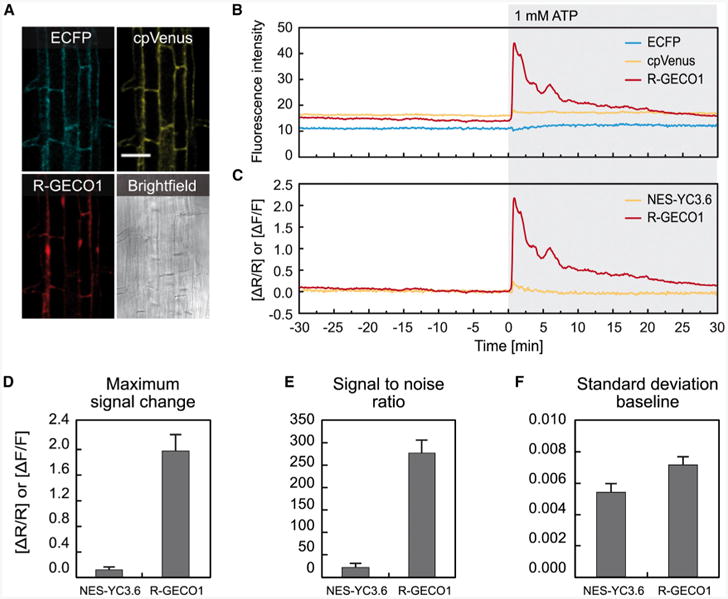
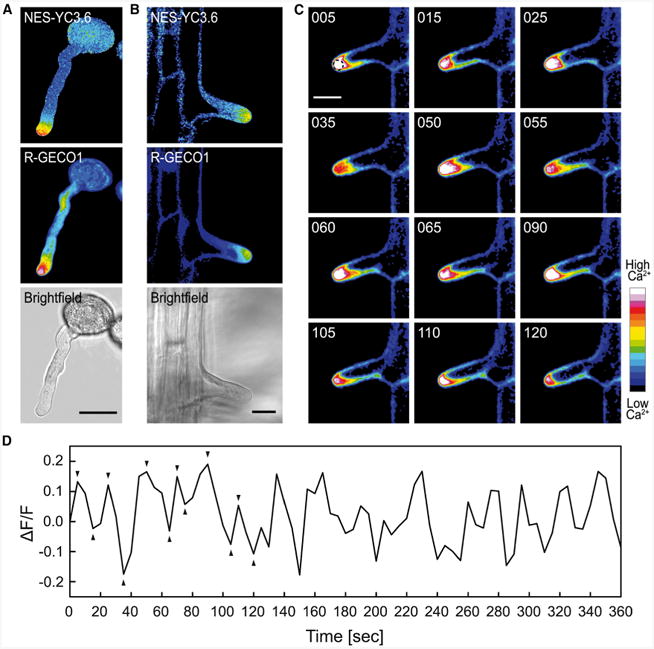
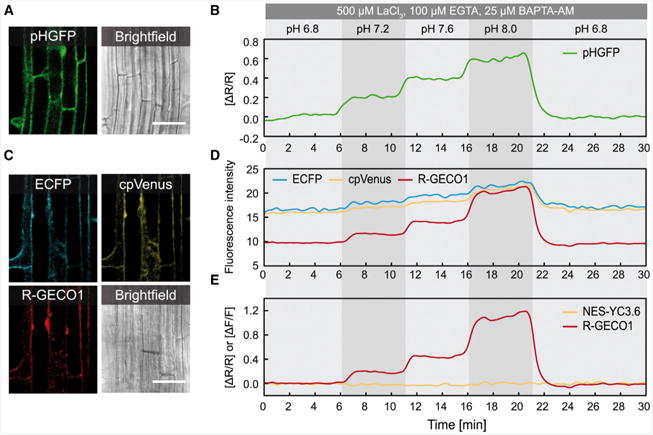
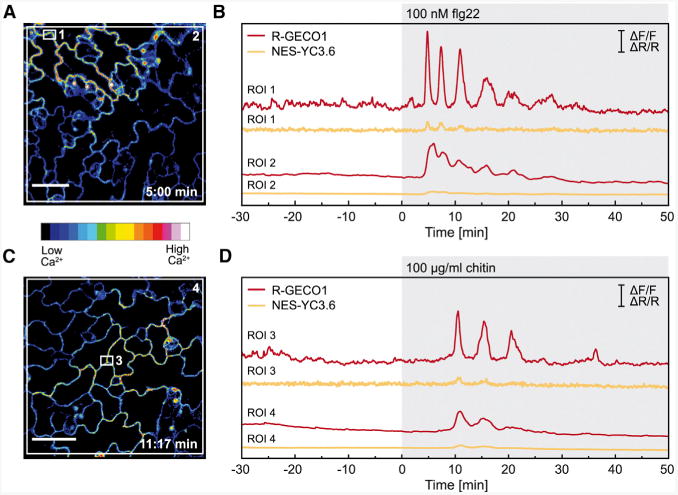
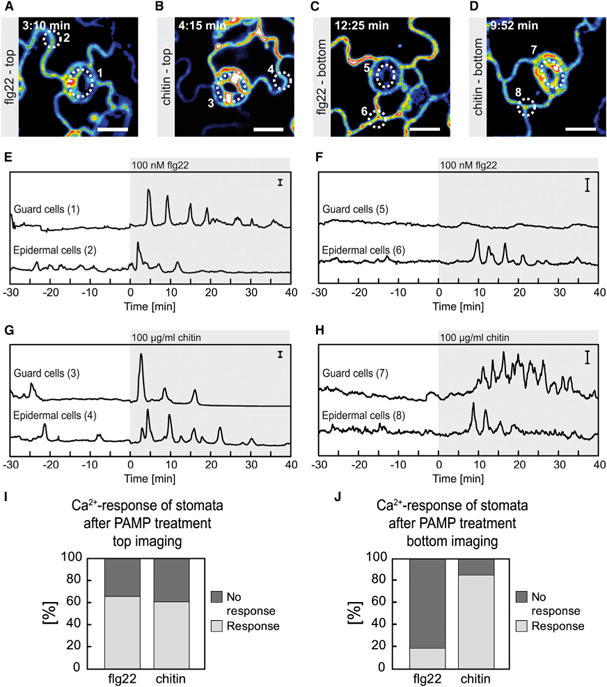
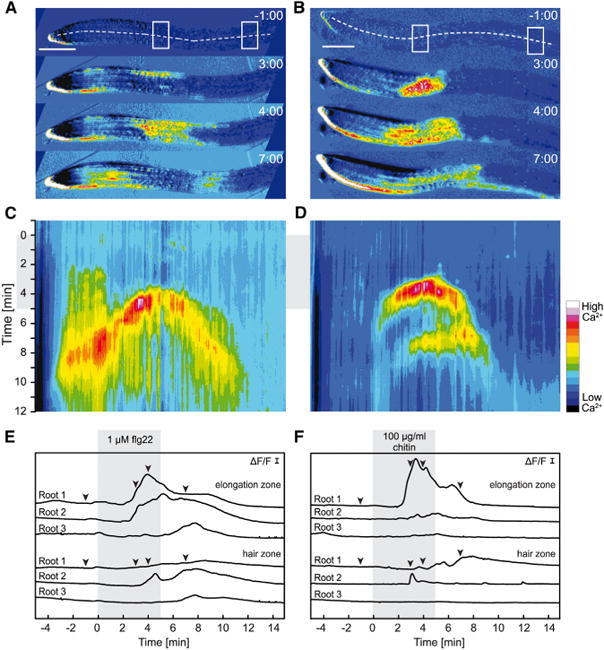
Intracellular Ca(2+) transients are an integral part of the signaling cascade during pathogen-associated molecular pattern (PAMP)-triggered immunity in plants. Yet, our knowledge about the spatial distribution of PAMP-induced Ca(2+) signals is limited. Investigation of cell- and tissue-specific properties of Ca(2+)-dependent signaling processes requires versatile Ca(2+) reporters that are able to extract spatial information from cellular and subcellular structures, as well as from whole tissues over time periods from seconds to hours. Fluorescence-based reporters cover both a broad spatial and temporal range, which makes them ideally suited to study Ca(2+) signaling in living cells. In this study, we compared two fluorescence-based Ca(2+) sensors: the Förster resonance energy transfer (FRET)-based reporter yellow cameleon NES-YC3.6 and the intensity-based sensor R-GECO1. We demonstrate that R-GECO1 exhibits a significantly increased signal change compared with ratiometric NES-YC3.6 in response to several stimuli. Due to its superior sensitivity, R-GECO1 is able to report flg22- and chitin-induced Ca(2+) signals on a cellular scale, which allowed identification of defined [Ca(2+)]cyt oscillations in epidermal and guard cells in response to the fungal elicitor chitin. Moreover, we discovered that flg22- and chitin-induced Ca(2+) signals in the root initiate from the elongation zone.
Keywords: Arabidopsis; R-GECO1; calcium imaging; chitin; flg22; sensor.
Copyright © 2015 The Author. Published by Elsevier Inc. All rights reserved.
Conflict of interest statement
No conflict of interest declared.
Figures
Similar articles
-
Cameleon calcium indicator reports cytoplasmic calcium dynamics in Arabidopsis guard cells.Plant J. 1999 Sep;19(6):735-47. doi: 10.1046/j.1365-313x.1999.00574.x. Plant J. 1999. PMID: 10571859
-
Convergence of calcium signaling pathways of pathogenic elicitors and abscisic acid in Arabidopsis guard cells.Plant Physiol. 2002 Dec;130(4):2152-63. doi: 10.1104/pp.012187. Plant Physiol. 2002. PMID: 12481099 Free PMC article.
-
Cytosolic calcium signals elicited by the pathogen-associated molecular pattern flg22 in stomatal guard cells are of an oscillatory nature.New Phytol. 2014 Dec;204(4):873-81. doi: 10.1111/nph.13064. Epub 2014 Sep 22. New Phytol. 2014. PMID: 25243759
-
Plant calcium signaling and monitoring: pros and cons and recent experimental approaches.Protoplasma. 2001;218(1-2):1-23. doi: 10.1007/BF01288356. Protoplasma. 2001. PMID: 11732314 Review.
-
Visualizing Ca(2+) signatures in plants.Curr Opin Plant Biol. 2012 Dec;15(6):677-82. doi: 10.1016/j.pbi.2012.09.014. Epub 2012 Oct 5. Curr Opin Plant Biol. 2012. PMID: 23044039 Review.
Cited by
-
A Single-Nucleotide Mutation in a GLUTAMATE RECEPTOR-LIKE Gene Confers Resistance to Fusarium Wilt in Gossypium hirsutum.Adv Sci (Weinh). 2021 Feb 19;8(7):2002723. doi: 10.1002/advs.202002723. eCollection 2021 Apr. Adv Sci (Weinh). 2021. PMID: 33854882 Free PMC article.
-
Dual-Reporting Transcriptionally Linked Genetically Encoded Fluorescent Indicators Resolve the Spatiotemporal Coordination of Cytosolic Abscisic Acid and Second Messenger Dynamics in Arabidopsis.Plant Cell. 2020 Aug;32(8):2582-2601. doi: 10.1105/tpc.19.00892. Epub 2020 May 29. Plant Cell. 2020. PMID: 32471862 Free PMC article.
-
Calcium Signalling in Plant Biotic Interactions.Int J Mol Sci. 2018 Feb 27;19(3):665. doi: 10.3390/ijms19030665. Int J Mol Sci. 2018. PMID: 29495448 Free PMC article. Review.
-
ATP sensing in living plant cells reveals tissue gradients and stress dynamics of energy physiology.Elife. 2017 Jul 18;6:e26770. doi: 10.7554/eLife.26770. Elife. 2017. PMID: 28716182 Free PMC article.
-
ROS Regulation of Polar Growth in Plant Cells.Plant Physiol. 2016 Jul;171(3):1593-605. doi: 10.1104/pp.16.00191. Epub 2016 May 4. Plant Physiol. 2016. PMID: 27208283 Free PMC article. Review.
References
-
- Allen GJ, Chu SP, Schumacher K, Shimazaki CT, Vafeados D, Kemper A, Hawke SD, Tallman G, Tsien RY, Harper JF, et al. Alteration of stimulus-specific guard cell calcium oscillations and stomatal closing in Arabidopsis det3 mutant. Science. 2000;289:2338–2342. - PubMed
Publication types
MeSH terms
Substances
Grants and funding
LinkOut - more resources
Full Text Sources
Other Literature Sources
Research Materials
Miscellaneous
