

Effect of vitamin E supplementation on HDL function by haptoglobin genotype in type 1 diabetes: results from the HapE randomized crossover pilot trial
- PMID: 26002590
- PMCID: PMC4826317
- DOI: 10.1007/s00592-015-0770-8
Effect of vitamin E supplementation on HDL function by haptoglobin genotype in type 1 diabetes: results from the HapE randomized crossover pilot trial
Abstract
Aims: Haptoglobin (Hp) genotype 2-2 increases cardiovascular diabetes complications. In type 2 diabetes, α-tocopherol was shown to lower cardiovascular risk in Hp 2-2, potentially through HDL function improvements. Similar type 1 diabetes data are lacking. We conducted a randomized crossover pilot of α-tocopherol supplementation on HDL function [i.e., cholesterol efflux (CE) and HDL-associated lipid peroxides (LP)] and lipoprotein subfractions in type 1 diabetes.
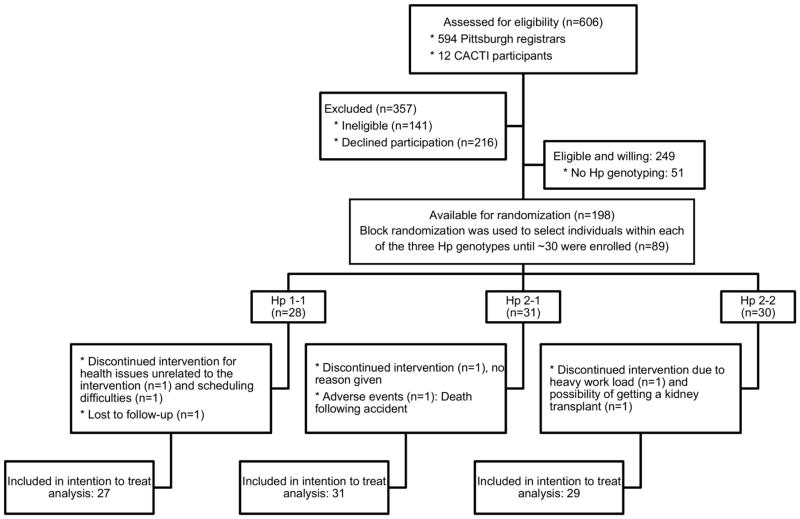
Methods: Hp genotype was assessed in members of two Allegheny County, PA, type 1 diabetes registries and the CACTI cohort; 30 were randomly selected within Hp genotype, and 28 Hp 1-1, 31 Hp 2-1 and 30 Hp 2-2 were allocated to daily α-tocopherol or placebo for 8 weeks with a 4-week washout.
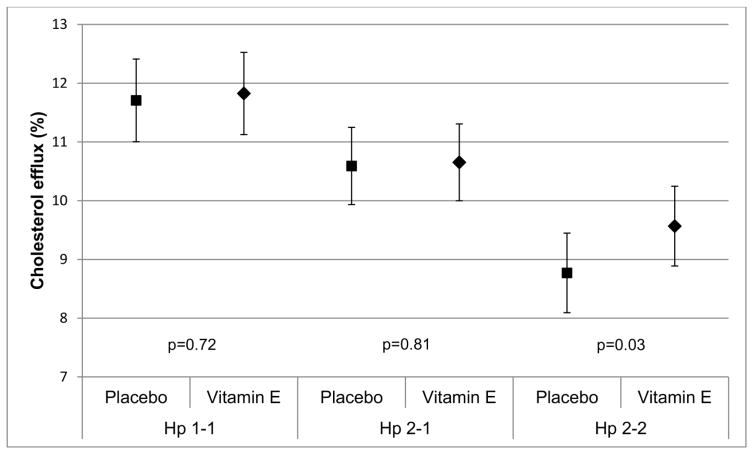
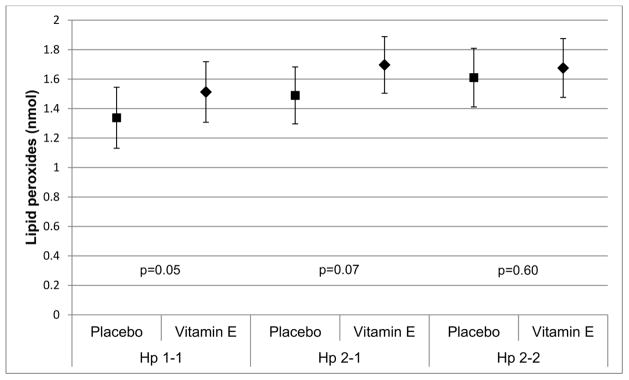
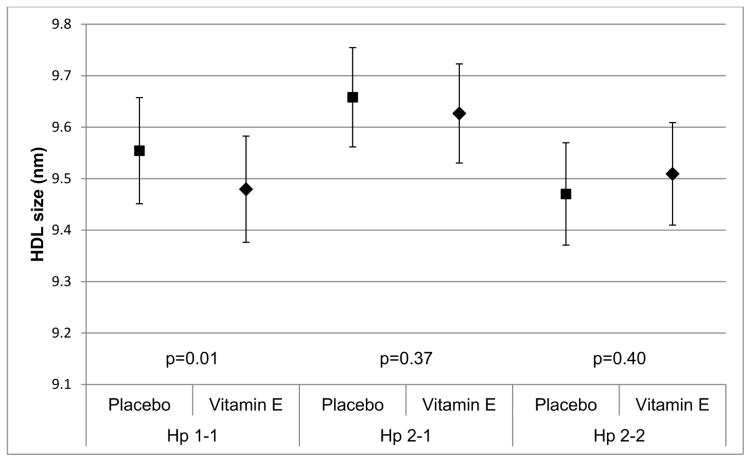
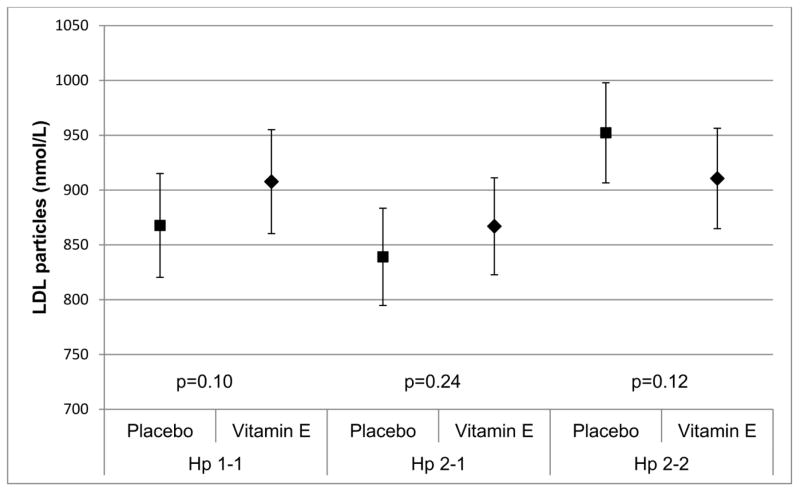
Results: Baseline CE decreased with the number of Hp 2 alleles (p-trend = 0.003). There were no differences in LP or lipoprotein subfractions. In intention-to-treat analysis stratified by Hp, α-tocopherol increased CE in Hp 2-2 (β = 0.79, p = 0.03) and LP in Hp 1 allele carriers (β Hp 1-1 = 0.18, p = 0.05; β Hp 2-1 = 0.21, p = 0.07); reduced HDL particle size (β = -0.07, p = 0.03) in Hp 1-1 carriers; increased LDL particle concentration in Hp 1-1; and decreased it in Hp 2-2 carriers. However, no significant interactions were observed by Hp.
Conclusions: In this type 1 diabetes study, HDL function worsened with the number of Hp 2 alleles. α-Tocopherol improved HDL function in Hp 2-2 carriers and appeared to adversely affect lipid peroxides and lipoprotein subfractions among Hp 1 allele carriers. As no significant interactions were observed, findings require replication in larger studies.
Keywords: Double-blinded placebo-controlled randomized trial; HDL function; Haptoglobin genotype; NMR lipoprotein subfractions; Type 1 diabetes; Vitamin E.
Conflict of interest statement
A.P.L. is the author of patents owned by his institution which claim that the Hp genotype is predictive of diabetic CVD and that antioxidant therapy may be able to reduce this risk. No other author has any competing interests in the manuscript.
Figures
Similar articles
-
Impact of Vitamin E supplementation on vascular function in haptoglobin genotype stratified diabetes patients (EVAS Trial): a randomised controlled trial.Nutr Diabetes. 2020 Apr 27;10(1):13. doi: 10.1038/s41387-020-0116-7. Nutr Diabetes. 2020. PMID: 32341356 Free PMC article. Clinical Trial.
-
Impact of Vitamin E Supplementation on High-Density Lipoprotein in Patients With Haptoglobin Genotype-Stratified Diabetes: A Systematic Review of Randomized Controlled Trials.J Diabetes Res. 2024 Oct 21;2024:6645595. doi: 10.1155/2024/6645595. eCollection 2024. J Diabetes Res. 2024. PMID: 39474248 Free PMC article.
-
Correction of HDL dysfunction in individuals with diabetes and the haptoglobin 2-2 genotype.Diabetes. 2008 Oct;57(10):2794-800. doi: 10.2337/db08-0450. Epub 2008 Jul 3. Diabetes. 2008. PMID: 18599520 Free PMC article. Clinical Trial.
-
Divergent effects of alpha-tocopherol and vitamin C on the generation of dysfunctional HDL associated with diabetes and the Hp 2-2 genotype.Antioxid Redox Signal. 2010 Feb;12(2):209-17. doi: 10.1089/ars.2009.2829. Antioxid Redox Signal. 2010. PMID: 19769483 Free PMC article.
-
Interaction Between the Haptoglobin Genotype and Vitamin E on Cardiovascular Disease in Diabetes.Curr Diab Rep. 2017 Jun;17(6):42. doi: 10.1007/s11892-017-0868-1. Curr Diab Rep. 2017. PMID: 28451949 Review.
Cited by
-
Haptoglobin phenotype and intensive glycemic control for coronary artery disease risk reduction in people with type two diabetes: The Veterans Affairs Diabetes Trial.Am J Prev Cardiol. 2024 May 9;18:100681. doi: 10.1016/j.ajpc.2024.100681. eCollection 2024 Jun. Am J Prev Cardiol. 2024. PMID: 38800835 Free PMC article.
-
Link of dietary patterns with metabolic syndrome: analysis of the National Health and Nutrition Examination Survey.Nutr Diabetes. 2017 Mar 20;7(3):e255. doi: 10.1038/nutd.2017.11. Nutr Diabetes. 2017. PMID: 28319105 Free PMC article.
-
Effects of dietary supplementation in treatment and control of progression and complications of insulin-dependent diabetes mellitus: a systematic review with meta-analyses of randomized clinical trials.Braz J Med Biol Res. 2024 Aug 23;57:e13649. doi: 10.1590/1414-431X2024e13649. eCollection 2024. Braz J Med Biol Res. 2024. PMID: 39194033 Free PMC article.
-
Intensive lifestyle intervention in type 2 diabetes and risk of incident coronary artery disease for the common haptoglobin phenotypes: the Look AHEAD study.Cardiovasc Diabetol. 2024 Feb 24;23(1):82. doi: 10.1186/s12933-024-02164-8. Cardiovasc Diabetol. 2024. PMID: 38402400 Free PMC article.
-
Nutrient Patterns and Its Association and Metabolic Syndrome among Chinese Children and Adolescents Aged 7-17.Nutrients. 2022 Dec 27;15(1):117. doi: 10.3390/nu15010117. Nutrients. 2022. PMID: 36615775 Free PMC article.
References
-
- Oberley LW. Free radicals and diabetes. Free Radic Biol Med. 1988;5:113–124. - PubMed
-
- Baynes JW, Thorpe SR. The role of oxidative stress in diabetic complications. Current Opinion in Endocrinology. 1996;3:277–284.
-
- Baynes JW, Thorpe SR. Role of oxidative stress in diabetic complications. A new perspective on an old paradigm. Diabetes. 1999;48:1–9. - PubMed
-
- Vivekananthan DP, Penn MS, Sapp SK, Hsu A, Topol EJ. Use of antioxidant vitamins for the prevention of cardiovascular disease: meta-analysis of randomised trials. Lancet. 2003;361(9374):2017–2023. - PubMed
Publication types
MeSH terms
Substances
Grants and funding
LinkOut - more resources
Full Text Sources
Other Literature Sources
Medical
Research Materials
Miscellaneous
