. 2015 Sep:327:78-88.
doi: 10.1016/j.heares.2015.04.014. Epub 2015 May 19.

Cochlear neuropathy in human presbycusis: Confocal analysis of hidden hearing loss in post-mortem tissue

Affiliations

Cochlear neuropathy in human presbycusis: Confocal analysis of hidden hearing loss in post-mortem tissue

Lucas M Viana et al. Hear Res. 2015 Sep.

Abstract

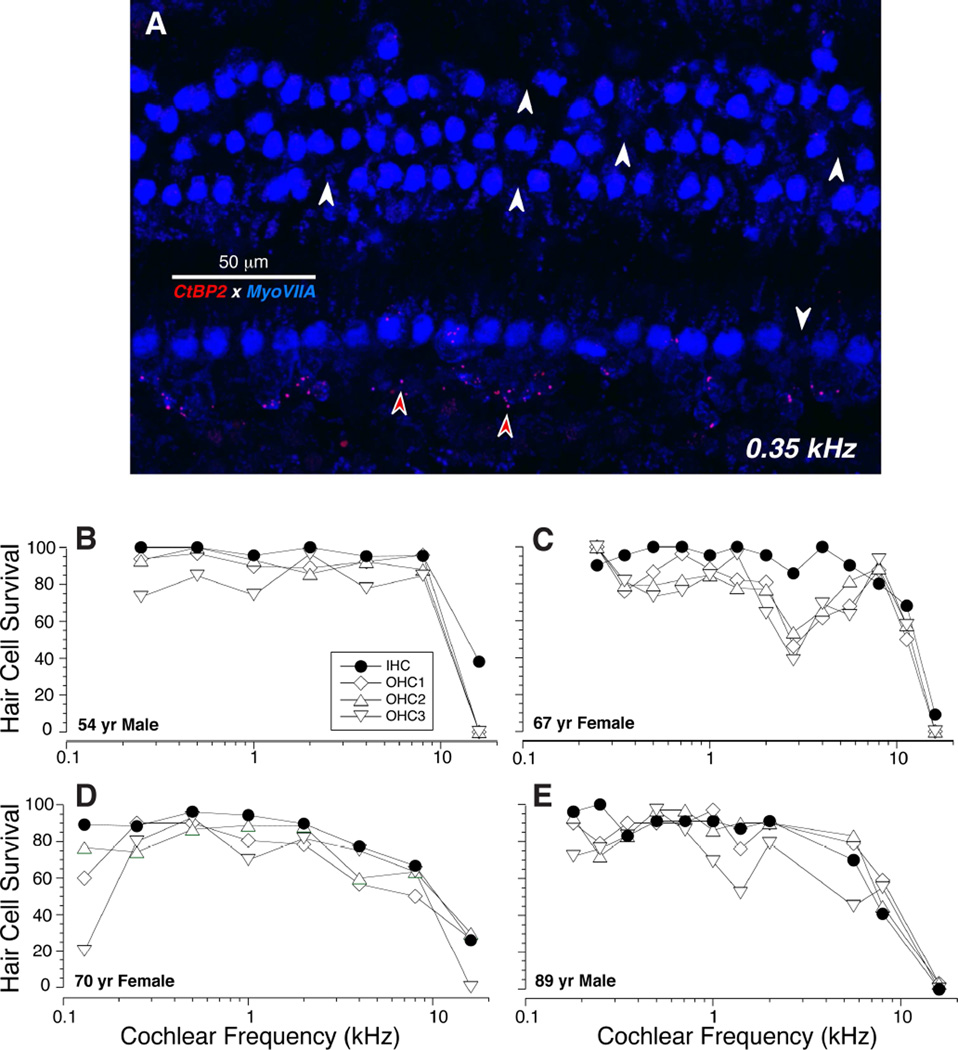
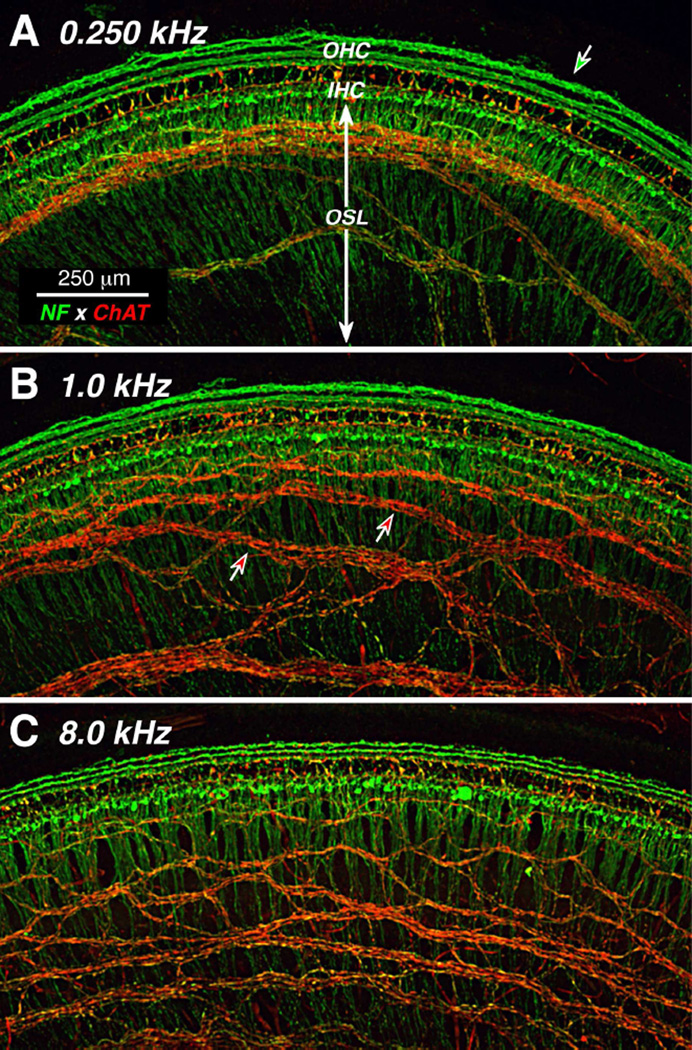
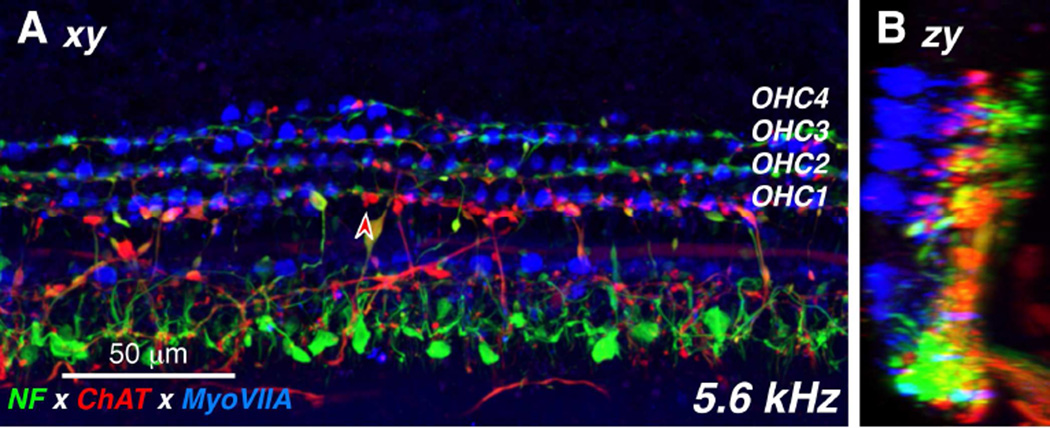
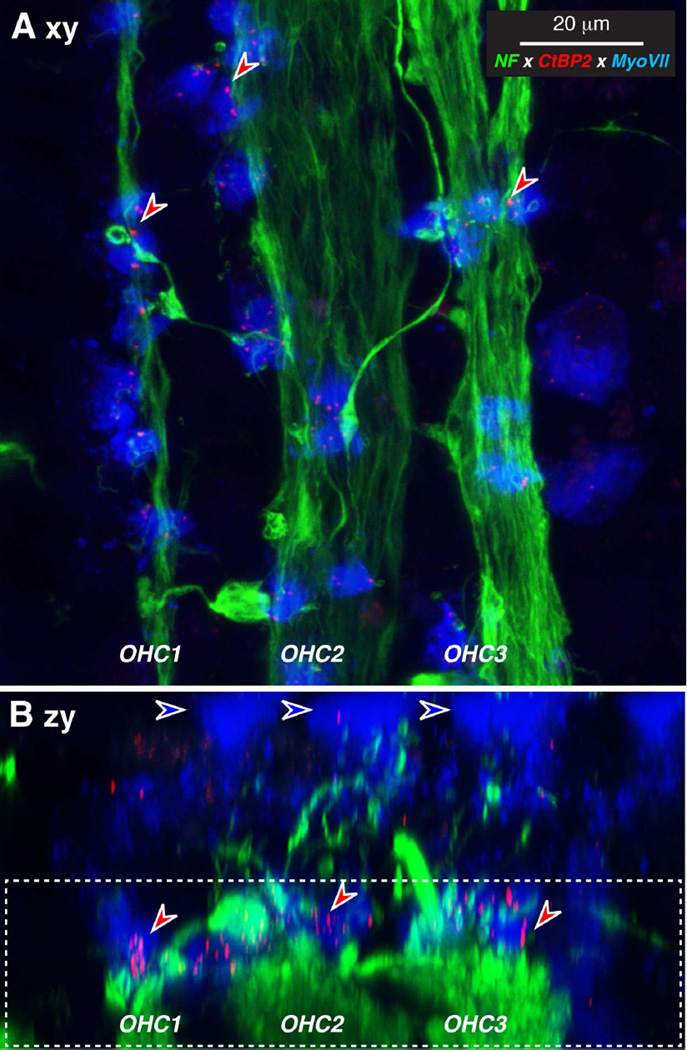
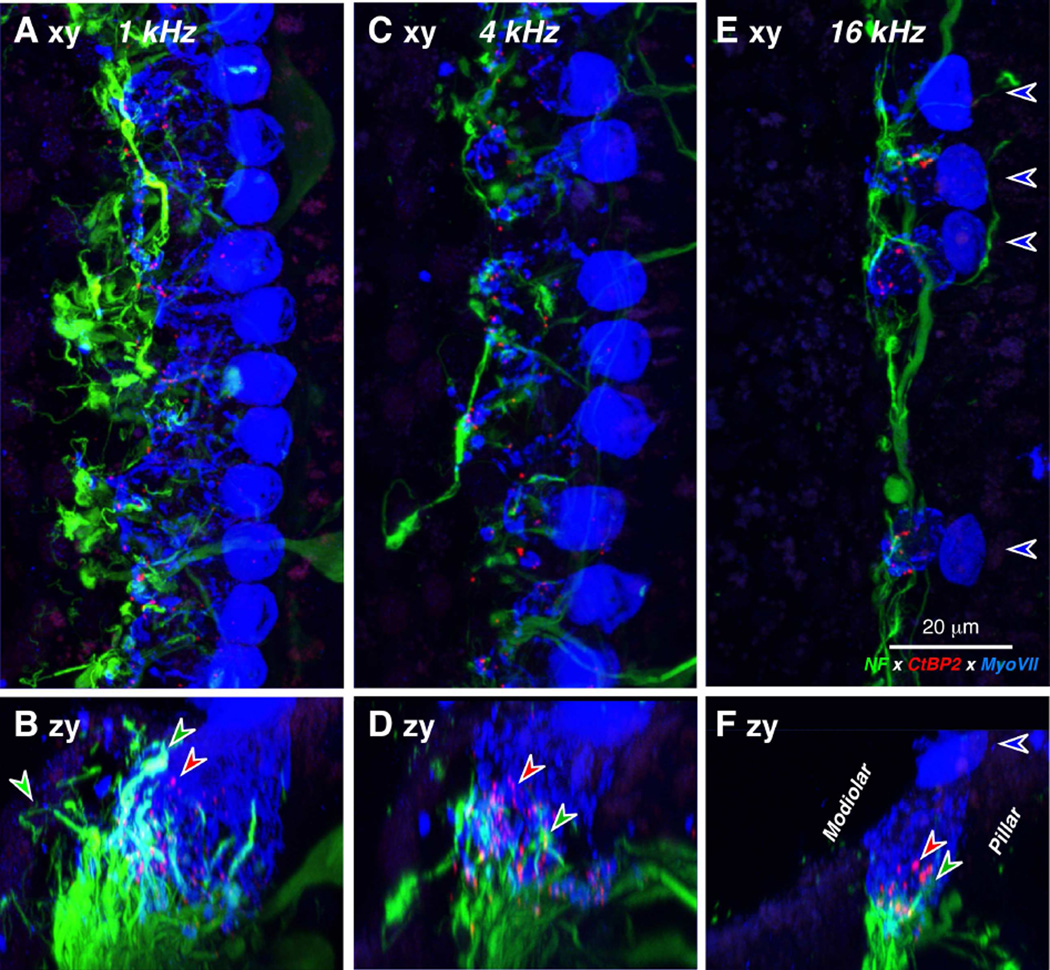
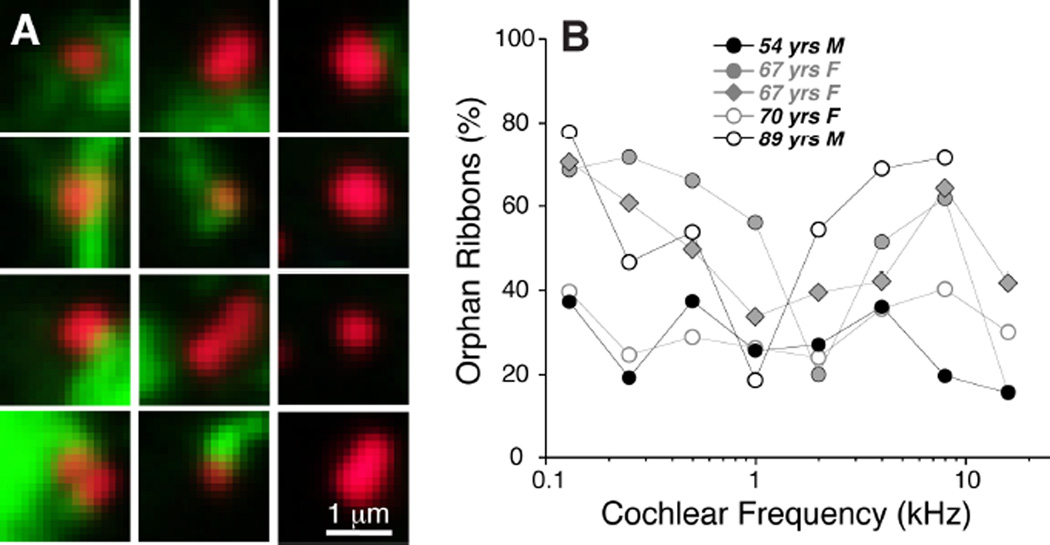
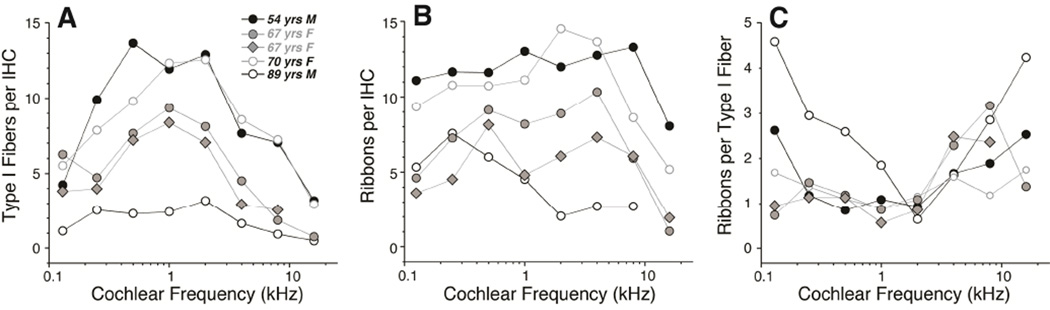
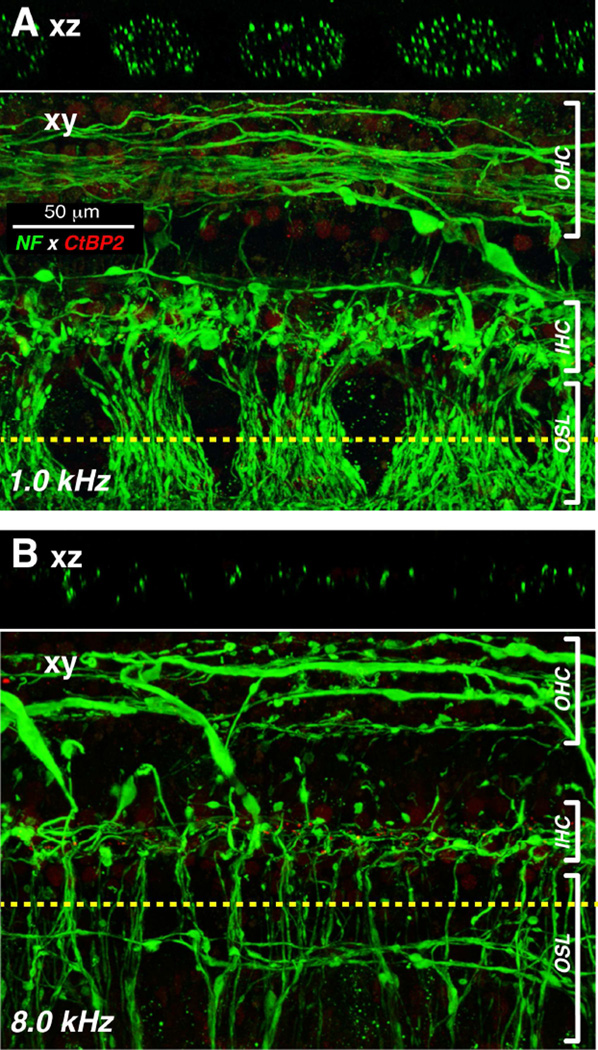
Recent animal work has suggested that cochlear synapses are more vulnerable than hair cells in both noise-induced and age-related hearing loss. This synaptopathy is invisible in conventional histopathological analysis, because cochlear nerve cell bodies in the spiral ganglion survive for years, and synaptic analysis requires special immunostaining or serial-section electron microscopy. Here, we show that the same quadruple-immunostaining protocols that allow synaptic counts, hair cell counts, neuronal counts and differentiation of afferent and efferent fibers in mouse can be applied to human temporal bones, when harvested within 9 h post-mortem and prepared as dissected whole mounts of the sensory epithelium and osseous spiral lamina. Quantitative analysis of five "normal" ears, aged 54-89 yrs, without any history of otologic disease, suggests that cochlear synaptopathy and the degeneration of cochlear nerve peripheral axons, despite a near-normal hair cell population, may be an important component of human presbycusis. Although primary cochlear nerve degeneration is not expected to affect audiometric thresholds, it may be key to problems with hearing in noise that are characteristic of declining hearing abilities in the aging ear.


Figures

Figure 1
Figure 1
Cytocochleograms show the limited hair cell loss in the temporal bones studied in this report. A: Maximum projection of a confocal z-stack from the 0.35 kHz region in an 89 yr old male, double-immunostained for a hair cell marker (myosin VIIa - blue) and a synaptic ribbon marker (CtBP2 – red). White arrows indicate the locations of some of the missing hair cells. Red arrows indicate some the pre-synaptic ribbons in the inner hair cell area. B-E: Cytocochleograms from four human cases computed from images like that in A.
Figure 2
Figure 2
Double-immunostaining for a general neuronal marker (neurofilament - green) and a cholinergic neuronal marker (choline acetyltransferase [ChAT] - red) distinguishes afferent and efferent fibers. Two types of afferents (green), radial fibers and three rows of outer spiral fibers, are seen in inner and outer hair cell areas, respectively. Cholinergic efferents of the olivocochlear bundle are immunostained by anti-ChAT (red). Images are all from a 54 yr old male. Each is a maximum projection of a confocal z-stack from a different cochlear region, as indicated. Green-filled arrow in A points to an anomalous fiber spiraling among the Hensen cells; green-filled arrow in B points to the outermost row of outer spiral fibers; red-filled arrows in C point to fascicles of spiraling efferent fibers. Scale in A applies to all panels.
Figure 3
Figure 3
The distribution of cholinergic efferent terminals under the inner and outer hair cells is seen in these high-power views of the organ of Corti, triple-immunostained for a general neuronal marker (neurofilament – green), a cholinergic neuronal marker (choline acetyltransferase – red) and a hair cell marker (myosin VIIa – blue). The image in A is a maximum projection from confocal z-stack through the 5.6 kHz region of a 54 yr old male. The image in B is a zy re-projection of the same z-stack. The red-filled arrowhead in A points to one ChAT-positive efferent terminal on a first-row outer hair cell.
Figure 4
Figure 4
OHC synaptic ribbons can be seen after immunostaining for a ribbon protein (CtBP2 – red), a neuronal marker (neurofilament – green) and a hair cell marker (myosin VIIa – blue). A: Maximum projection of a confocal z-stack from the 1.0 kHz region of a 70 yr old female, displayed in the acquisition plane (xy). B: Re-projection in the zy plane shows that the ribbons (e.g. at the red arrows) are within the basal ends of the OHCs. Blue-fill arrows indicate the cuticular plates. Dashed box in B indicates the portion of the z-stack projected in A. Scale bar in A applies to both panels.
Figure 5
Figure 5
IHC synaptic ribbons can be seen after immunostaining as in Figure 4. A,C,E: Maximum projections of confocal z-stacks from the 1.0, 4.0 and 16.0 kHz regions, respectively of a 67 yr old female, displayed in the acquisition plane (xy). Blue-fill arrows indicate the cuticular plates of 4 remaining IHCs and point away from the OHCs. B,D,F: The same three z-stacks re-projected in the zy plane, to show that the ribbons (e.g. at the red arrows) are within the basal ends of the IHCs, where the cochlear nerve fibers terminate (e.g. green arrows). Scale bar in E applies to all panels.
Figure 6
Figure 6
Analysis of orphan ribbons in the IHC area. A: Thumbnail re-projections of the voxel space immediately surrounding 12 selected synaptic ribbons from the z-stack shown in Fig. 5A. Some ribbons are clearly juxtaposed to nerve terminals (left two columns) while others are not (right column). Only the red (anti-CtBP2) and green (anti-neurofilament) channels are shown for clarity. B: Percentage of orphan ribbons, i.e. those not closely juxtaposed to post-synaptic terminals, as assessed by evaluating thumbnail arrays such as those illustrated in A, for each of the five completely reconstructed ears in the present study.
Figure 7
Figure 7
Quantification of synaptic and neural elements in the five reconstructed cases from the present study suggests age-related synaptopathy in the IHC area. A: Counts of the peripheral axons of type-I cochlear nerve fibers as a function of cochlear location. Data are extracted from xz slices through the OSL as illustrated in Figure 8 and described further in Methods. B: Counts of synaptic ribbons per IHC as a function of cochlear location. Data are extracted from confocal z-stacks like those shown in Figure 5 and described further in Methods C: Counts of ribbons per type-I axon are computed by dividing the data in B by the data in A.
Figure 8
Figure 8
Basal-turn degeneration of cochlear nerve peripheral axons is seen in confocal image stacks through the osseous spiral lamina and organ of Corti from the 1 and 8 kHz region of a 67 yr-old female. A-B: Each pair of images shows, at a different cochlear location, the maximum projection (xy) of a confocal z-stack immunostained for neurofilament (green), along with an orthogonal “slice” through the image stack (xz plane) at the position indicated by the dashed yellow line.
Figure 9
Figure 9
The ratio of afferent to efferent fibers in the osseous spiral lamina (OSL) can be estimated by comparing the total axonal counts (neurofilament, green) to counts of cholinergic axons (choline acetyltransferase, red). A: Maximum projection of a z-stack through the osseous spiral lamina (OSL) in the 0.5 kHz region of a 54 yr old male. Dashed line indicates the position of the re-projected “slice” shown in B. Green arrow shows one fascicle entering the habenula. Red arrow shows one efferent fiber near the habenula. B: Digital slice through the z-stack at the position indicated by the dashed line in A. Red arrows show two efferent fibers among the numerous afferent (ChAT-negative) fibers. C: Percentage of OSL axons that are ChAT-positive, and therefore from the olivocochlear bundle (OCB). Data are from the two cases with the OSL axonal counts. Ensemble average (13%) is for all frequency regions from both cases.
Figure 10
Figure 10
Comparisons between present data and prior human studies of spiral ganglion counts (A) or peripheral axon and synaptic counts (B). A: Peripheral axon counts (from Fig. 7A) are used to estimate the total number of type-I ganglion cells in each of the five cases (see text for further explanation) and then compared to counts of spiral ganglion cells in an age-graded series of temporal bones from a previous study [pink, (Makary et al., 2011)]. B: Counts of type-I peripheral axons (from Fig. 7A) are compared to similar counts from a prior light-microscopic study [red, (Spoendlin et al., 1990)], and to counts of terminals per IHC from an electron microscopic study of a 64 yr old male [blue, (Nadol, 1988a)]. The peripheral axon counts from a prior study are averages of two ears from a 7-yr old, extracted from their Figure 6 (Spoendlin and Schrott, 1990) and then converted from fibers/mm to fibers/IHC using a mean value of 10.6 mm on-center spacing for IHCs extracted from confocal images such as those in Figure 1A. Symbol key applies to both panels.

References

    1. Bahmad F, Jr, Merchant SN, Nadol JB, Jr, Tranebjaerg L. Otopathology in Mohr-Tranebjaerg syndrome. Laryngoscope. 2007;117:1202–1208. - PMC - PubMed
    1. Berglund AM, Ryugo DK. Neurofilament antibodies and spiral ganglion neurons of the mammalian cochlea. J Comp Neurol. 1991;306:393–408. - PubMed
    1. Bhatt KA, Liberman MC, Nadol JB., Jr Morphometric analysis of age-related changes in the human basilar membrane. Ann Otol Rhinol Laryngol. 2001;110:1147–1153. - PubMed
    1. Bohne BA, Harding GW. Degeneration in the cochlea after noise damage: primary versus secondary events. Am J Otol. 2000;21:505–509. - PubMed
    1. Brown MC. Morphology of labeled afferent fibers in the guinea pig cochlea. J Comp Neurol. 1987;260:591–604. - PubMed

Publication types

MeSH terms