

Horsetails Are Ancient Polyploids: Evidence from Equisetum giganteum
- PMID: 26002871
- PMCID: PMC4498207
- DOI: 10.1105/tpc.15.00157
Horsetails Are Ancient Polyploids: Evidence from Equisetum giganteum
Abstract
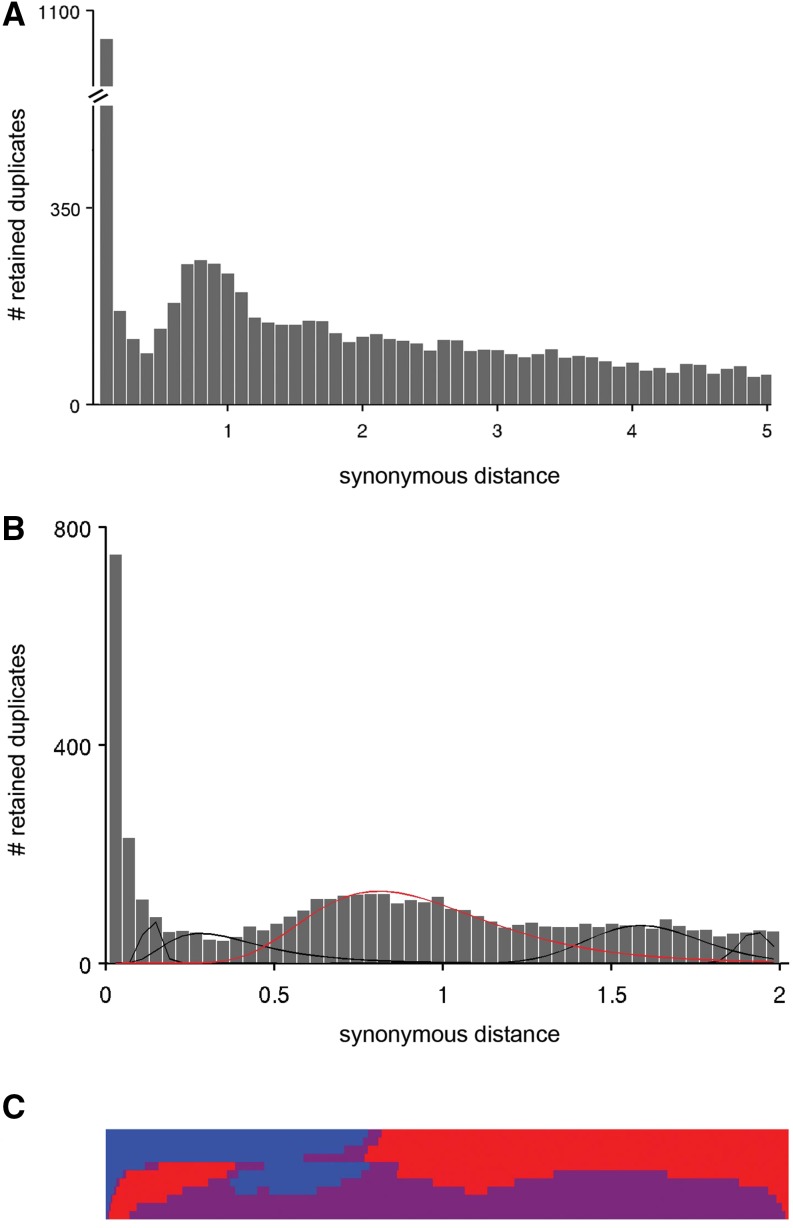
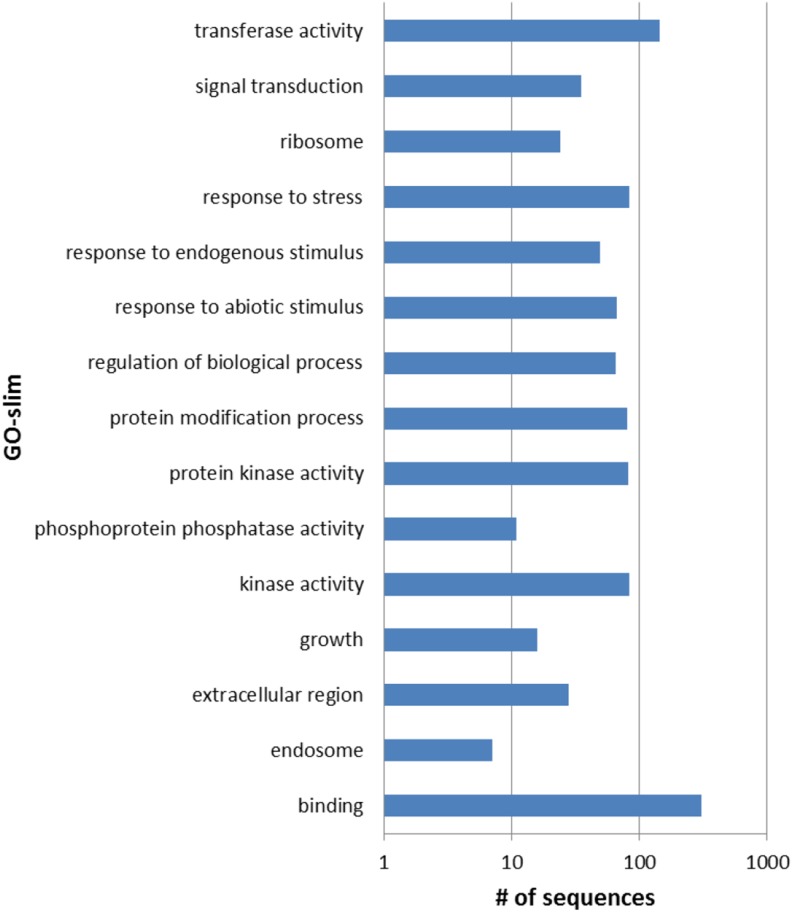
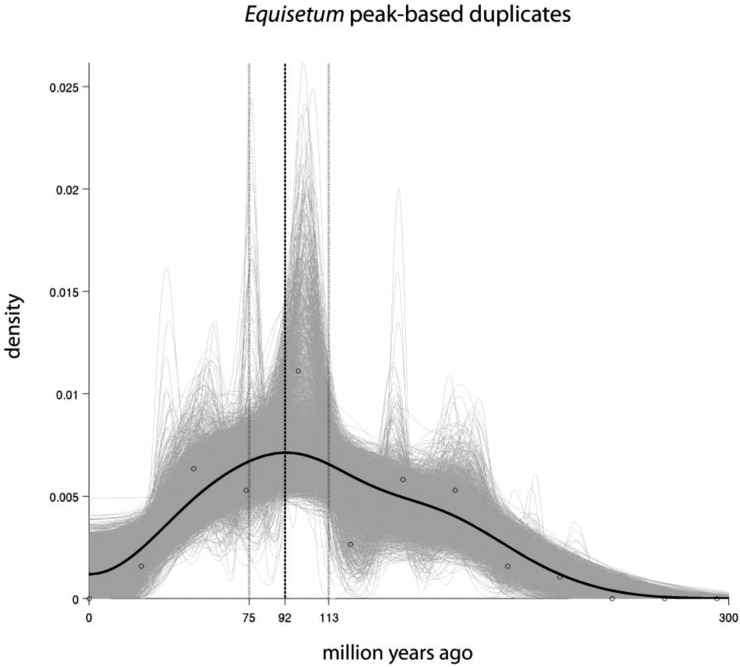
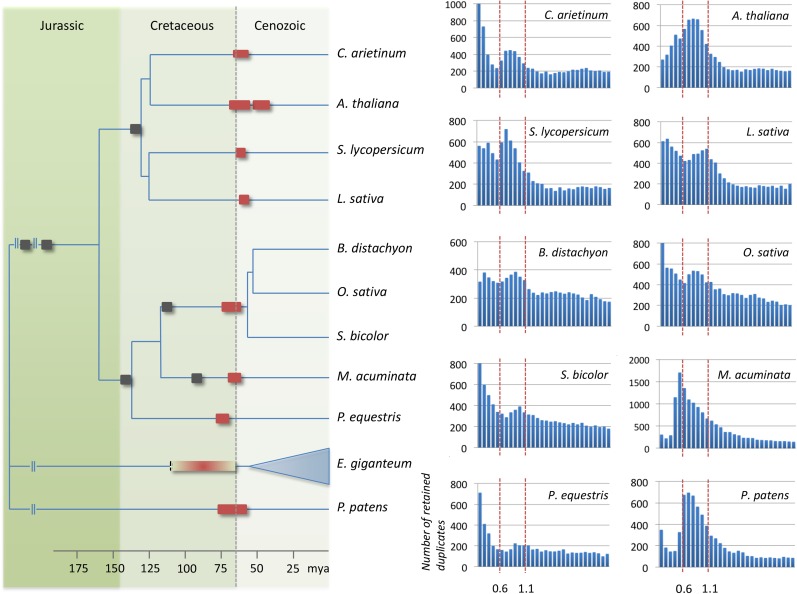
Horsetails represent an enigmatic clade within the land plants. Despite consisting only of one genus (Equisetum) that contains 15 species, they are thought to represent the oldest extant genus within the vascular plants dating back possibly as far as the Triassic. Horsetails have retained several ancient features and are also characterized by a particularly high chromosome count (n = 108). Whole-genome duplications (WGDs) have been uncovered in many angiosperm clades and have been associated with the success of angiosperms, both in terms of species richness and biomass dominance, but remain understudied in nonangiosperm clades. Here, we report unambiguous evidence of an ancient WGD in the fern lineage, based on sequencing and de novo assembly of an expressed gene catalog (transcriptome) from the giant horsetail (Equisetum giganteum). We demonstrate that horsetails underwent an independent paleopolyploidy during the Late Cretaceous prior to the diversification of the genus but did not experience any recent polyploidizations that could account for their high chromosome number. We also discuss the specific retention of genes following the WGD and how this may be linked to their long-term survival.
© 2015 American Society of Plant Biologists. All rights reserved.
Figures
Comment in
-
A Transcriptomic Approach to Evolutionary Genetics of Giant Horsetail.Plant Cell. 2015 Jun;27(6):1566. doi: 10.1105/tpc.15.00409. Epub 2015 May 22. Plant Cell. 2015. PMID: 26002870 Free PMC article. No abstract available.
Similar articles
-
Origin of horsetails and the role of whole-genome duplication in plant macroevolution.Proc Biol Sci. 2019 Nov 6;286(1914):20191662. doi: 10.1098/rspb.2019.1662. Epub 2019 Oct 30. Proc Biol Sci. 2019. PMID: 31662084 Free PMC article.
-
Recurrent genome duplication events likely contributed to both the ancient and recent rise of ferns.J Integr Plant Biol. 2020 Apr;62(4):433-455. doi: 10.1111/jipb.12877. Epub 2019 Dec 30. J Integr Plant Biol. 2020. PMID: 31628713
-
Evaluating and Characterizing Ancient Whole-Genome Duplications in Plants with Gene Count Data.Genome Biol Evol. 2016 Apr 11;8(4):1023-37. doi: 10.1093/gbe/evw058. Genome Biol Evol. 2016. PMID: 26988251 Free PMC article.
-
Polyploidy and genome evolution in plants.Curr Opin Genet Dev. 2015 Dec;35:119-25. doi: 10.1016/j.gde.2015.11.003. Epub 2015 Dec 2. Curr Opin Genet Dev. 2015. PMID: 26656231 Review.
-
Ancient WGD events as drivers of key innovations in angiosperms.Curr Opin Plant Biol. 2016 Apr;30:159-65. doi: 10.1016/j.pbi.2016.03.015. Epub 2016 Apr 8. Curr Opin Plant Biol. 2016. PMID: 27064530 Review.
Cited by
-
The C-Fern (Ceratopteris richardii) genome: insights into plant genome evolution with the first partial homosporous fern genome assembly.Sci Rep. 2019 Dec 3;9(1):18181. doi: 10.1038/s41598-019-53968-8. Sci Rep. 2019. PMID: 31796775 Free PMC article.
-
Dating Whole Genome Duplication in Ceratopteris thalictroides and Potential Adaptive Values of Retained Gene Duplicates.Int J Mol Sci. 2019 Apr 19;20(8):1926. doi: 10.3390/ijms20081926. Int J Mol Sci. 2019. PMID: 31010109 Free PMC article.
-
Comparative Analysis of Transcriptomes in Rhizophoraceae Provides Insights into the Origin and Adaptive Evolution of Mangrove Plants in Intertidal Environments.Front Plant Sci. 2017 May 16;8:795. doi: 10.3389/fpls.2017.00795. eCollection 2017. Front Plant Sci. 2017. PMID: 28559911 Free PMC article.
-
Gamete expression of TALE class HD genes activates the diploid sporophyte program in Marchantia polymorpha.Elife. 2021 Sep 17;10:e57088. doi: 10.7554/eLife.57088. Elife. 2021. PMID: 34533136 Free PMC article.
-
Chloroplast genome structure analysis of Equisetum unveils phylogenetic relationships to ferns and mutational hotspot region.Front Plant Sci. 2024 Apr 11;15:1328080. doi: 10.3389/fpls.2024.1328080. eCollection 2024. Front Plant Sci. 2024. PMID: 38665369 Free PMC article.
References
-
- Abbasi A.A. (2010). Piecemeal or big bangs: correlating the vertebrate evolution with proposed models of gene expansion events. Nat. Rev. Genet. 11: 166. - PubMed
-
- Arrigo N., Barker M.S. (2012). Rarely successful polyploids and their legacy in plant genomes. Curr. Opin. Plant Biol. 15: 140–146. - PubMed
-
- Barker M.S. (2009). Evolutionary genomic analyses of ferns reveal that high chromosome numbers are a product of high retention and fewer rounds of polyploidy relative to angiosperms. Am. Fern J. 99: 136–141.
Publication types
MeSH terms
LinkOut - more resources
Full Text Sources
Other Literature Sources
