. 2015 Jul 2;126(1):50-60.
doi: 10.1182/blood-2015-01-625004. Epub 2015 May 22.

Lenalidomide augments actin remodeling and lowers NK-cell activation thresholds

Affiliations

Lenalidomide augments actin remodeling and lowers NK-cell activation thresholds

Kathryn Lagrue et al. Blood. .

Abstract

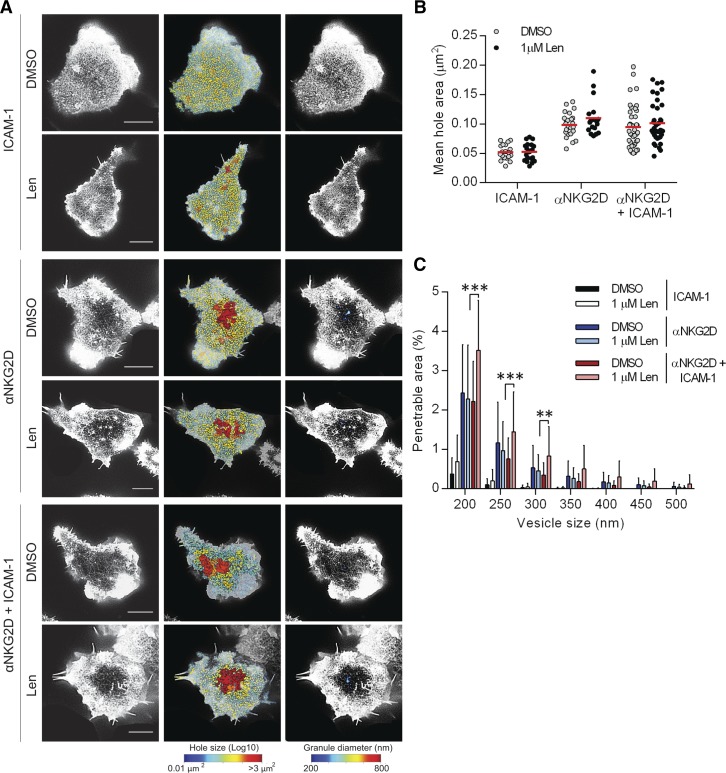
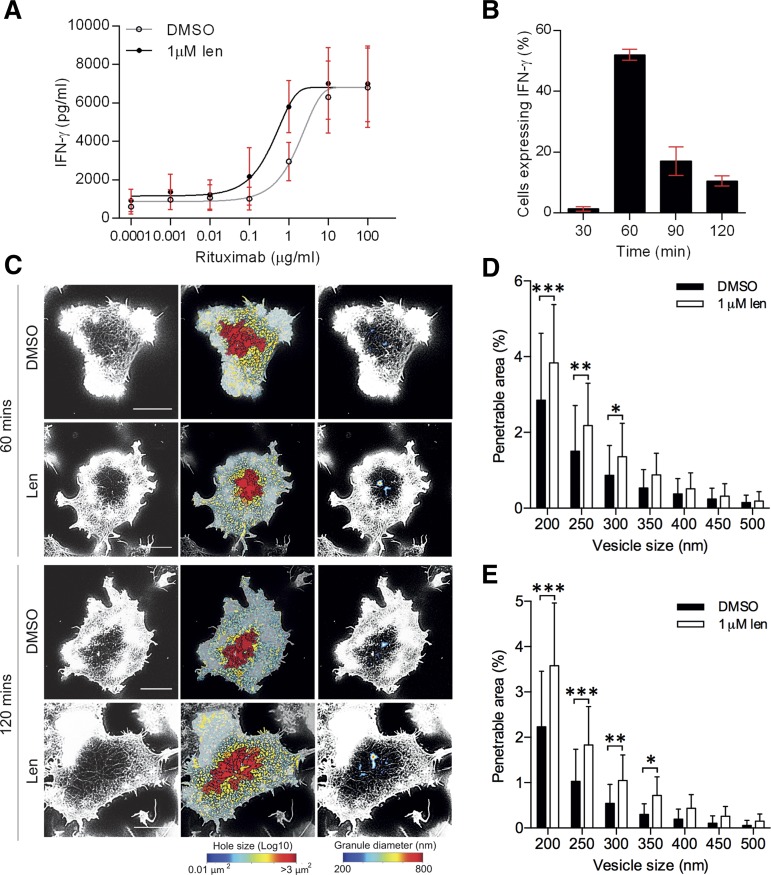
As multiple myeloma (MM) progresses, natural killer (NK)-cell responses decline against malignant plasma cells. The immunomodulatory drug lenalidomide is widely used for treatment of MM but its influence on NK-cell biology is unclear. Here, we report that lenalidomide lowers the threshold for NK-cell activation, causing a 66% decrease in the 50% effective concentration (EC50) for activation through CD16, and a 38% decrease in EC50 for NK group 2 member D (NKG2D)-mediated activation, allowing NK cells to respond to lower doses of ligand. In addition, lenalidomide augments NK-cell responses, causing a twofold increase in the proportion of primary NK cells producing interferon-γ (IFN-γ), and a 20-fold increase in the amount of IFN-γ produced per cell. Importantly, lenalidomide did not trigger IFN-γ production in unstimulated NK cells. Thus, lenalidomide enhances the NK-cell arm of the immune response, without activating NK cells inappropriately. Of particular clinical importance, lenalidomide also allowed NK cells to be activated by lower doses of rituximab, an anti-CD20 monoclonal antibody (mAb) widely used to treat B-cell malignancies. This supports combined use of lenalidomide and rituximab in a clinical setting. Finally, superresolution microscopy revealed that lenalidomide increased the periodicity of cortical actin at immune synapses, resulting in an increase in the area of the actin mesh predicted to be penetrable to vesicles containing IFN-γ. NK cells from MM patients also responded to lenalidomide in this way. This indicates that nanometer-scale rearrangements in cortical actin, a recently discovered step in immune synapse assembly, are a potential new target for therapeutic compounds.


Figures

Figure 1
Figure 1
Lenalidomide treatment increases IFN-γ secretion from NK cells. (A) Healthy donor pNK cells and Daudi target cells were pretreated with DMSO or 0.001 to 10 µM lenalidomide for 24 hours then the Daudi cells were tested for susceptibility to NK-cell–mediated lysis. Graph shows mean ± SD from 3 independent donors. E:T ratio was 10:1. (B-C) pNK cells and (B) Daudi cells or (C) Raji cells were cocultured for 24 hours with DMSO or 0.001 to 10 µM lenalidomide (±150 U/mL IL-2). IFN-γ release was measured by ELISA. E:T ratio was 10:1 in all experiments. Data shows mean ± SD from 3 donors. Significance compared with DMSO (‘0 µM’) condition. (D-G) Primary NK cells were treated with DMSO or 0.1 to 10 µM lenalidomide (+150 U/mL IL-2) for 24 hours in wells coated with (D) anti-CD16 mAb or IgG1 isotype control mAb, (E) recombinant ICAM-1, anti-NKG2D mAb, or both, (F) recombinant ICAM-1, recombinant MICA, or both, (G) anti-NKG2D mAb, anti-2B4, or both. IFN-γ release was assessed by ELISA. Data show mean ± SD from 3 donors. (H-I) Primary NK cells were treated with DMSO or 1.0 µM lenalidomide (+150 U/mL IL-2) for 4 hours in wells coated with (H) anti-CD16 mAb or IgG1 isotype control mAb, or (I) recombinant ICAM-1 or recombinant MICA and ICAM-1. IFN-γ mRNA was assessed by qRT-PCR and is normalized to GAPDH. Data shows triplicate data from (H) 3 donors and (I) 2 donors. Data points for each donor are shaded the same. Red line shows the mean. ns, not significant; qRT-PCR, quantitative reverse transcription polymerase chain reaction. *P < .05, **P < .01, ***P < .001, 1-way ANOVA with Tukey posttest.
Figure 2
Figure 2
Lenalidomide increases the proportion of pNK cells expressing IFN-γ as well as the amount produced per cell. (A) Representative microscopy images of F-actin (red) and IFN-γ (shown in grayscale in middle column, and then green in merged image) in pNK cells stimulated for 120 minutes on surfaces coated with IgG1 isotype control mAb or anti-CD16 mAb in the presence of DMSO or 1 µM lenalidomide (+150 U/mL IL-2). Scale bars, 10 µm. (B) The proportion of cells expressing IFN-γ after stimulation on anti-CD16 mAb-coated surfaces in the presence of DMSO or 1 µM lenalidomide (+150 U/mL IL-2) for 30 to 240 minutes. Graph shows mean ± SD, n > 200 from 3 donors. (C) The proportion of cells expressing IFN-γ after stimulation on anti-CD16 mAb-coated surfaces in the presence of DMSO or 1 µM lenalidomide (+150 U/mL IL-2) for 30 to 240 minutes. All cells treated with DMSO or 1 µM lenalidomide for a total of 240 minutes and added to stimulating surfaces in the reverse order for the time course (for example, for 30-minute stimulation, pNK cells were treated with DMSO or 1 µM lenalidomide for 210 minutes before plating). Graph shows mean ± SD, n > 100 from 2 donors. (D) The proportion of pNK cells expressing IFN-γ after stimulation on anti-CD16 mAb-coated surfaces with 0.1 to 10 µM lenalidomide. Graph shows mean ± SD, n > 100 per donor from 3 donors. (E) Sum IFN-γ fluorescence per cell in pNK cells stimulated as in panel D. Each data point represents a single cell and red line shows the mean. n = 75 to 111 from 3 donors. *P < .05, **P < .01, ***P < .001, 1-way ANOVA with Tukey posttest.
Figure 3
Figure 3
Lenalidomide lowers the threshold for NK-cell activation through NKG2D and CD16. (A-B) pNK cells were treated with DMSO or 1.0 µM lenalidomide (+150 U/mL IL-2) for 24 hours in wells coated with (A) 0.1 to 10 µg/mL MICA plus 2.5 µg/mL ICAM-1 or (B) 1 to 500 µg/mL human IgG. IFN-γ release was measured by ELISA. Data show mean ± SD from 3 donors. Nonlinear regression fit was applied to data. EC50 values were calculated to be: 2.1 µg/mL (MICA DMSO), 1.3 µg/mL (MICA 1.0µM Len), 62 µg/mL (hIgG DMSO), 21 µg/mL (hIgG 1.0µM Len). (C) Representative microscopy images of F-actin (red) and IFN-γ (shown in grayscale in middle column, and then green in merged image) in pNK cells stimulated for 90 minutes on surfaces coated with 1 µg/mL or 2.5 µg/mL MICA (+2.5 µg/mL ICAM-1) in the presence of DMSO or 1.0 µM lenalidomide (+150 U/mL IL-2). Scale bars, 10 µm. (D) The proportion of pNK cells expressing IFN-γ after stimulation with 3 different concentrations of MICA. Graph shows mean ± SD, n > 100 per donor from 3 donors. (E) Sum fluorescence staining for IFN-γ per cell in the same cells as in panel D. Each data point represents a single cell and red line shows the mean. *P < .05, **P < .01, ****P < .0001, 1-way ANOVA with Tukey posttest.
Figure 4
Figure 4
Lenalidomide treatment augments opening of cortical actin mesh after CD16 stimulation. (A) Superresolution images obtained by STED microscopy of membrane proximal F-actin in pNK cells incubated for 120 minutes on coverslips coated with isotype-matched control antibody or anti-CD16 mAb (both 3 µg/mL) in the presence of DMSO vehicle control or 1.0 µM lenalidomide (+150 U/mL IL-2). Scale bars, 5 µm. Second column: Holes between actin filaments in the central region of the synapse shown as heat maps, with the smallest holes shown in blue (0.01 µm2) and largest holes shown in red (>3 µm2). Third column: Regions are shown within the actin mesh through which a particle (such as an IFN-γ vesicle) of diameter 200 nm (blue) to 800 nm (red) could fit. (B) Histogram of measured vesicle sizes from 10 cells from 2 independent donors. (C) Average size of holes in the actin mesh at the pNK synapse for cells stimulated as in panel A. Each data point represents a single cell; red lines shows mean from 3 donors, n = 18 to 59 per condition. (D) The proportion of the synapse area predicted to be penetrable by a vesicle of 200- to 500-nm diameter for same cells as in panel C. (E) Analysis of STED microscopy of membrane proximal actin in pNK cell stimulated as in panel A plus 5 µg/mL brefeldin A and costained with anti-IFN-γ conjugated to Alexa 647. The proportion of the synapse predicted to be penetrable by a particle of 200- to 500-nm diameter, stratified by whether or not the cells stained positive for IFN-γ. Graph shows mean from 3 donors, n = 50. *P < .05, **P < .01, ***P < .001, 1-way ANOVA with Tukey posttest.
Figure 5
Figure 5
Lenalidomide treatment augments opening of cortical actin mesh after NKG2D and LFA-1 ligation. (A) Superresolution images obtained by STED microscopy of membrane proximal F-actin in pNK cells incubated for 120 minutes on coverslips coated with recombinant human ICAM-1 (2.5 µg/mL), anti-NKG2D mAb (3 µg/mL), or both in the presence of DMSO or 1.0 µM lenalidomide (+150 U/mL IL-2). Scale bars, 5 µm. Second column: Holes between actin filaments in the central region of the synapse shown as heat maps, with the smallest holes shown in blue (0.01 µm2) and largest holes shown in red (>3 µm2). Third column: Regions are shown within the actin mesh through which a particle (such as an IFN-γ vesicle) of diameter 200 nm (blue) to 800 nm (red) could fit. (B) Average size of holes in the actin mesh at the pNK synapse for cells stimulated as in panel A. Each data point represents a single cell; red lines shows the mean from 3 donors, n = 18 to 59 per condition. (C) The proportion of the synapse area predicted to be penetrable by a vesicle of 200- to 500-nm diameter for same cells as in panel B. Graph shows mean ± SD. **P < .01, ***P < .001, 1-way ANOVA with Tukey posttest.
Figure 6
Figure 6
Lenalidomide treatment increases NK-cell activation through rituximab. (A) pNK cells were treated with DMSO or 1.0 µM lenalidomide (+150 U/mL IL-2) for 24 hours in wells coated with 0.0001 to 100 µg/mL rituximab. IFN-γ release was measured by ELISA. Data shows mean ± SD from 3 donors. Nonlinear regression fit was applied to data. EC50 values calculated to be: 1.6 µg/mL without lenalidomide and 0.4 µg/mL with lenalidomide. (B) Proportion of DMSO-treated cells expressing IFN-γ after stimulation on rituximab-coated surfaces in the presence of DMSO or 1 µM lenalidomide for 30 to 120 minutes. Graph shows mean ± SD, n > 200 from 3 donors. (C) Superresolution images obtained by STED microscopy of membrane proximal F-actin in pNK cells incubated for 60 or 120 minutes on coverslips coated with rituximab (10 µg/mL) in the presence of DMSO or 1.0 µM lenalidomide (+150 U/mL IL-2). Scale bars, 5 µm. Second column: Holes between actin filaments shown as heat maps, with the smallest holes shown in blue (0.01 µm2) and largest holes shown in red (>3 µm2). Third column: Regions are shown through which a particle (such as an IFN-γ vesicle) of diameter 200 nm (blue) to 800 nm (red) could fit. (D) Proportion of the synapse area predicted to be penetrable by a vesicle of 200- to 500-nm diameter for cells stimulated on 10 µg/mL rituximab for 60 minutes. (E) Proportion of the synapse area predicted to be penetrable by a vesicle of 200- to 500-nm diameter for cells stimulated on 10 µg/mL rituximab for 120 minutes. Graph shows mean ± SD, n = 45 from 3 donors. *P < .05, **P < .01, ***P < .001, 1-way ANOVA with Tukey posttest.
Figure 7
Figure 7
Lenalidomide augments NK-cell IFN-γ production and cortical actin rearrangements in NK cells isolated from MM patients. (A) Primary NK cells isolated from MM patients were treated with DMSO or 1.0 µM lenalidomide (+150 U/mL IL-2) for 24 hours in wells coated with anti-CD16 mAb or IgG1 isotype-matched control mAb. IFN-γ release was assessed by ELISA. E:T ratio was 10:1. Data shows mean ± SD from 9 MM patients. (B) Proportion of primary NK cells from MM patients expressing IFN-γ after stimulation on anti-CD16 mAb-coated surfaces in the presence of DMSO or 1.0 µM lenalidomide for 120 minutes. Graph shows mean ± SD, n > 100 from 9 MM patients. (C) Average size of holes in the actin mesh at the pNK synapse for NK cells from MM patients stimulated on anti-CD16-coated surfaces and then imaged by STED microscopy. Data show the average per MM patient (20 cells analyzed per patient); black lines show the mean. (D) The proportion of the synapse area predicted to be penetrable by a vesicle of 200- to 500-nm diameter for same cells as in panel C. (E) Superresolution imaged obtained by STED microscopy of membrane proximal actin in NK cells from MM patient who are either in remission or relapsing, treated with DMSO vehicle control or 1.0 µM lenalidomide. Scale bars, 5 µm. (F) IFN-γ release as shown in panel A separated by whether the patients are in remission or relapsing. (G) The proportion of the synapse area predicted to be penetrable by a vesicle of either 200- to 300-nm diameter or 301- to 500-nm diameter in NK cells from MM patients who are in remission or relapsing. *P < .05, **P < .01, ***P < .001, 1-way ANOVA with Tukey posttest.

Similar articles

Cited by

References

    1. Wu J, Lanier LL. Natural killer cells and cancer. Adv Cancer Res. 2003;90:127–156. - PubMed
    1. Orange JS. Formation and function of the lytic NK-cell immunological synapse. Nat Rev Immunol. 2008;8(9):713–725. - PMC - PubMed
    1. Raulet DH, Guerra N. Oncogenic stress sensed by the immune system: role of natural killer cell receptors. Nat Rev Immunol. 2009;9(8):568–580. - PMC - PubMed
    1. Bauer S, Groh V, Wu J, et al. Activation of NK cells and T cells by NKG2D, a receptor for stress-inducible MICA. Science. 1999;285(5428):727–729. - PubMed
    1. Culley FJ, Johnson M, Evans JH, et al. Natural killer cell signal integration balances synapse symmetry and migration. PLoS Biol. 2009;7(7):e1000159. - PMC - PubMed

Publication types

MeSH terms