

Cost-effectiveness modelling in diagnostic imaging: a stepwise approach
- PMID: 26003789
- PMCID: PMC4636534
- DOI: 10.1007/s00330-015-3770-8
Cost-effectiveness modelling in diagnostic imaging: a stepwise approach
Abstract
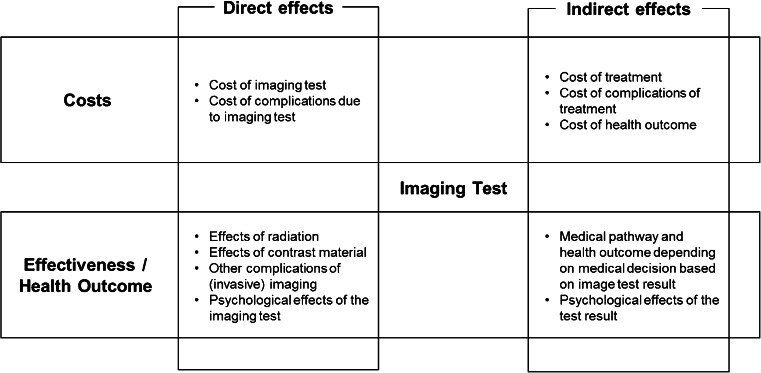
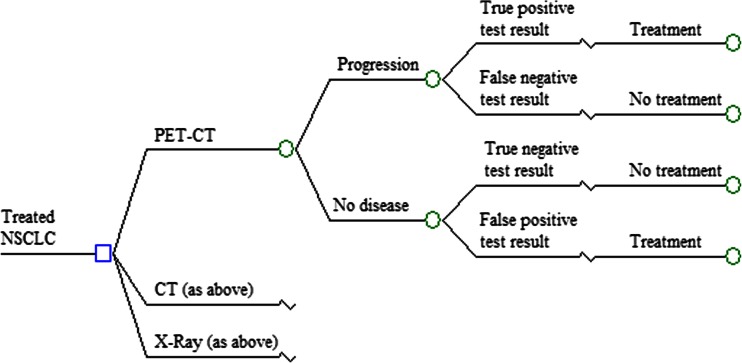
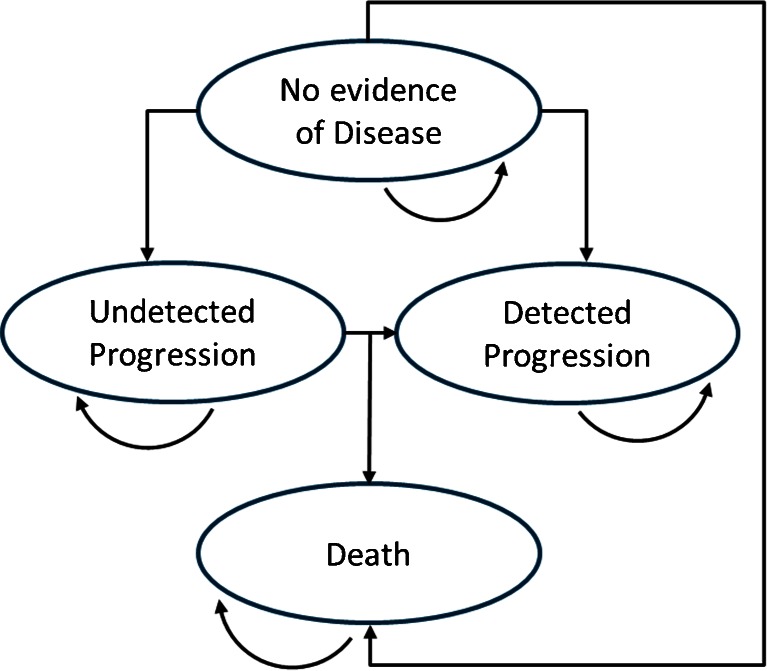
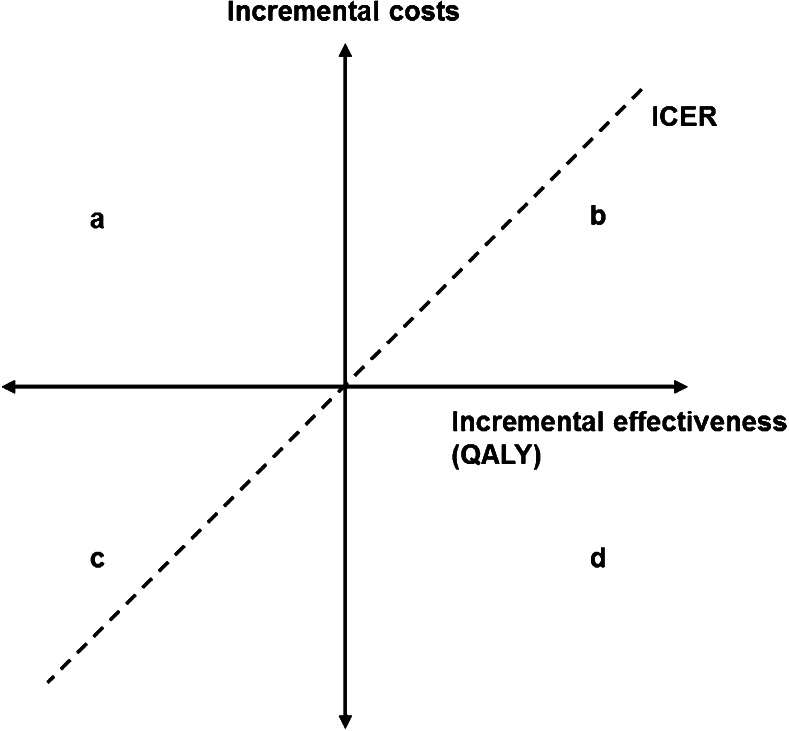
Diagnostic imaging (DI) is the fastest growing sector in medical expenditures and takes a central role in medical decision-making. The increasing number of various and new imaging technologies induces a growing demand for cost-effectiveness analysis (CEA) in imaging technology assessment. In this article we provide a comprehensive framework of direct and indirect effects that should be considered for CEA in DI, suitable for all imaging modalities. We describe and explain the methodology of decision analytic modelling in six steps aiming to transfer theory of CEA to clinical research by demonstrating key principles of CEA in a practical approach. We thereby provide radiologists with an introduction to the tools necessary to perform and interpret CEA as part of their research and clinical practice.
Key points: • DI influences medical decision making, affecting both costs and health outcome. • This article provides a comprehensive framework for CEA in DI. • A six-step methodology for conducting and interpreting cost-effectiveness modelling is proposed.
Keywords: Cost Effectiveness; Decision Modelling; Diagnostic Imaging; Economics; Technology Assessment.
Figures
Similar articles
-
Cost-effectiveness analysis in the assessment of diagnostic imaging technologies.Radiology. 2005 May;235(2):361-70. doi: 10.1148/radiol.2352040330. Radiology. 2005. PMID: 15858079 Review.
-
Early cost-effectiveness modeling for better decisions in public research investment of personalized medicine technologies.J Comp Eff Res. 2019 Jan;8(1):7-19. doi: 10.2217/cer-2018-0033. Epub 2018 Dec 10. J Comp Eff Res. 2019. PMID: 30525982
-
Clinical trials of cost effectiveness in technology evaluation.Q J Nucl Med. 2000 Jun;44(2):197-203. Q J Nucl Med. 2000. PMID: 10967629
-
An introduction to the methods of cost-effectiveness analysis.Drug Ther Bull. 2012 Jul;50(7):81-4. doi: 10.1136/dtb.2012.06.0118. Drug Ther Bull. 2012. PMID: 22789768
-
The once and future application of cost-effectiveness analysis.Jt Comm J Qual Improv. 1999 Sep;25(9):455-61. doi: 10.1016/s1070-3241(16)30459-x. Jt Comm J Qual Improv. 1999. PMID: 10481814 Review.
Cited by
-
Cost-Effectiveness of Routine X-Rays After Central Venous Catheter Removal: A Value-Based Analysis of Post-Removal Complications.J Clin Med. 2025 Feb 19;14(4):1397. doi: 10.3390/jcm14041397. J Clin Med. 2025. PMID: 40004927 Free PMC article.
-
"Keep it simple - a lesson from COVID-19": highlighting the utility of chest X-rays in ARDS-associated illnesses through the Zonal Scoring System.Pol J Radiol. 2023 Mar 3;88:e124-e134. doi: 10.5114/pjr.2023.125981. eCollection 2023. Pol J Radiol. 2023. PMID: 37057199 Free PMC article.
-
A Primer to Cost-Effectiveness Analysis in Breast Cancer Imaging: A Review of the Literature.Cureus. 2022 Aug 24;14(8):e28356. doi: 10.7759/cureus.28356. eCollection 2022 Aug. Cureus. 2022. PMID: 36106225 Free PMC article. Review.
-
Artificial intelligence for brain diseases: A systematic review.APL Bioeng. 2020 Oct 13;4(4):041503. doi: 10.1063/5.0011697. eCollection 2020 Dec. APL Bioeng. 2020. PMID: 33094213 Free PMC article. Review.
-
Artificial Intelligence in Radiation Therapy.IEEE Trans Radiat Plasma Med Sci. 2022 Feb;6(2):158-181. doi: 10.1109/TRPMS.2021.3107454. Epub 2021 Aug 24. IEEE Trans Radiat Plasma Med Sci. 2022. PMID: 35992632 Free PMC article.
References
-
- Drummond MF, Sculpher MJ, Torrance GW, O’Brien BJ, Stoddart GL. Methods for the economic evaluation of health care programmes. 3. Oxford: Oxford University Press; 2005.
-
- Neiman Institute (2012) Medical Imaging: Is the growth boom over? In: Neiman Report Brief 1. Neiman Institute
-
- Schaafsma JD, Koffijberg H, Buskens E, Velthuis BK, van der Graaf Y, Rinkel GJ. Cost-effectiveness of magnetic resonance angiography versus intra-arterial digital subtraction angiography to follow-up patients with coiled intracranial aneurysms. Stroke. 2010;41:1736–1742. doi: 10.1161/STROKEAHA.110.585083. - DOI - PubMed
Publication types
MeSH terms
LinkOut - more resources
Full Text Sources
Other Literature Sources
Medical
