. 2015 Aug;5(8):821-831.
doi: 10.1158/2159-8290.CD-15-0412. Epub 2015 May 23.

Tracking the genomic evolution of esophageal adenocarcinoma through neoadjuvant chemotherapy

Affiliations

Tracking the genomic evolution of esophageal adenocarcinoma through neoadjuvant chemotherapy

Nirupa Murugaesu et al. Cancer Discov. 2015 Aug.

Abstract

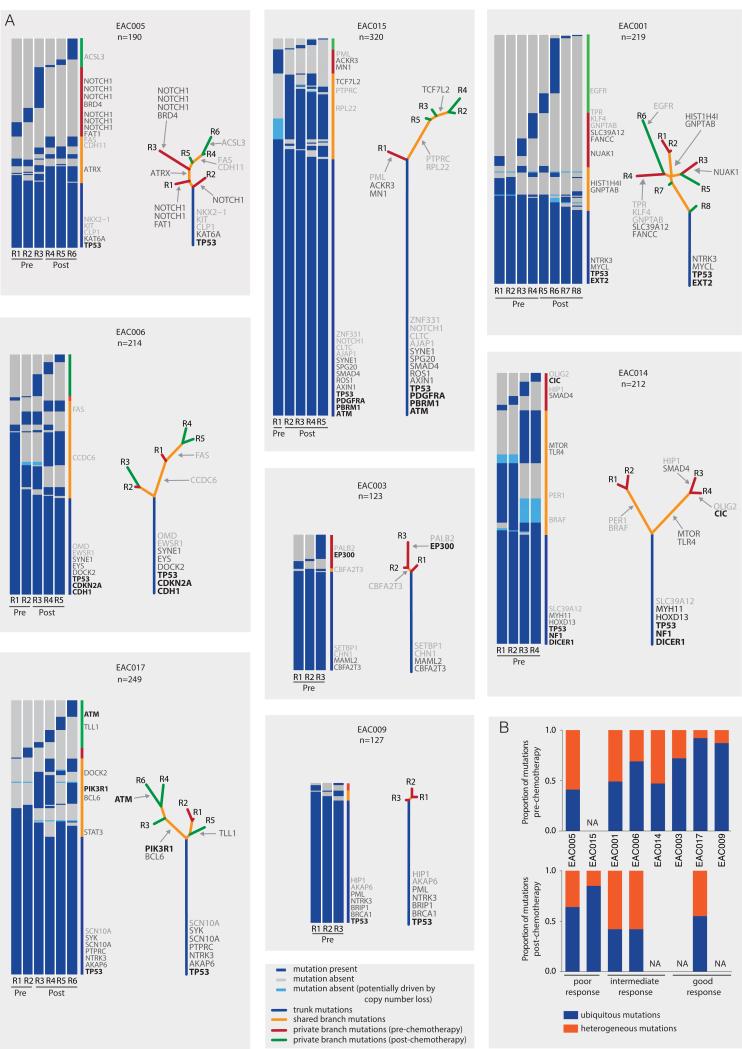
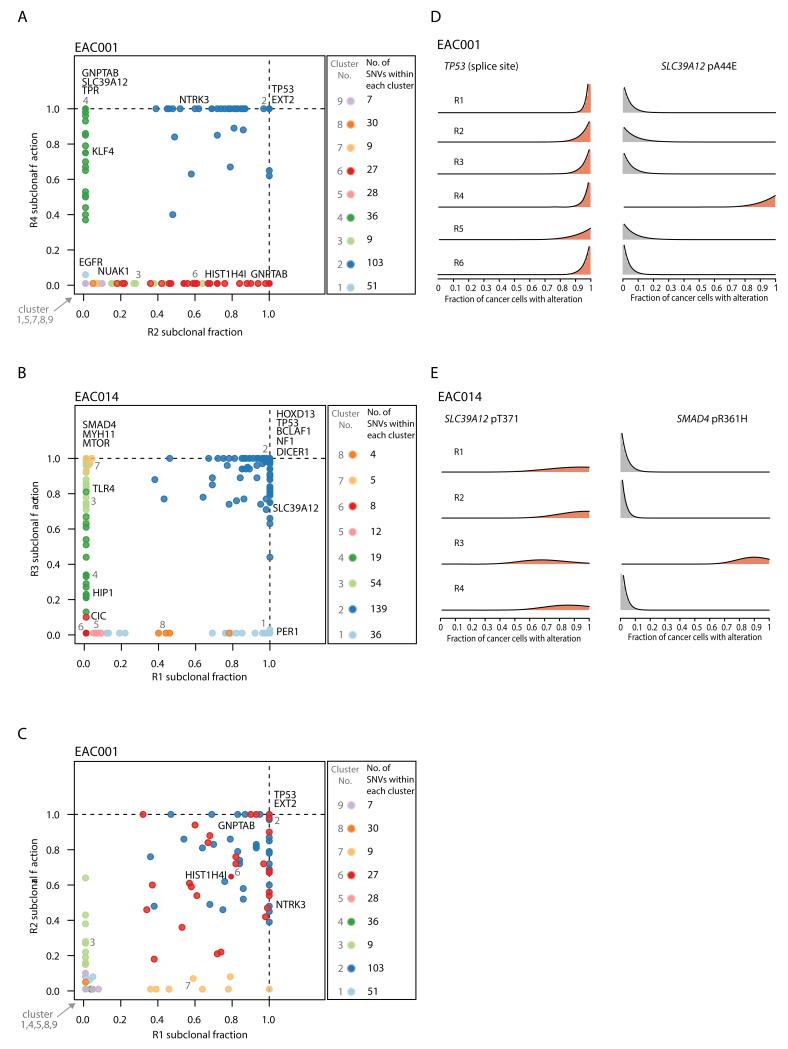
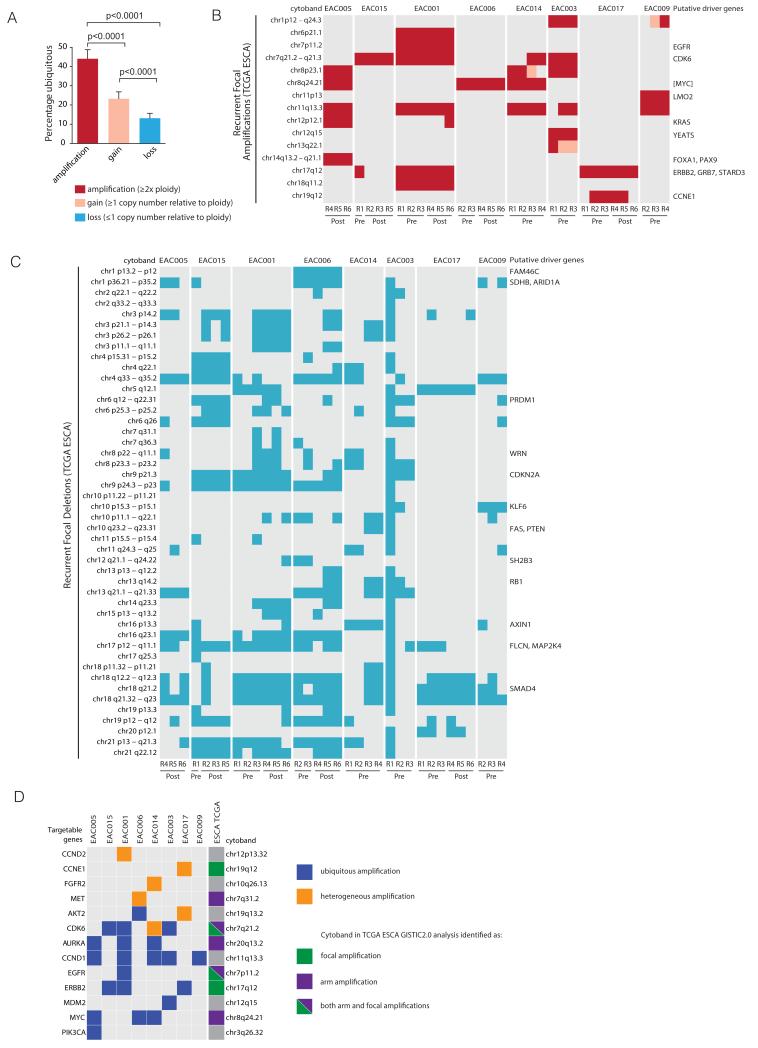
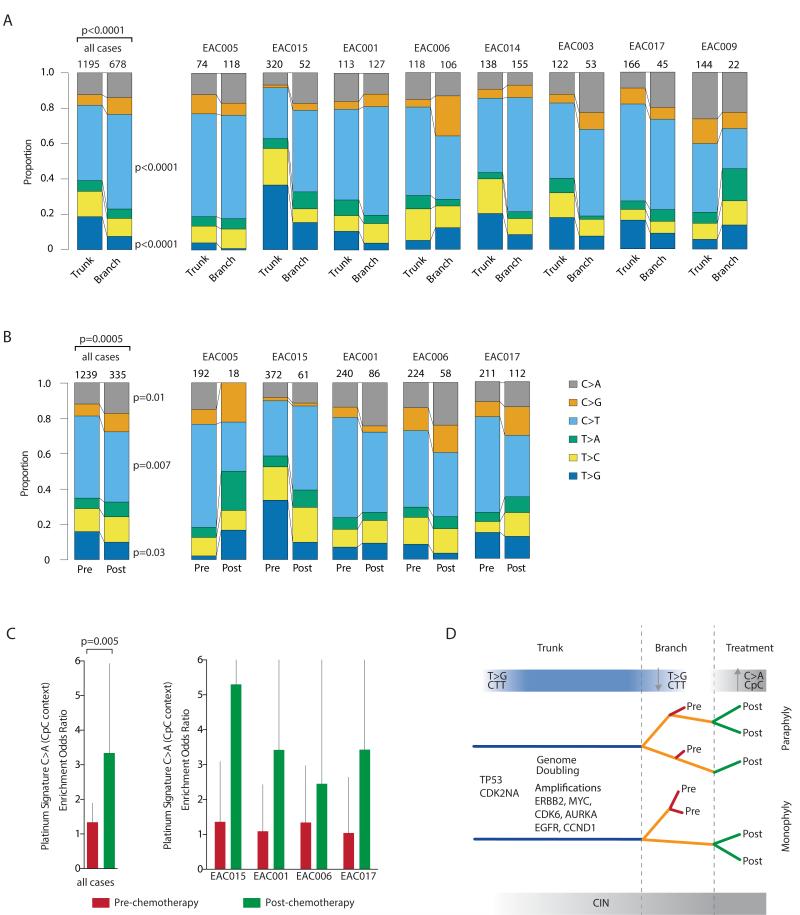
Esophageal adenocarcinomas are associated with a dismal prognosis. Deciphering the evolutionary history of this disease may shed light on therapeutically tractable targets and reveal dynamic mutational processes during the disease course and following neoadjuvant chemotherapy (NAC). We exome sequenced 40 tumor regions from 8 patients with operable esophageal adenocarcinomas, before and after platinum-containing NAC. This revealed the evolutionary genomic landscape of esophageal adenocarcinomas with the presence of heterogeneous driver mutations, parallel evolution, early genome-doubling events, and an association between high intratumor heterogeneity and poor response to NAC. Multiregion sequencing demonstrated a significant reduction in thymine to guanine mutations within a CpTpT context when comparing early and late mutational processes and the presence of a platinum signature with enrichment of cytosine to adenine mutations within a CpC context following NAC. Esophageal adenocarcinomas are characterized by early chromosomal instability leading to amplifications containing targetable oncogenes persisting through chemotherapy, providing a rationale for future therapeutic approaches.

Significance: This work illustrates dynamic mutational processes occurring during esophageal adenocarcinoma evolution and following selective pressures of platinum exposure, emphasizing the iatrogenic impact of therapy on cancer evolution. Identification of amplifications encoding targetable oncogenes maintained through NAC suggests the presence of stable vulnerabilities, unimpeded by cytotoxics, suitable for therapeutic intervention.


Figures

Figure 1
Figure 1
Intratumor heterogeneity of somatic mutations. A, Heatmaps show the regional distribution of all non-silent mutations; presence (blue), absence, potentially due to copy number loss (light blue) or absence (grey) of each mutation is indicated for every tumor region. Column next to heatmap shows the distribution of mutations; mutation present in all tumor regions (blue), shared in more than one but not all regions (orange), in one pre-chemotherapy tumor region (red) and in one post-chemotherapy tumor region (green). Mutations are ordered by tumor driver category with categories 1-3 indicated in the right column in black, dark grey and light grey respectively (details in Supplementary Table S3). Total number of non-silent mutations (n) is provided for each tumor. Phylogenetic trees generated by a parsimony ratchet approach (18) based on the distribution of all detected mutations are shown to the right of the heatmap; trunk and branch lengths are proportional to the number of non-silent mutations acquired. Category 1, 2 and 3 driver mutations are indicated next to the trunk or with an arrow pointing to the branches where they were acquired. B, Plots show the proportion of trunk and branch mutations in the pre- and post-chemotherapy tumor regions. NA; data not available for these tumors; only one pre-chemotherapy tumor region available for analysis in EAC015 and tumors EAC014, EAC003, EAC009 had responded well to treatment with low tumor purity levels in the post chemotherapy regions, rendering analysis intractable.
Figure 2
Figure 2
Cancer cell fraction comparisons for different tumor regions. A-C, In each plot, the cancer cell fraction of all single nucleotide variants (SNVs) for one tumor region is plotted against another tumor region. The SNVs within each cluster are indicated. D-E, Representative probability distributions over the cancer cell fraction for individual mutations are shown for specific tumors.
Figure 3
Figure 3
Intratumor heterogeneity of chromosomal alterations. A, Plot showing the percentage of ubiquitous copy number amplifications, gains and losses (+SEM) for all tumors. B and C, Heatmaps showing the distribution of potential tumor driver copy number amplifications and deletions for each tumor region based on recurrently amplified and deleted chromosomal segments identified from TCGA esophageal cancer (ESCA) data. For each region, amplification was determined as ≥2x ploidy and copy number loss was determined as ≤1 copy number, relative to ploidy. If no putative driver genes were identified within the recurrent amplification or deletion, the nearest gene appears in square brackets as described by GISTIC2.0 (22). D, Heatmap showing amplifications identified within the cohort of tumors containing a targetable oncogene as identified by the TARGET dataset (23) and whether these occur as ubiquitous (blue) or heterogeneous (orange) amplifications and if they occur as recurrent focal or arm level amplifications based on TCGA ESCA data (22).
Figure 4
Figure 4
Temporal and spatial dissection of mutation spectra in EAC samples. A, Stacked barplot showing the fraction of early mutations (trunk) and late mutations (branch) accounted for by each of the six mutation types in all M-seq samples and per case. The number of mutations analyzed is displayed on top of each bar. The difference between the spectra for trunk and branch mutations across all cases was assessed using a χ2 test. For specific mutation types, a Fisher’s exact test was used, and significant p values are shown. B, Stacked barplot showing the fraction of pre-chemotherapy mutations and post-chemotherapy mutations accounted for by each of the six mutation types in all M-seq samples and per case. The number of mutations analyzed is displayed on top of each bar. The difference between the spectra for trunk and branch mutations across all cases was assessed using a χ2 test. For specific mutation types, a Fisher’s exact test was used, and significant p values are shown. C, Barplot showing platinum signature enrichment odds ratio for pre-chemotherapy (red bars) and post-chemotherapy (green bars) mutations for M-seq samples. The platinum signature encompasses C>A in CpC context (25). 95% confidence intervals for Fisher’s exact test are indicated. D, A model of tumor progression in EAC. Inferring the evolutionary trajectories of EAC tumors through NAC by M-seq, identifying early and late mutational processes and the selective pressure of platinum treatment.

Comment in

References

    1. Surveillance, Epidemiology, and End Results Program [Internet] National Cancer Institute, National Institutes of Health; Bethesda: Available from: http://seer.cancer.gov/statfacts/html/esoph.html.
    1. Pohl H, Welch HG. The role of overdiagnosis and reclassification in the marked increase of esophageal adenocarcinoma incidence. J Natl Cancer Inst. 2005;97:142–6. - PubMed
    1. Dulak AM, Stojanov P, Peng S, Lawrence MS, Fox C, Stewart C, et al. Exome and whole-genome sequencing of esophageal adenocarcinoma identifies recurrent driver events and mutational complexity. Nat Genet. 2013;45:478–86. - PMC - PubMed
    1. Weaver JM, Ross-Innes CS, Shannon N, Lynch AG, Forshew T, Barbera M, et al. Ordering of mutations in preinvasive disease stages of esophageal carcinogenesis. Nat Genet. 2014;46:837–43. - PMC - PubMed
    1. Davies AR, Gossage JA, Zylstra J, Mattsson F, Lagergren J, Maisey N, et al. Tumor stage after neoadjuvant chemotherapy determines survival after surgery for adenocarcinoma of the esophagus and esophagogastric junction. J Clin Oncol. 2014;32:2983–90. - PubMed

Publication types

MeSH terms

Supplementary concepts