. 2015 Aug;36(8):2429-42.
doi: 10.1016/j.neurobiolaging.2015.04.015. Epub 2015 May 1.

Brain network alterations and vulnerability to simulated neurodegeneration in breast cancer

Affiliations

Brain network alterations and vulnerability to simulated neurodegeneration in breast cancer

Shelli R Kesler et al. Neurobiol Aging. 2015 Aug.

Abstract

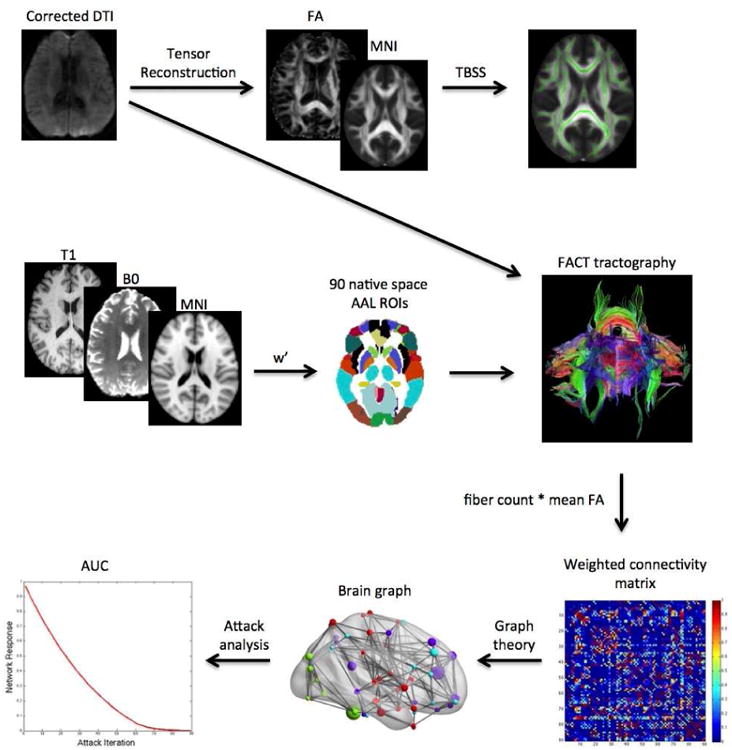
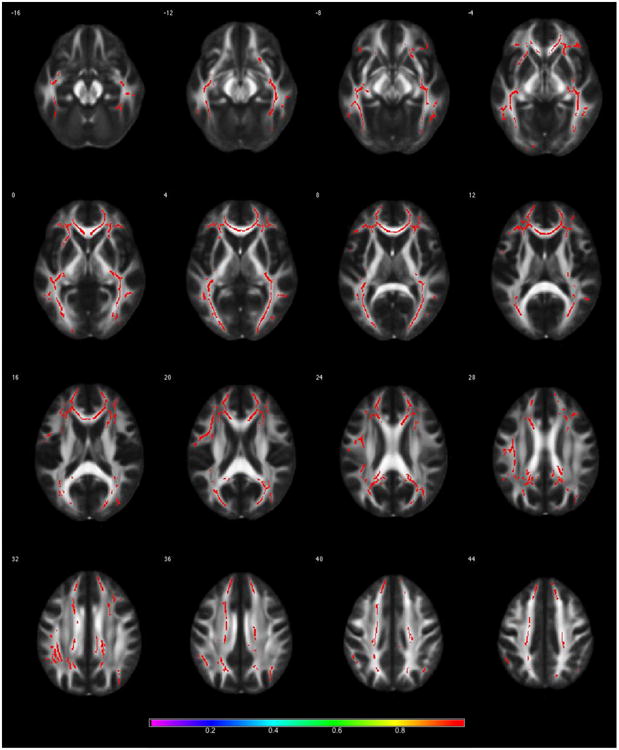
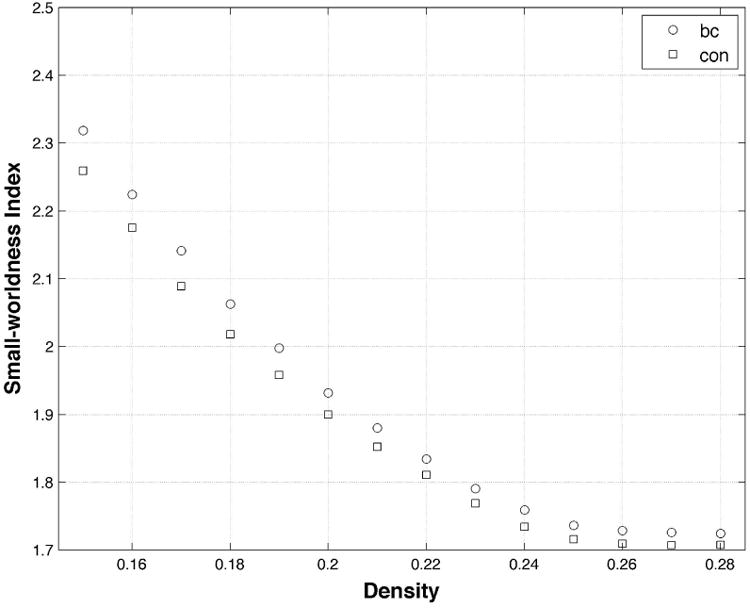
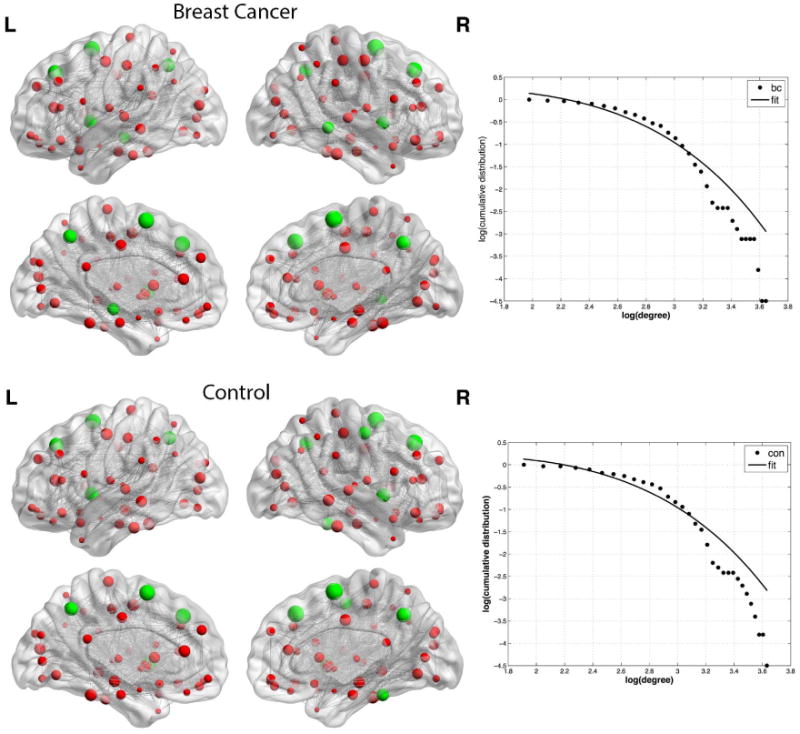
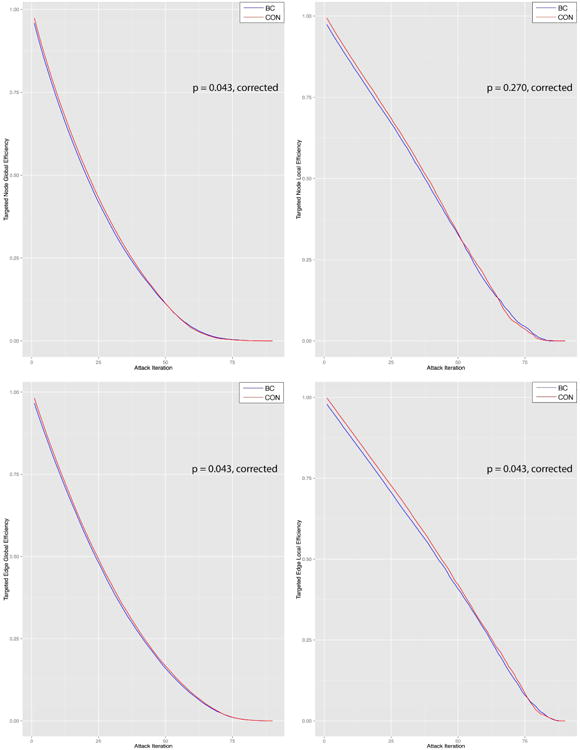
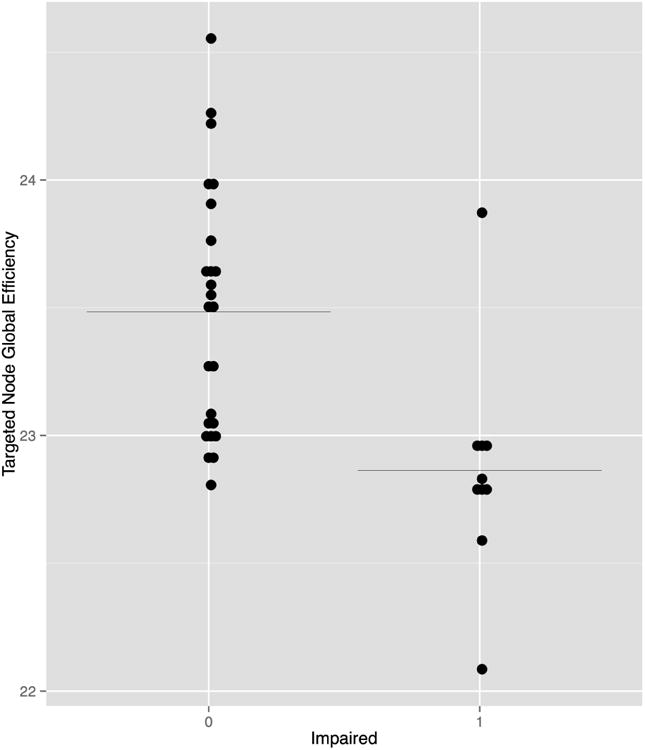
Breast cancer and its treatments are associated with mild cognitive impairment and brain changes that could indicate an altered or accelerated brain aging process. We applied diffusion tensor imaging and graph theory to measure white matter organization and connectivity in 34 breast cancer survivors compared with 36 matched healthy female controls. We also investigated how brain networks (connectomes) in each group responded to simulated neurodegeneration based on network attack analysis. Compared with controls, the breast cancer group demonstrated significantly lower fractional anisotropy, altered small-world connectome properties, lower brain network tolerance to systematic region (node), and connection (edge) attacks and significant cognitive impairment. Lower tolerance to network attack was associated with cognitive impairment in the breast cancer group. These findings provide further evidence of diffuse white matter pathology after breast cancer and extend the literature in this area with unique data demonstrating increased vulnerability of the post-breast cancer brain network to future neurodegenerative processes.

Keywords: Brain network; Breast cancer; Connectome; DTI; Graph theory; Network attack; Neurodegeneration.


Conflict of interest statement

Disclosure statement: The authors have no conflicts of interest.

Figures

Figure 1
Figure 1. Analysis Summary
Diffusion tensor imaging (DTI) volumes were first corrected for eddy current distortion. Tensor reconstruction was performed using the linear least-squares fitting method. Resultant fractional anisotropy (FA) maps were nonlinearly registered to a standard space FA template and then tract-based spatial statistics (TBSS) were conducted to determine voxel-wise differences in FA between groups. Deterministic tractography was performed using fiber assignment by continuous tracking. Regions of interest (ROIs) were transformed into DTI native space by first coregistering the T1 volume to the B0 volume. The coregistered T1 was then normalized to a standard space anatomic template and the inverse warp of this transformation (w′) was applied to the ROI images. The number of virtual fibers, or “streamlines”, connecting each pair of ROIs was determined resulting in a 90×90 weighted connectivity matrix for each participant. Graph theory analyses were applied to the weighted matrices to construct brain graphs for each participant consisting of nodes (regions) and edges (connections). Attack analyses involving targeted or random removal of nodes or edges were conducted to simulate a neurodegenerative process. The brain network's response to these attacks was measured using global and local efficiency. The area under the curve (AUC) for each of these response metrics was compared between groups.
Figure 2
Figure 2. Whole-brain Fractional Anisotropy (FA)
Results from Tract-based Spatial Statistics analysis demonstrating significantly lower FA in the breast cancer group compared to controls (p < 0.01, corrected). Color bar shows 1-p value.
Figure 3
Figure 3. Small-worldness
Both groups demonstrated a small-worldness brain network organization (i.e. small-worldness index > 1) across densities. The breast cancer (bc) group demonstrated significantly increased small-worldness index at minimum density (0.15) as well as across densities (p < 0.05, corrected) compared to controls (con).
Figure 4
Figure 4. Brain Graphs with Hub Profiles
Spheres represent nodes with size indicating degree. Hub regions are colored green. Gray lines represent edges which are shown here unweighted for illustration purposes. The breast cancer group (bc) showed hubs in bilateral superior frontal gyrus, bilateral insula, bilateral precuneus, bilateral supplementary motor area and right middle temporal gyrus. Controls (con) also showed hubs in bilateral superior frontal gyrus, bilateral insula, bilateral precuneus and bilateral supplementary motor area as well as bilateral precentral gyrus and bilateral fusiform. The log-log plot of cumulative degree distributions is shown to the right of each brain graph. The solid line indicates the exponentially truncated power-law curve fitted to the cumulative degree distribution of the networks (dotted line).
Figure 5
Figure 5. Brain Network Attack Tolerance
Compared to controls (con), the breast cancer group (bc) showed significantly lower tolerance to various targeted attacks on brain network nodes and edges as measured by both global and local efficiency. (A) Targeted node attack global efficiency, (B) targeted node attack local efficiency, (C) targeted edge attack global efficiency, (D) targeted edge attack local efficiency. Edge attacks were scaled to 1:90 to be more easily comparable visually with targeted attacks.
Figure 6
Figure 6. Predictors of Cognitive Impairment
Cognitive impairment (0 = not impaired, 1 = impaired) in the breast cancer group was associated with global efficiency AUC following targeted node attack (r = -0.605, p < 0.0001, uncorrected). Black line indicates the mean.

Similar articles

Cited by

References

    1. Achard S, Bullmore E. Efficiency and cost of economical brain functional networks. PLoS Computational Biology. 2007;3(2):e17. - PMC - PubMed
    1. Achard S, Salvador R, Whitcher B, Suckling J, Bullmore E. A resilient, low-frequency, small-world human brain functional network with highly connected association cortical hubs. J Neurosci. 2006;26(1):63–72. - PMC - PubMed
    1. Aghakhani A, Chan EK. Test Reviews: Bracken, B. A., & Howell, K. (2004). Clinical Assessment of Depression. Odessa, FL: Psychological Assessment Resources. Journal of Psychoeducational Assessment. 2007;25(4):416–22.
    1. Ahles TA. Brain vulnerability to chemotherapy toxicities. Psychooncology. 2012;21(11):1141–8. - PMC - PubMed
    1. Ahles TA, Saykin AJ, McDonald BC, Li Y, Furstenberg CT, Hanscom BS, Mulrooney TJ, Schwartz GN, Kaufman PA. Longitudinal Assessment of Cognitive Changes Associated With Adjuvant Treatment for Breast Cancer: Impact of Age and Cognitive Reserve. Journal of Clinical Oncology. 2010;28(29):4434–40. - PMC - PubMed

Publication types