. 2015 Jun 4;161(6):1425-36.
doi: 10.1016/j.cell.2015.05.012. Epub 2015 May 21.

DNA Demethylation Dynamics in the Human Prenatal Germline

Affiliations

DNA Demethylation Dynamics in the Human Prenatal Germline

Sofia Gkountela et al. Cell. .

Abstract

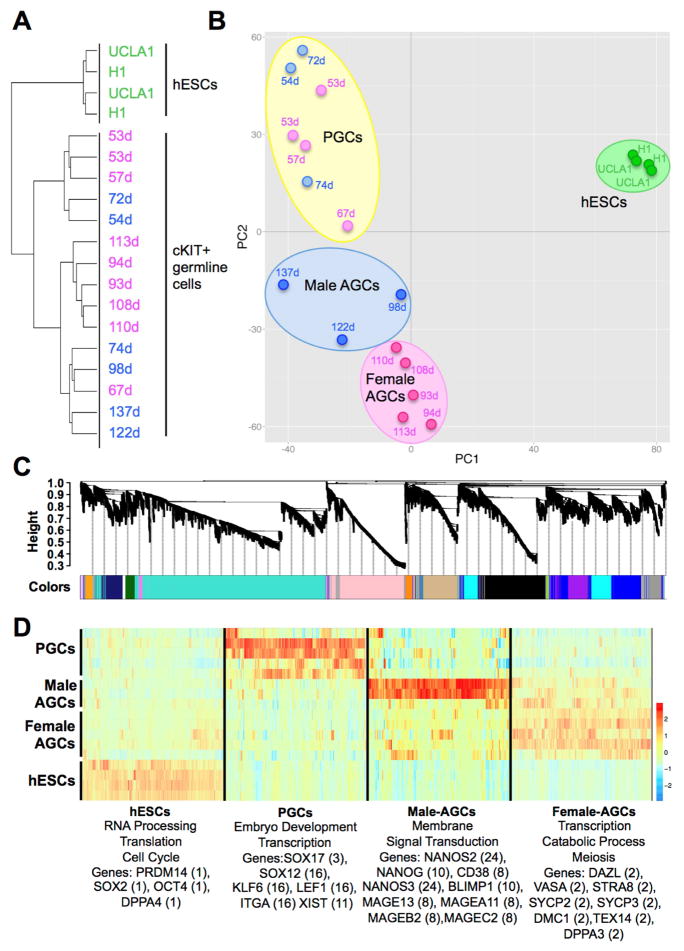
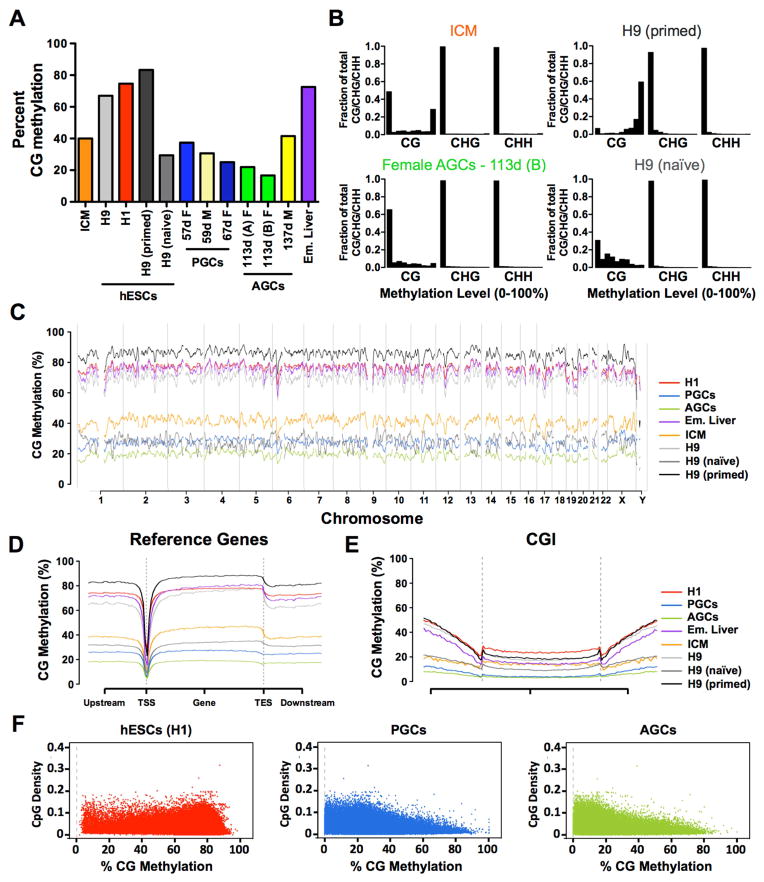
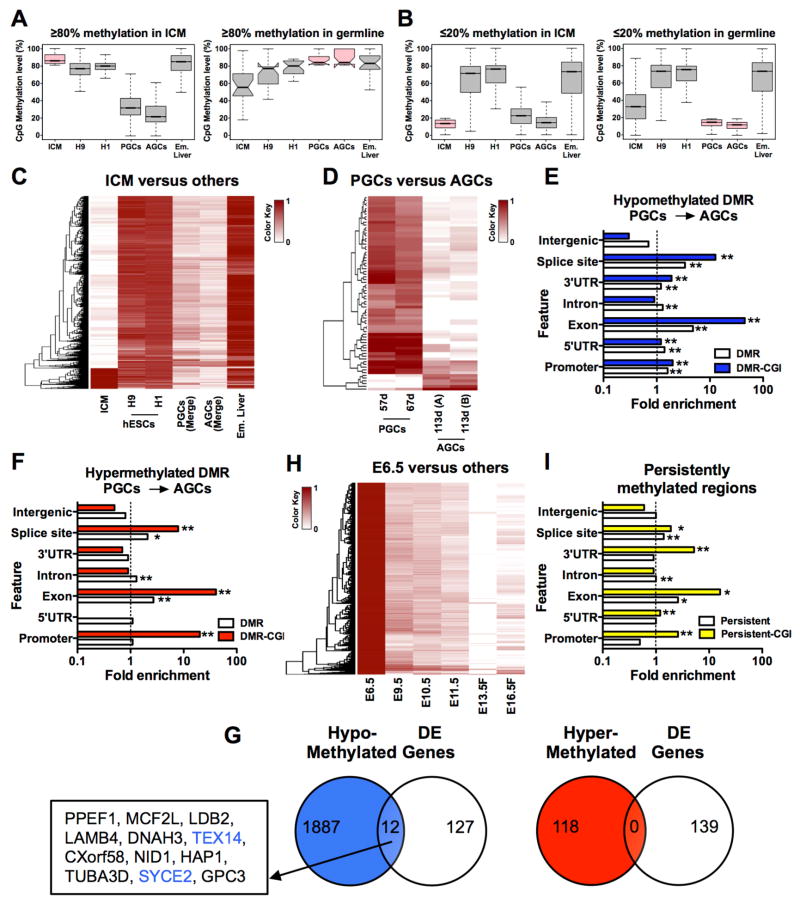
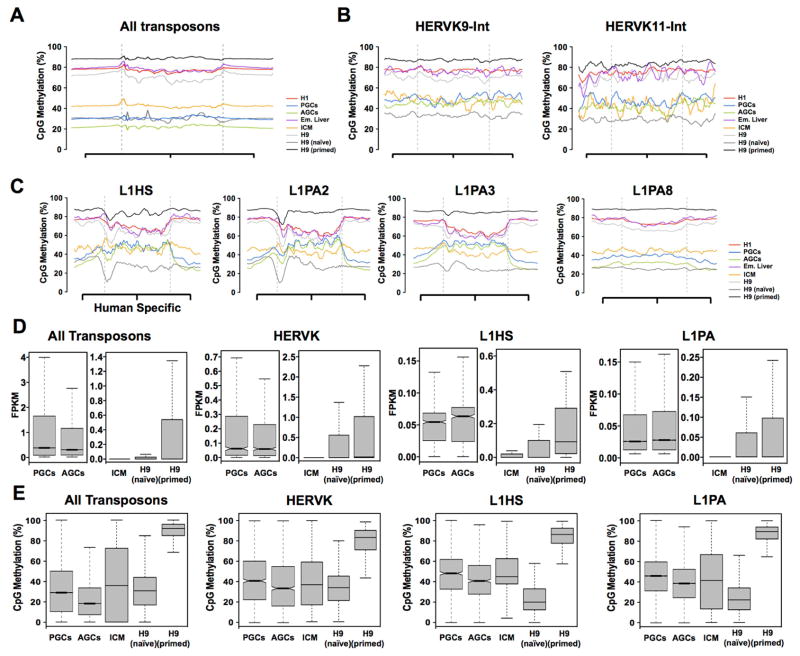
Global DNA demethylation in humans is a fundamental process that occurs in pre-implantation embryos and reversion to naive ground state pluripotent stem cells (PSCs). However, the extent of DNA methylation reprogramming in human germline cells is unknown. Here, we performed whole-genome bisulfite sequencing (WGBS) and RNA-sequencing (RNA-seq) of human prenatal germline cells from 53 to 137 days of development. We discovered that the transcriptome and methylome of human germline is distinct from both human PSCs and the inner cell mass (ICM) of human blastocysts. Using this resource to monitor the outcome of global DNA demethylation with reversion of primed PSCs to the naive ground state, we uncovered hotspots of ultralow methylation at transposons that are protected from demethylation in the germline and ICM. Taken together, the human germline serves as a valuable in vivo tool for monitoring the epigenome of cells that have emerged from a global DNA demethylation event.


Figures

Figure 1
Figure 1. Human germ cells are distinct from hESCs
(A) Unsupervised hierarchical clustering of hESCs and cKIT expressing germline cells isolated from human prenatal testes (blue) or ovaries (pink). Day (d) of prenatal development post fertilization is shown. (B) Principal component analysis. Each dot represents a sample. Blue = male, pink = female germline cells, green = hESCs. Germline samples separate into three clusters in PC2 including primordial germ cells (PGCs) and Advanced Germline Cells (AGCs), which are either male or female. (C) Weighted gene co-expression network analysis of hESC, PGC and AGC samples showing a hierarchical cluster tree of co-expression modules. Each module corresponds to a branch labeled by a distinct color shown underneath. (D) Heatmap showing relative expression of 6,583 genes in 4 representative modules across all samples. For each developmental window only the most highly correlated modules are shown with assigned biological names: hESCs (module 1), PGCs (module 16), Male AGCs (module 24) and Female AGCs (module 2). Representative gene ontology terms enriched in the highest correlated module are shown below, as well as representative hESC and germ cell-related genes found in the statistically significant modules for that group. The specific module is shown in parenthesis. See also Figure S1.
Figure 2
Figure 2. Female AGCs represent the most demethylated genomic state
(A) Average CpG methylation in human inner cell mass (ICM), hESCs, PGCs, AGCs and embryonic liver (Em. Liver). Age of male (M) and female (F) germline samples in days (d) postfertilization is shown. (B) Distribution of cytosine methylation in ICM and AGCs, H9 primed and H9 naïve hESCs. The x axis represents methylation levels binned in ten increments of 10% (ie 0–10%, 10–20% etc). y axis is fraction of total CG/CHG/CHH. (C) Average genome wide levels of CpG methylation across all chromosomes in 1Mb windows. PGCs = merged reads from 57- and 67-day germline cells, and AGCs = merged reads from 113-day germline cells, H9 primed and H9 naive = merged reads from 3 biological replicates. (D) Metaplot of CpG methylation at reference genes. TSS, transcription start site; TES, transcription end site. (E) Metaplot of CpG methylation at CpG Islands (CGI). (F) Correlation between CpG density and methylation for H1 hESCs; PGCs (merged) AGCs (merged). PGCs (Primordial Germ Cells), AGCs (Advanced Germ Cells), Em. (Embryonic), ICM (Inner Cell Mass). See also Figure S2.
Figure 3
Figure 3. Methylation reprogramming in vivo is dynamic in human and mouse
(A) Box plots showing fate of highly methylated CpGs (≥80% CpG methylation) in ICM (left panel) and germline cells (right panel). For ICM n = 8,850 hypermethylated windows of 5kb were identified. For PGC and AGC we identified n=21 hypermethylated 5kb windows. (B) Box plots showing hypomethylated windows (<20% CpG methylation) in ICM (left panel) and germline cells (right panel). For ICM n= 64,787 windows and for germline cells n=95,479 5kb-windows were identified. (C) Heatmaps showing methylation variable regions in 5kb windows with >80% methylation difference in ICM (n=9,072, FDR = 2.28%) relative to other samples. (D) Heat map of differentially methylated regions between PGCs and AGCs using 200bp windows (n= 1,049,420) with 3,456 regions (FDR <0.001%) identified (0.33% of the total number of windows). (E) Enrichment analysis of hypomethylated DMRs and (F) hypermethylated DMRs at indicated genomic features. Enrichment is accepted if fold enrichment is ≥1.0. DMRs and CGI-containing DMRs (DMR-CGI) are shown. * p <0.05, ** p<0.01. (G) Correlation of hypo- (left panel) and hyper-methylated (right panel) DMRs with differentially expressed (DE) genes reveals limited to no overlap. (H) Heatmaps showing methylation variable regions in 5kb windows with >80% methylation difference in E6.5 mouse epiblast (n = 499,541, FDR = 0.1 %). Female (F). (I) Identification of genomic features with persistent methylation (≥50% CpG methylation in 200 bp windows with >6 CpG sites per window). n= 67,817 windows meeting this criteria were in common between data sets resulting in the identification of n=1,471 persistently methylated windows (2.17%). For (C,D,H) Darker color indicates higher CpG methylation, white indicates absence of CpG methylation. FDR, false discovery rate estimated from simulated methylomes (see Methods). See also Figure S3.
Figure 4
Figure 4. Demethylation of transposable elements in naïve hESCs in vitro is less retained than germline cells and ICM
(A) Metaplot of all transposons irrespective of type exhibit DNA demethylation similar to the genome average. (B) Metaplots of CpG methylation across HERVK9-int and HERK11-int retrotransposons, showing that contrary to the average for the HERVK class, CpG methylation in PGCs and AGCs are comparable to ICM with H9 naïve cells exhibiting the lowest levels of CpG methylation. (C) Metaplots of CpG methylation for L1HS, L1PA2, L1P3 and L1PA8. Naïve hESCs exhibit the lowest levels of CpG methylation at this subfamily (area within the dashed grey line). This is particularly dramatic at the younger elements such as the Homo sapiens specific L1HS and the closely related L1PA2. (D) Box plots showing average RNA expression of transposons in PGCs, AGCs, ICM, H9 naïve and H9 primed hESCs as indicated. Average transposon expression is less than 1.0 FPKM. (E) Box plots showing CpG methylation of all transposons, HERVK, L1HS and L1PA elements in PGCs, AGCs, ICM, H9 naïve and H9 primed hESCs. See also Figure S4.
Figure 5
Figure 5. Protein expression of UHRF1 and DNMT3A in human germline
(A) Heatmap showing normalized expression of indicated genes in PGCs, AGCs and hESCs, H9 primed, H9 naïve and ICM. M=male, F=Female (B,C,F,G,I). Note that DNMT3L is enriched in the H9 naïve cells relative to the rest of the data sets where as SOX2 and UHRF1 are enriched in H9 primed cells. Representative immunofluorescence micrographs of UHRF1 (B,C,I), and DNMT3A (F,G,I) with germline markers cKIT or VASA in prenatal testes (B,F) and ovaries (C,G) at the developmental stage indicated in days and with pluripotency marker OCT4 in UCLA1 hESCs (I). Arrows indicate UHRF1 or DNMT3A signal. (D,E) Quantification of UHRF1 in cKIT+ or VASA+ germ cells in testes (D) and ovaries (E), at the developmental ages indicated days (d). (D) In testes for quantification in cKIT+, 14 optic fields were counted at the PGC stage from n=4 testes. For the AGC stage, 23 optic fields were counted from n=3 testes at 87–95 days and 28 optic fields from n=4 testes at 105–119 days of development. For quantification in VASA+, 12 optic fields were counted at the PGC stage from n=4 testes. For the AGC stage, 22 optic fields were counted from n=3 testes at 87–95 days and 25 optic fields from n=4 testes were counted at 105–119 days of development. e, In ovaries for quantification in cKIT+, 14 optic fields were counted at the PGC stage from n=3 ovaries. For the AGC stage, 13 optic fields were counted from n=3 ovaries at 70–95 days, 9 optic fields from n=3 ovaries at 105–116 days and 8 optic fields from n=2 ovaries at 126–130 days of development. For quantification in VASA+, 13 optic fields were counted at the PGC stage from n=3 ovaries. For the AGC stage, 15 optic fields were counted from n=3 ovaries at 70–95 days, 8 optic fields from n=3 ovaries at 105–116 days and 8 optic fields from n=2 ovaries at 126–130 days of development. For immunofluorescence microscopy, nuclei were counterstained with DAPI (blue). Scale bars, 10 um. Data are represented as mean±sem. Days (d), neg (negative). (H) Expression levels of TET1-3 in prenatal testes and ovaries from 53 days to 137 days (n= number of samples at each developmental stage). Also see Figure S5.

References

    1. Anders S, Huber W. Differential expression analysis for sequence count data. Genome Biol. 2010;11:R106. - PMC - PubMed
    1. Aramaki S, et al. A mesodermal factor, T, specifies mouse germ cell fate by directly activating germline determinants. Dev Cell. 2013;27:516–529. - PubMed
    1. Chan YS, Göke J, Ng JH, Lu X, Gonzales KA, Tan CP, Tng WQ, Hong ZZ, Lim YS, Ng HH. Induction of a human pluripotent state with distinct regulatory circuitry that resembles preimplantation epiblast. Cell Stem Cell. 2013;13:663–675. - PubMed
    1. Chen PY, Feng S, Joo JW, Jacobsen SE, Pellegrini M. A comparative analysis of DNA methylation across human embryonic stem cell lines. Genome Biol. 2011;12:R62. - PMC - PubMed
    1. Choi E, Kraus MR, Lemaire LA, Yoshimoto M, Vemula S, Potter LA, Manduchi E, Stoeckert CJ, Jr, Grapin-Botton A, Magnuson MA. Dual lineage-specific expression of Sox17 during mouse embryogenesis. Stem Cells. 2012;30:2297–2308. - PMC - PubMed

Publication types

Associated data