. 2015 Jun 8;33(5):522-34.
doi: 10.1016/j.devcel.2015.03.024. Epub 2015 May 21.

Mitotic Control of Planar Cell Polarity by Polo-like Kinase 1

Affiliations

Mitotic Control of Planar Cell Polarity by Polo-like Kinase 1

Rezma Shrestha et al. Dev Cell. .

Abstract

During cell division, polarized epithelial cells employ mechanisms to preserve cell polarity and tissue integrity. In dividing cells of the mammalian skin, planar cell polarity (PCP) is maintained through the bulk internalization, equal segregation, and polarized recycling of cortical PCP proteins. The dramatic redistribution of PCP proteins coincides precisely with cell-cycle progression, but the mechanisms coordinating PCP and mitosis are unknown. Here we identify Plk1 as a master regulator of PCP dynamics during mitosis. Plk1 interacts with core PCP component Celsr1 via a conserved polo-box domain (PBD)-binding motif, localizes to mitotic endosomes, and directly phosphorylates Celsr1. Plk1-dependent phosphorylation activates the endocytic motif specifically during mitosis, allowing bulk recruitment of Celsr1 into endosomes. Inhibiting Plk1 activity blocks PCP internalization and perturbs PCP asymmetry. Mimicking dileucine motif phosphorylation is sufficient to drive Celsr1 internalization during interphase. Thus, Plk1-mediated phosphorylation of Celsr1 ensures that PCP redistribution is precisely coordinated with mitotic entry.


Figures

Figure 1
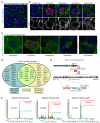
Figure 1. Mitosis-specific Celsr1 interactors and phosphorylation sites identified by mass spectrometry
(A) Single confocal section through basal layer of E15.5 whole mount backskins labeled with Celsr1 (green), phospho-histone H3, a marker of mitotic progression (pH3, red), and Hoechst (blue). Anterior is to the left. Note the anterior-posterior enrichment of Celsr1 at cell-cell contacts. (B) Representative images of Celsr1 localization in basal cells at indicated cell cycle stages, labeled as in (A). (C) Cultured keratinocytes stably expressing a truncated form of Celsr1, Celsr1ΔN-GFP (green), labeled with pH3 or survivin (red), and Hoechst (blue). Representative examples of the indicated mitotic stages shown. Note that upon mitotic entry, Celsr1 is internalized in bulk from the cell surface. Celsr1-containing endosomes are held within the cytoplasm throughout metaphase and anaphase and recycled to the surface upon cytokinesis. Scale bars, 10 µm. (D) Venn diagram shows selected Celsr1-associated proteins enriched in synchronized (blue), asynchronous (yellow), or both populations of keratinocytes (green) as identified by coimmunoprecipitation and MS. Selected proteins (including Plk1) displayed the highest number of spectral counts compared to controls, excluding metabolic enzymes and ‘housekeeping’ proteins. See Tables S1 and S2 for complete list. (E) Schematic of Celsr1 and Celsr1ΔN protein domain structure, with the C-terminal cytosolic domain expanded below. Black lines represent phosphorylated S/T residues in Celsr1ΔN-GFP identified by MS. See Tables S3 and S4 for complete list. The dileucine motif (turquoise, sequence shown below) is surrounded by six S/T residues, three of which (S2741, T2750, and S2752, red lines) were differentially phosphorylated in mitosis. (F) Extracted ion chromatograms of phosphopeptides containing S2741, T2750, and S2752 from synchronous and asynchronous samples are shown overlaid following normalization by the intensities of their non-phosphorylated analogues present in each LC/MS run. R value = normalized ratio of phosphopeptide abundance in synchronous vs. asynchronous cells. See Table S4 and Figure S1 for MS1 and MS/MS spectra.
Figure 2
Figure 2. Plk1 localizes to Celsr1-containing endosomes during mitosis
(A) Keratinocytes were cotransfected with plasmids encoding Plk1-YFP (green) and Celsr1ΔN-Flag (red). Nuclei were labeled with Hoechst (blue). Representative images at the indicated stages of mitosis are shown. Insets show 2x magnified single and merged channels. Celsr1 and Plk1 co-localize at endosomes during prophase, metaphase, and anaphase/telophase. By cytokinesis, the two proteins no longer co-localize. (B) Time-lapse images from Plk1-YFP (green) and ECad-Celsr1ΔN-mCherry (red) coexpressing keratinocyte. Insets show magnified single channels. Top panels: prophase to metaphase. Bottom panels: telophase to cytokinesis. Note that Plk1 dissociates from Celsr1-containing endosomes during cytokinesis. See also Movies S1 and S2. (C) Endogenous Plk1 colocalizes with Celsr1 in mitosis. Anti-Plk1 polyclonal antibody (red) labels Celsr1-ΔN-GFP puncta (green). (D) Mitotic keratinocyte expressing Plk1-YFP (green) and Celsr1ΔN-Flag (red) in early prophase imaged by TIRF microscopy. The two fluorescent proteins colocalize at surface puncta at the earliest stages of mitosis. Scale bars, 10 µm
Figure 3
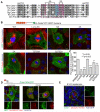
Figure 3. Plk1 interacts with Celsr1 via a conserved polo-box domain (PBD) binding motif and directly phosphorylates Celsr1
(A) Schematic of Celsr1 domain structure with the PBD-binding motif (consensus S-pT-P) highlighted in yellow. Mutations were generated in GFP-tagged, chimeric proteins between E-Cadherin (extracellular and transmembrane domains, orange) and the cytoplasmic domain of Celsr1, as diagrammed below. E-Celsr1CTΔ2855-3034 lacks the PBD and 180 C-terminal amino acids. E-Celsr1CTΔ2875-3034 retains the PBD but lacks the C-terminal 160 amino acids. E-Celsr1CTT2864A and Celsr1ΔNT2864A substitute alanine for the phosphorylated threonine in the PDB domain. (B) Phenotypic analysis of PBD mutants as indicated in Figure 3A. Note that deletion of the PBD or alanine substitutions within the PBD impair Celsr1 endocytosis during mitosis. Mean percent colocalization between the E-Celsr1CT mutants and wildtype Celsr1(co-transfected Celsr1ΔN-flag) during mitosis, calculated as M1 coefficients . n=8-14 mitotic cells for each mutant (student's t-test, error bars denote ±SEM). (C) Alignment of amino acids 2,838 to 2,866 of the cytosolic domain of mouse Celsr1. The PBD is highlighted in pink and is highly conserved amongst vertebrates and in Drosophila. (D) Coimmunoprecipitation of Plk1-GFP and E-Celsr1CT. Keratinocytes were transfected with expression vectors encoding Plk1-GFP and either wildtype or PBD mutant E-Celsr1CT-Flag. Reciprocal immunoprecipitations were performed from cell lysates as indicated. Coimmunoprecipitates were separated by SDS-PAGE and western blots were performed with the antibodies indicated. Note the reduced interaction between Plk1-GFP and E-Celsr1CT when the PBD is mutant (T2864A). (E) Plk1 phosphorylates Celsr1. Kinase assay between purified Plk1 and GST alone or GST-Celsr1CT, as indicated. Representative autoradiograph of incorporated γ32P-ATP shown. Plk1 phosphorylation sites on the Celsr1 cytoplasmic tail were identified by MS. Plk1 phosphorylated 5 S/T residues surrounding Celsr1’s endocytic motif plus 9 additional sites. See also Table S5. Scale bars=10 µm
Figure 4
Figure 4. Plk1 is essential for mitotic internalization
(A) Keratinocytes stably expressing Celsr1ΔN-GFP were treated for 8 h with mitotic kinase inhibitors or DMSO as indicated. Representative images of inhibited cells are shown. Both Aurora A/B and Plk1 inhibitors arrest cells in prometaphase. Whereas Celsr1 internalization proceeds normally upon treatment with VX-680, internalization is blocked upon Plk1 inhibition (B) Quantification of the percentage of mitotic keratinocytes containing Celsr1 endosomes treated with DMSO or inhibitor of kinase indicated. Plk1 inhibition blocks internalization completely (C) Plk1 inhibition does not block transferrin internalization (red), which accumulates normally in BI2536-arrested cells. (D-E) Analysis of clathrin-coated pit formation upon Plk1 inhibition. (D) Celsr1ΔN-GFP (green) keratinocytes coexpressing µ2-mRFP (red), were imaged by TIRF microscopy. Separate channels are shown to the right of the merged images. Control cells in mitosis (DMSO) display characteristic bright Celsr1-puncta at the cell surface that co-localize with µ2-mRFP (left panel). In Plk1-inhibited mitotic cells (300 nM BI2536, 3 h), Celsr1ΔN-GFP fails to coalesce into punctate structures at the cell surface and remains uniformly localized similar to the surrounding interphase cells. Note that µ2-mRFP still forms cell surface puncta in the presence of BI2536. Widefield image of the same Bl2536-treated cell is shown to the right confirming the imaged cell was in mitosis. (E) TIRF images of control and Plk1 inhibited (300 nM BI2536, 3 h) keratinocytes in mitosis coexpressing Celsr1ΔN-GFP (green) and clathrin-dsRed (red). Whereas clathrin puncta form normally at the surface of Plk1-inhibted cells, Celsr1 is not recruited to them. Widefield image of the same Bl2536-treated cell labeled with pH3 (blue) confirms the cell was in mitosis. See also Movie S3. Scale bars=10 µm
Figure 5
Figure 5. Ex vivo Inhibition of Plk1 inhibits PCP mitotic internalization and impairs Celsr1 asymmetry
Backskin explants from E14.5 embryos were cultured and treated with (A) DMSO, (B) Aurora A/B inhibitor VX680 or (C) Plk1 inhibitor BI2536 for 4 h. Representative images of interphase and mitotic cells are shown. A majority of cells arrest in mitosis upon both Plk1 and Aurora A/B inhibition. Note that while VX680-treated mitotic cells internalize Celsr1, the mitotic cells treated with BI2536 display aberrant cortical Celsr1 localization, here classified broadly as bipolar, unipolar, or non-polar. This is different from the obvious anterior-posterior localization of Celsr1 seen in interphase cells. (D Percentage of mitotic cells containing Celsr1 endosomes in explants treated with DMSO (n=54), Plk1 inhibitor (n=388) or Aurora inhibitor (n=269) (E) Roseplots of Celsr1 pixel intensities and angles in interphase (n=86) versus mitotic (n=76) cells in Plk1-inhibited explants. Note that mitotic cells display a more uniform distribution of Celsr1 around the cell perimeter than interphase cells (F) Angular distribution of Celsr1 polarity in interphase cells bordering mitotic cells in DMSO (n=183) and BI2536-treated (n=218). The anterior-posterior axis is horizontal and anterior is to the left. Scale bars=10 µm
Figure 6
Figure 6. Celsr1 phosphorylation during mitosis is required for its mitotic internalization
(A) Alignment of the cytosolic domain (R2724-T2765) of mouse Celsr1 and other indicated species. The dileucine and surrounding S/T residues are highly conserved across vertebrates. Asterisks denote residues targeted for mutagenesis. The dileucine is highlighted in blue, and phosphorylated S/T residues are shaded in pink (B) Mutagenesis of S/T residues. Keratinocytes were transfected with E-Celsr1CT constructs as indicated. Spindles labeled with β-tubulin (red) and nuclei labeled by Hoechst (blue). Mutations targeting S/T residues surrounding the dileucine motif are indicated above representative images. E-Celsr1CT-6A contains alanine mutations corresponding to amino acids S2741, T2743, T2744, T2747, T2750, and S2752 in full length Celsr1. E-Celsr1CT-4A is mutated to alanine at positions corresponding to S2741, T2743, T2744, and T2747. E-Celsr1CT-2A contains alanine mutations at positions corresponding to T2750, and S2752. (C) Quantification of colocalization (M1 coefficients averaged across 16-25 mitotic cells for each mutant) between S/T mutants and wildtype Celsr1 during mitosis, as described in Figure 3. Student's t-test, error bars denote ±SEM. Note that internalization is most strongly inhibited in the 6A and 2A mutants. (D) Localization of phospho-T2750 Celsr1. A Celsr1 phospho-specific polyclonal antibody was raised against peptides containing phospho-T2750. Keratinocytes stably expressing Celsr1ΔN -GFP were immunolabeled with purified anti-phospho-T2750 (red) and Hoechst (blue). (E) Whole mount backskin from K14-H2BGFP transgenic E14.5 embryo labelled with anti-phospho-T2750 (red) and Celsr1 (green) antibodies. A single confocal plane through the basal layer is shown. Note that the phospho-specific antibody labels Celsr1 endosomes in mitosis, but not cortical Celsr1 during interphase or in Plk1-inhibited mitotic cells. Scale bars, 10 µm
Figure 7
Figure 7. Phosphomimicking mutations uncouple Celsr1 internalization from mitosis
Serine or threonine residues surrounding the dileucine motif were mutated to glutamic acid in Celsr1ΔN-GFP (green) as indicated. (A) Interphase keratinocytes transfected with the indicated phosphomimicking mutants. Nuclei labeled by Hoechst (blue). Whereas both wildtype Celsr1 and 2E mutant display smooth plasma membrane localization during interphase, the 6E mutant accumulates in punctate structures. (B) Confocal image of interphase keratinocytes co-expressing the early endosome marker Rab5-dsRed (red) and Celsr1ΔN6E-GFP (green) showing colocalization during interphase. (C) Interphase keratinocytes co-expressing clathrin-dsRed (red) and Celsr1ΔNWT-GFP or Celsr1ΔN6E-GFP (green) were imaged by TIRF microscopy. Interphase Celsr1ΔN6E-GFP puncta colocalize with clathrin-dsRed at the cell surface. Quantification of clathrin-positive puncta seen by TIRF on the cell surface of interphase cells expressing wildtype Celsr1 (n=8) and Celsr1ΔN6E-GFP (n=10). See also Movie S4. (D) Localization of Celsr1ΔN6E-GFP in mitosis. Keratinocytes cotransfected with Celsr1ΔN6E-GFP (green) and Celsr1ΔNWT-flag (red) in the presence (300 nM BI2536, 6 h) or absence (control) of Plk1 inhibitor. Whereas Celsr1ΔNWT-flag mitotic internalization is Plk1-dependent, Celsr1ΔN6E-GFP remains punctate even in the presence of BI2536. Scale bars, 10 µm.

Comment in

  • Planar Pol(o)arity.
    Sedzinski J, Wallingford J. Sedzinski J, et al. Dev Cell. 2015 Jun 8;33(5):494-5. doi: 10.1016/j.devcel.2015.05.022. Dev Cell. 2015. PMID: 26058051

References

    1. Aigouy B, Farhadifar R, Staple DB, Sagner A, Röper JC, Jülicher F, Eaton S. Cell Flow Reorients the Axis of Planar Polarity in the Wing Epithelium of Drosophila. Cell. 2010;142:773–786. - PubMed
    1. Axelrod JD. Unipolar membrane association of Dishevelled mediates Frizzled planar cell polarity signaling. Genes Dev. 2001;15:1182–1187. - PMC - PubMed
    1. Barr FA, Sillje HH, Nigg EA. Polo-like kinases and the orchestration of cell division. Nat Rev Mol Cell Biol. 2004;5:429–440. - PubMed
    1. Bastock R, Strutt H, Strutt D. Strabismus is asymmetrically localised and binds to Prickle and Dishevelled during Drosophila planar polarity patterning. Development. 2003;130:3007–3014. - PubMed
    1. Chen WS, Antic D, Matis M, Logan CY, Povelones M, Anderson GA, Nusse R, Axelrod JD. Asymmetric homotypic interactions of the atypical cadherin flamingo mediate intercellular polarity signaling. Cell. 2008;133:1093–1105. - PMC - PubMed

Publication types

MeSH terms

Substances

LinkOut - more resources