. 2015 Jun 9;4(6):1075-88.
doi: 10.1016/j.stemcr.2015.04.013. Epub 2015 May 21.

hESC Differentiation toward an Autonomic Neuronal Cell Fate Depends on Distinct Cues from the Co-Patterning Vasculature

Affiliations

hESC Differentiation toward an Autonomic Neuronal Cell Fate Depends on Distinct Cues from the Co-Patterning Vasculature

Lisette M Acevedo et al. Stem Cell Reports. .

Abstract

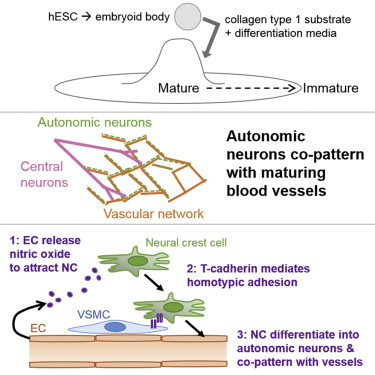
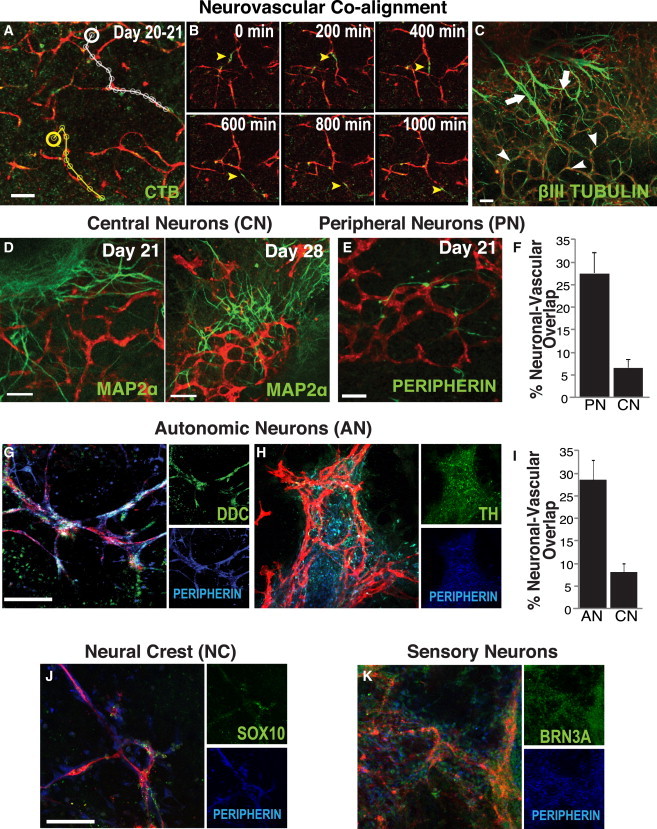
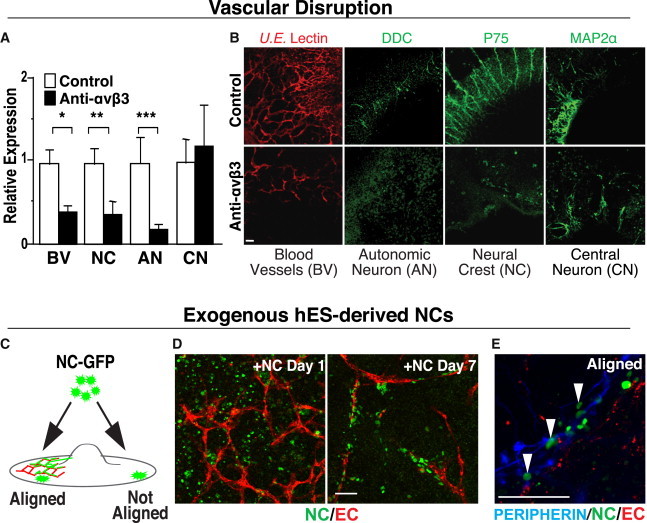
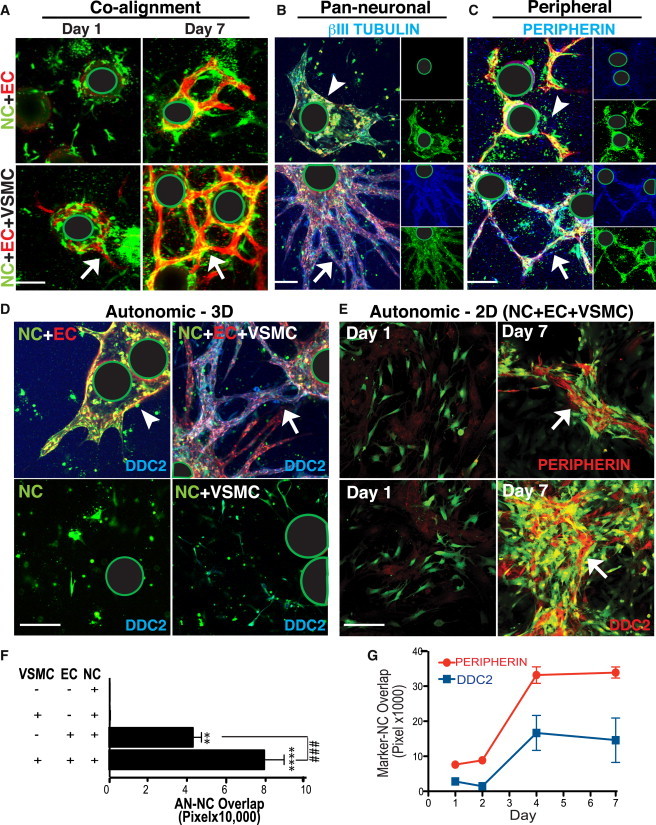
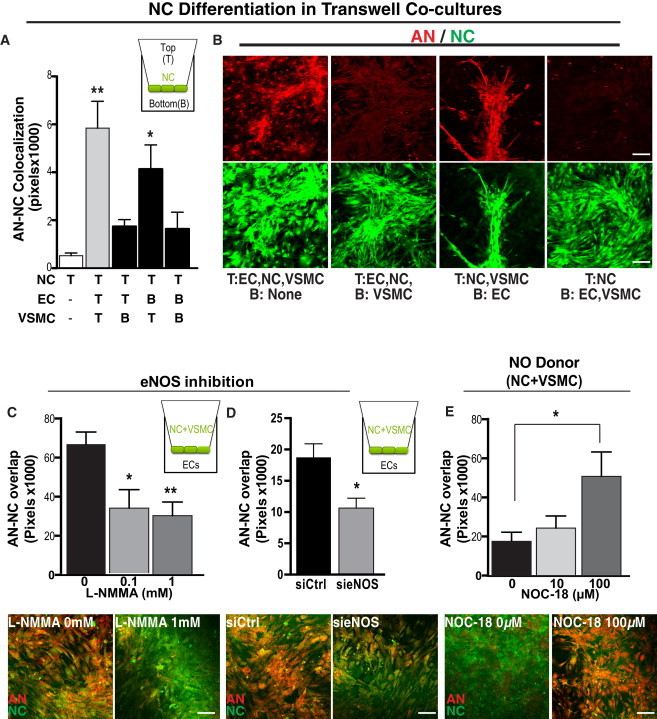
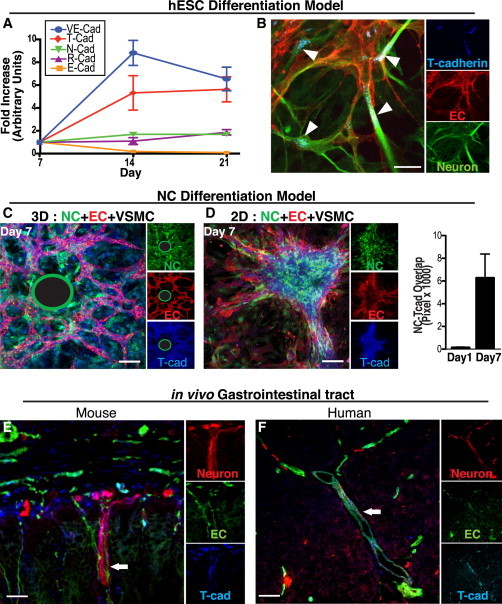
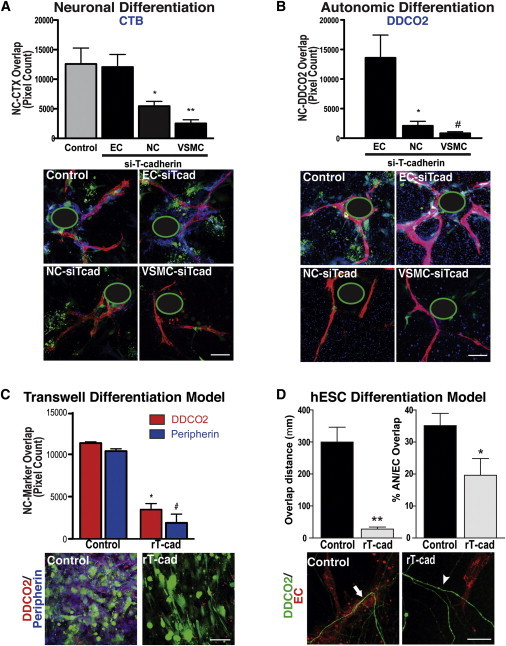
To gain insight into the cellular and molecular cues that promote neurovascular co-patterning at the earliest stages of human embryogenesis, we developed a human embryonic stem cell model to mimic the developing epiblast. Contact of ectoderm-derived neural cells with mesoderm-derived vasculature is initiated via the neural crest (NC), not the neural tube (NT). Neurovascular co-patterning then ensues with specification of NC toward an autonomic fate requiring vascular endothelial cell (EC)-secreted nitric oxide (NO) and direct contact with vascular smooth muscle cells (VSMCs) via T-cadherin-mediated homotypic interactions. Once a neurovascular template has been established, NT-derived central neurons then align themselves with the vasculature. Our findings reveal that, in early human development, the autonomic nervous system forms in response to distinct molecular cues from VSMCs and ECs, providing a model for how other developing lineages might coordinate their co-patterning.


Figures

None
Graphical abstract
Figure 1
Figure 1
Two Neuronal Populations Emerge from the Neuroectoderm, but Only Peripheral Neurons Initially Co-align with Developing BVs (A) ECs (U.E. lectin, red) and neuronal cells (cholera toxin [CTB], green) co-align. From Movie S1, the tracks of two representative neuronal cells (yellow and white lines) are illustrated migrating along vascular networks from a set starting point (yellow and white circles). (B) Shown are “snapshots” of association from days 20 to 21 at time points 0, 200, 400, 600, 800, and 1,000 min. Arrowheads denote neurons migrating along vessels. (C–K) At day 21, there are two distinct populations of βIII tubulin+ neurons (green). One is associated with vascular networks (arrowheads); the other is independent of the vasculature (arrows). These are better distinguished in (D)–(K). CNs derived from the NT (MAP2α, green) do not co-align with the vasculature (U.E. lectin, red) at day 21 (D, left); neurites from those neurons pursue a course largely independent of the vessels. The neurons that do co-align with vessels (U.E. lectin, red) at day 21 express the peripheral neuron (PN) marker peripherin (green) (E). Only after PNs begin to form a neurovascular pattern do central neurites begin to comport to that pattern (day 28) (D, right). (F) Co-localization of vasculature (U.E. lectin) with PNs (peripherin+) is 3.9-fold greater than with CNs (MAP2α+) (n = 9 images per group from three independent experiments). (G and H) These peripherin+ (blue) neurons come to express the autonomic marker DDC (G, green) and TH (H, green). (Nuclei expressing the early autonomic transcription factor MASH1 in proximity with the vessels [Figure S1K] confirm that the cells themselves, and not just the processes of these incipient ANs, juxtapose with vessels). (I) Co-localization of vasculature (U.E. lectin) with NC-derived ANs (DDC+) is 4-fold greater than with NT-derived CNs (MAP2α+) (n = 10 images per group from three independent experiments). (J) Co-aligning neurons express SOX10 (green), confirming that they are NC derived. (K) Some express the sensory marker BRN3A (green), an alternative NC-derived PN phenotype (see text for caveats on emergence of this cell type). Scale bar represents 100 μm for all images. See Figure S1 for a description of the hESC differentiation model.
Figure 2
Figure 2
Newly Forming BVs Are Necessary for Promoting NC Differentiation toward an AN Fate, but Not for the Emergence of CNs (A and B) For “loss-of-function” studies, hESC cultures were treated with an integrin ανβ3 function-blocking antibody LM609 (which disrupts vascular development) or with a control IgG antibody and then stained for the presence of BVs (U.E. lectin, red), NC (p75, green), ANs (DDC, green), and CNs (MAP2α, green). Disruption of vascular development compromises NC-derived AN differentiation or survival but has no impact on NT-derived CNS neurons. (A) The staining pixel area of hESC cultures was quantitated using Image J (left) (n = 6 images per group from three independent experiments, p = 0.005, ∗∗p = 0.023, ∗∗∗p = 0.034, error bars are ± SEM). (B) Representative images of hESC cultures treated with control (top, right) or with the integrin ανβ3 function blocking antibody LM609 (bottom, right). (C) Schematic for one of the “gain-of-function” studies, illustrating the addition of H2B-GFP-labeled hESC-derived NC (NC-GFP) to the hESC-derived vascular culture system at day 21. After 7 days, NCs that came in contact with BVs co-aligned and differentiated, whereas NCs that came into contact with non-vascularized areas failed to align and differentiate. (D) Representative images of exogenously added NC-GFP cells (green) to the hESC differentiation model and their relation to vascular structures (U.E. lectin, red)—immediately after plating on day 1 (left) and after 7 days (right), during which interval the NCs-GFPs have aligned with the vasculature. (E) NCs (green), aligned with BVs (U.E. lectin, red), differentiated along a PN lineage (peripherin, blue) (arrowheads), while NCs that attached in avascular areas did not. See Figure S2 for the converse experiment, the adverse effect of NC disruption on vascular development, and maturation. Scale bar represents 100 μm for all images.
Figure 3
Figure 3
Exogenously Added NCs Align with Vasculature to Assume an AN Fate if a VSMC Coating Is Present (A) hESC-derived NCs (DiI, green) embedded into 3D fibrin gels with EC (U.E. lectin, red)-coated beads co-align starting at day 1 (left, white arrow) becoming quite robust at day 7 (right, white arrow). (Note the green-encircled black regions in images represent the location of the Cytodex beads upon which ECs were coated [see Experimental Procedures].) Co-alignment of NCs with newly forming vessels occurs independently of the addition of VSMCs (top left), although the latter are required for robust vascular tube formation (bottom left, red). (B and C) Cells, under the various experimental conditions shown in (A), were stained for the co-expression of neuronal markers. Each large panel shows a merged image; the insets show the markers in separate channels. NCs (green) on VSMC-coated vessels (bottom panels) expressed (B) the pan-early neuronal marker βIII tubulin (blue) and (C) the PN marker peripherin (blue), much more strongly (white arrows) compared, respectively, to that seen in NCs cultured with ECs alone [top, B and C, white arrowheads], demonstrating a greater degree of neuronal marker upregulation when NCs were in the presence of both ECs and VSMCs (white arrows). (D) The AN marker DDC (blue) is strongly upregulated in NCs (DiI, green) aligning with VSMC-coated vessels (U.E. lectin, red) (top right, white arrow), as compared to non-VSMC coated vessels (top left panel, white arrowhead), to NCs alone (bottom left), and to NCs co-cultured with only VSMCs (No ECs) (bottom right). (E) NCs (green) plated in 2D on ECs and VSMCs (Day 1, left panels) strongly expressed peripherin (red) (top right, white arrow) as well as DDC (red) (bottom right panel, white arrow) by Day 7. Scale bar represents 100 μm. (F) Quantitation of co-localization (pixel overlap) of labeled NCs (green) and DDC expression (red), demonstrating that NCs expressed DDC (presumably differentiated into ANs) most robustly when in the presence of both VSMCs and ECs. 94.9% ± 6.0% of DDC+ NC-derivatives were peripherin+ (data not shown). Data presented as mean ± SEM. A one-way ANOVA with Tukey’s post-test was used to determine the difference in DDC staining among the following conditions: “NC only” (control) (n = 5 wells, 2 independent experiments), “EC+NC” (n = 8 wells, 4 independent experiments), “VSMC+NC” (n = 4 wells, 2 independent experiments), and “EC+VSMC+NC” (n = 9 wells, 4 independent experiments). ### indicates p = 0.0024 for EC+NC versus EC+VSMC+NC. (G) Time course of AN differentiation, as determined by the co-expression (pixel overlap) of peripherin (red) or DDC (blue) and NCs (green) on days 1–7 (n = 10 images, 6 wells per group, 2 independent experiments). Expression of both peripherin and DDC peaks at day 4 and persists through day 7. Data presented as mean ± SEM. A one-way ANOVA with Tukey’s post-test was used to determine statistical significance. See Figure S3 for further data showing that exogenously added NCs align with vasculature to assume an AN fate only if VSMCs and ECs are present.
Figure 4
Figure 4
NC Differentiation toward an AN Lineage Requires Both EC-Produced NO and Direct Contact with VSMCs (A and B) Direct contact between NC (DiI, green) and VSMCs is required for differentiation toward an AN lineage (DDC, red). (A) Quantitation of NC differentiation toward DDC+ neurons (AN), as measured by co-localization (pixel overlap) of NC and DDC staining, when NCs are cultured in the top (T) chamber and ECs and/or VSMCs are cultured in either the top chamber (allowing cell-cell contact with the NCs) or bottom (B) chamber, allowing exposure of the NCs to only diffusible factors (diagramed in inset). Data presented as mean ± SEM. A one-way ANOVA with Dunnett’s post-test was used to determine statistical significance from the NC only group (n = 6 wells, three independent experiments). ∗∗p < 0.01, p < 0.05. (B) Representative images of NCs co-cultured as described. The top are images of cells stained for the AN marker DDC. The bottom are images of NCs expressing DiI (green). (C–E) EC-derived NO promotes AN differentiation, defined by an upregulation of DDC, as determined by loss-of-function (C and D) and gain-of-function (E) experiments. (C) DDC expression (red) decreased when NO production is inhibited. (Top) Quantitation of NC differentiation toward DDC+ neurons after 5 days in co-culture (measured as above) when NCs and VSMCs are co-cultured in the top (T) chamber and ECs treated with L-NMMA (an inhibitor of NO production added to only the bottom chamber 1 hr prior to the addition of NCs and VSMCs) are cultured in the bottom (B) chamber (schematized in inset). Data presented as mean ± SEM. A one-way ANOVA with Dunnett’s post-test was used to determine statistical significance from control group (n = 9 wells, three independent experiments). p = 0.0494 ∗∗p = 0.016. (Bottom) Representative images of co-cultures treated with either vehicle or L-NMMA (1 mM). (D) DDC expression (red) decreased when eNOS was knocked down. (Top) Quantitation of NC differentiation toward DDC+ neurons after 5 days in transwell co-cultures as described above (and schematized in inset). ECs were treated with 5 nM si-eNOS or control siRNA 12 hr prior to co-culture. Data are presented as mean ± SEM. A two-tailed Student’s t test was used to determine statistical significance from si-Ctrl group (n = 5 wells, three independent experiments). p = 0.0016. (Bottom) Representative images of co-cultures treated with either siRNA control or si-eNOS (5 nM). (E) The NO donor NOC-18 increases AN differentiation (DDC+) of NCs when cultured with VSMCs but without ECs. (Top) Quantitation of NC differentiation toward DDC+ neurons (as described above). Data are presented as mean ± SEM. A one-way ANOVA with Dunnett’s post-test was used to determine statistical significance from control group (n = 9 wells, three independent experiments). p = 0.0158. (Bottom panel) Representative images of co-cultures treated with either control (0 μM) or NOC-18 (100 μM). Scale bar represents 100 μm for all images. See also Figure S4.
Figure 5
Figure 5
T-CAD Is Expressed by Both Neurons and BVs at Peak Differentiation and Co-alignment (A) Q-PCR analysis of cadherin gene expression in the hESC differentiation model. T-CAD (red diamonds) expression is upregulated by day 14, when co-patterning is observed and when VE-cadherin (an EC marker) expression is highest (n = 2 replicates, two independent experiments). (B) T-cad (blue) staining in the hESC differentiation model. T-cad is expressed on both ECs (U.E. lectin, red) and neurons (βIII-tubulin, green) at day 21. Arrowheads denote T-cad localized to EC/neuronal junctions. Scale bars represent 25 μm. (C and D) T-cad (blue) is expressed in NCs (green) only when cultured with both ECs (U.E. lectin, red) and VSMCs in our NC differentiation model. This was observed in 3D (C) and 2D (D). (The green-encircled black regions represent the location of the Cytodex beads upon which ECs were coated in the 3D fibrin gel system; see Supplemental Experimental Procedures). (D, right) Quantitation of NC (green) co-localization with T-CAD staining (blue) (based on overlap of pixels) increasing over time (n = 5 images, two independent experiments). Data are presented as mean ± SEM. Scale bar represents 100 μm. (E) Immunostaining of mouse GI tract for T-cad (blue) on ECs (CD31, red) and neurons (L1, green). (F) Immunostaining of human GI tract for T-cad (blue) on ECs (U.E. lectin, red) and neurons (βIII tubulin, green). White arrow in both the mouse (E) and human (F) gut indicates an example of the typical close juxtaposition of NC-derived enteric neurons and vasculature seen with T-cad expression interposed between the two lineages. Scale bar represents 25 μm. See Figure S5 to observe the loss of neurovascular co-patterning in the gut of the T-cad KO mouse with consequent reduction of NC-derived neurons leading to a condition known clinically as a Hirschsprung’s (reduced ganglionic) phenotype. In (C)–(F), the large panel is a merged image of the three markers shown individually as insets at the right of each figure.
Figure 6
Figure 6
T-cadherin, Expressed by NCs and VSMCs, Mediates NC Co-alignment and Direct Contact with VSMCs, a Requirement for AN Differentiation (A and B) T-CAD knockdown in NCs and VSMCs (with siRNA against T-cad [siTcad]) decreased NC (DiI, green) differentiation toward a (A) neuronal fate (CTB, blue) and (B) an AN fate (DDC, blue), as measured by co-localization (overlap of pixels) of NC and marker immunostaining. Knockdown in ECs had no effect. Data are presented as mean ± SEM (A, top). For CTB, a one-way ANOVA with Dunnett’s post-test was used to determine statistical significance from the control “NC only” group (n = 8 images) (n = 11 images for each siTcad-treated group, p = 0.0164, ∗∗p = 0.0006). (B, top) For DDC, a one-way ANOVA with Tukey’s post-test was used to determine statistical significance from the “NC only” group (n = 8 wells) (n = 11 with three replicates for each siTcad treated group, p = 0.0337, #p = 0.0262). Data are pooled from three independent experiments done in triplicate. (A and B, bottom) Representative images of staining for CTB or DDC. Scale bar represents 100 μm. Note that, with the loss of T-cad in NCs and VSMCs, though not in ECs, as a result of siTcad, expression of CTB (blue in A) and DDC (blue in B) is significantly reduced. (The green-encircled black regions represent the location of the Cytodex beads upon which ECs were coated in the 3D fibrin gel system; see Methods). For all experiments, siTcad efficiency was established through real-time PCR by isolating RNA from non-embedded excess cells 48-hr post transfection (Figure S6A). (C) In the transwell differentiation culture system schematized in Figure 4, addition of recombinant T-cad (rT-cad, 1 μg/ml), which binds and inhibits T-cad homotypic interaction, to NCs and VSMCs (top chamber), with ECs in the bottom chamber, inhibited NC differentiation toward an AN fate. (Top) Quantitation of DDC (red) and peripherin (blue) staining in NCs (DiI, green) (judged by degree of pixel overlap), treated with control (n = 6 transwells) or rT-cad (n = 5 transwells). Data are presented as mean ± SEM and are pooled from three separate experiments. A two-tailed Student’s t test was used to determine statistical significance. p < 0.0001, # p < 0.0001. (Bottom) Representative images of transwells. Scale bar represents 100 μm. (D, top) Percentage of DDC (green) and U.E. lectin (red) overlap (right histograms) and length of contact/overlap between ECs and ANs (left histograms) in each image from our hESC differentiation model. A two-tailed Student’s t test was used to determine statistical significance. p = 0.038, ∗∗p = 7.5e-6, error bars are ± SEM; n = 9 images per group from three independent experiments. (Bottom) Representative high magnification images of degree of DDC (green) alignment with ECs (U.E. lectin, red) in hESC cultures treated with control versus rT-cad. Scale bar represents 100 μm. Note that, in contrast to control conditions (white arrow), with the loss of T-cad action following the addition of rT-cad, NC-derivatives and vasculature no longer co-align (white arrowhead).

Similar articles

Cited by

References

    1. Autiero M., De Smet F., Claes F., Carmeliet P. Role of neural guidance signals in blood vessel navigation. Cardiovasc. Res. 2005;65:629–638. - PubMed
    1. Carreira B.P., Carvalho C.M., Araújo I.M. Regulation of injury-induced neurogenesis by nitric oxide. Stem Cells Int. 2012;2012:895659. - PMC - PubMed
    1. Chen J., Zacharek A., Zhang C., Jiang H., Li Y., Roberts C., Lu M., Kapke A., Chopp M. Endothelial nitric oxide synthase regulates brain-derived neurotrophic factor expression and neurogenesis after stroke in mice. J. Neurosci. 2005;25:2366–2375. - PMC - PubMed
    1. Cheng A., Wang S., Cai J., Rao M.S., Mattson M.P. Nitric oxide acts in a positive feedback loop with BDNF to regulate neural progenitor cell proliferation and differentiation in the mammalian brain. Dev. Biol. 2003;258:319–333. - PubMed
    1. Cheresh D.A. Human endothelial cells synthesize and express an Arg-Gly-Asp-directed adhesion receptor involved in attachment to fibrinogen and von Willebrand factor. Proc. Natl. Acad. Sci. USA. 1987;84:6471–6475. - PMC - PubMed

Publication types

MeSH terms