Comparative Study
. 2015 Jun 1;25(11):1542-50.
doi: 10.1016/j.cub.2015.04.036. Epub 2015 May 21.

A comparative analysis of spindle morphometrics across metazoans

Affiliations
Comparative Study

A comparative analysis of spindle morphometrics across metazoans

Marina E Crowder et al. Curr Biol. .

Abstract

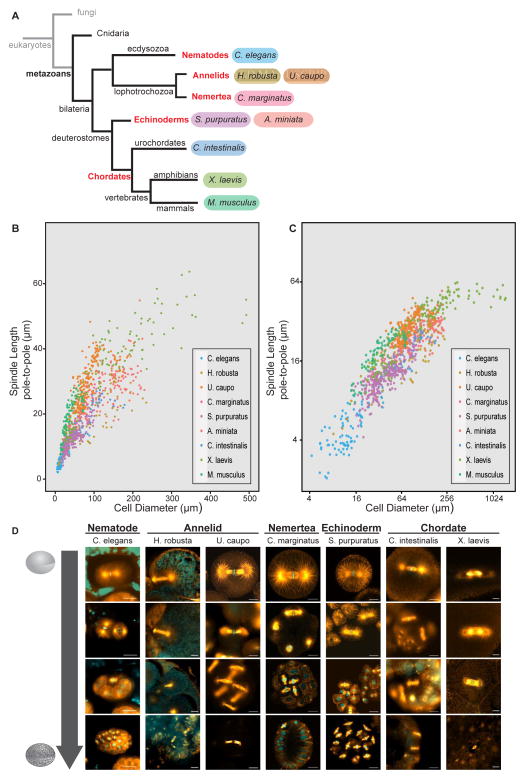
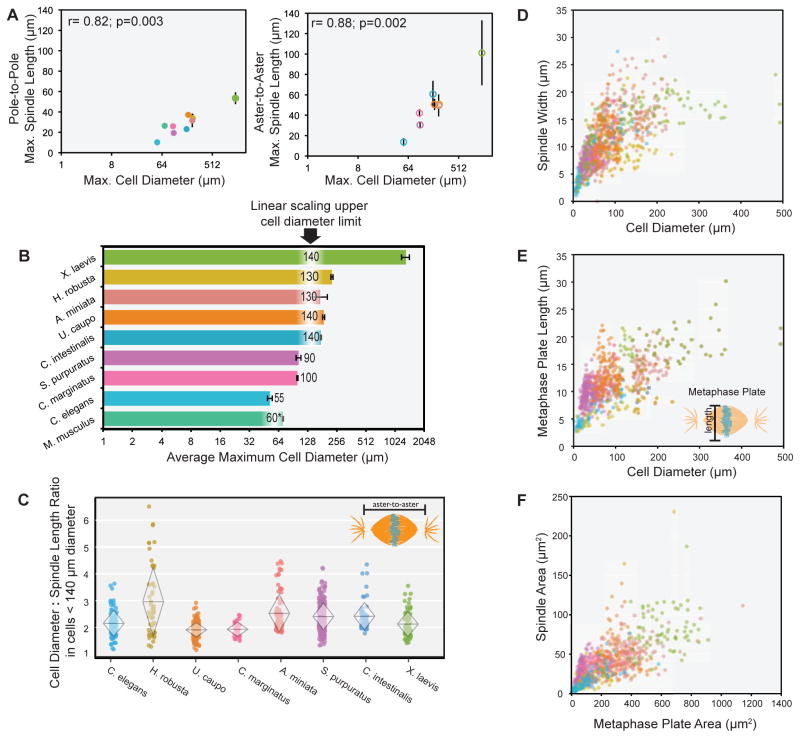
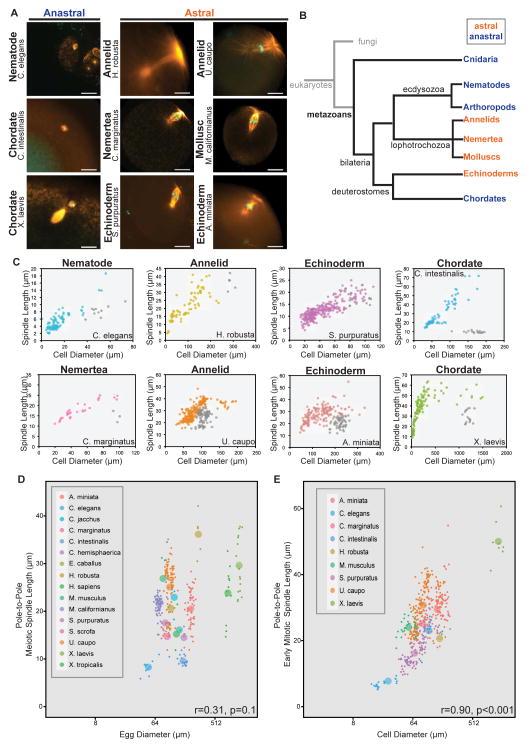
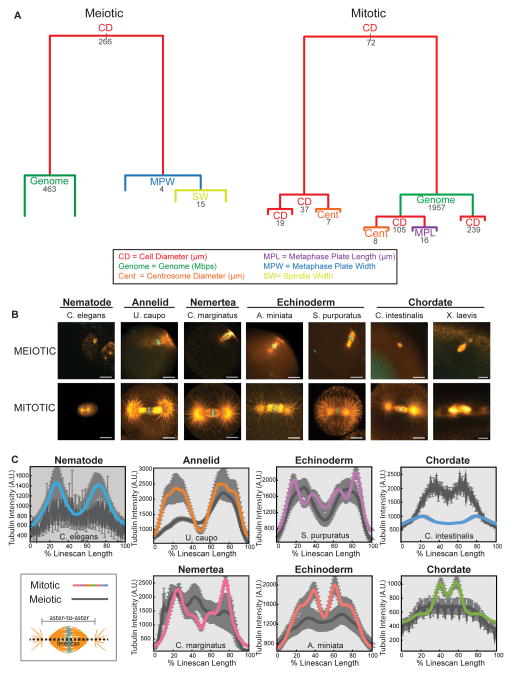
Cell division in all eukaryotes depends on function of the spindle, a microtubule-based structure that segregates chromosomes to generate daughter cells in mitosis or haploid gametes in meiosis. Spindle size adapts to changes in cell size and shape, which vary dramatically across species and within a multicellular organism, but the nature of scaling events and their underlying mechanisms are poorly understood. Cell size variations are most pronounced in early animal development, as egg diameters range from tens of microns up to millimeters across animal phyla, and decrease several orders of magnitude during rapid reductive divisions. During early embryogenesis in the model organisms X. laevis and C. elegans, the spindle scales with cell size [1, 2], a phenomenon regulated by molecules that modulate microtubule dynamics [3-6], as well as by limiting cytoplasmic volume [7, 8]. However, it is not known to what extent spindle scaling is conserved across organisms and among different cell types. Here we show that in a range of metazoan phyla, mitotic spindle length decreased with cell size across an ∼30-fold difference in zygote size. Maximum spindle length varied, but linear spindle scaling occurred similarly in all species once embryonic cell diameter reduced to 140 μm. In contrast, we find that the female meiotic spindle does not scale as closely to egg size, adopting a more uniform size across species that most likely reflects its specialized function. Our analysis reveals that spindle morphometrics change abruptly, within one cell cycle, at the transition from meiosis to mitosis in most animals.


Figures

Figure 1
Figure 1. Mitotic spindles scale to cell size across Metazoans
(A) Phylogenetic tree depicting phyla (red) and species (colors) represented in our analysis. (B) Mitotic pole-to-pole spindle length versus cell diameter in early embryonic cells < 500 μm in diameter. (C) Mitotic pole-to-pole spindle length versus cell diameter in early embryos on a log2-log2 scale. Individual data points represent a single spindle measurement and different colors represent different species. (D) Images of fixed mitotic embryos at different early embryonic stages stained for tubulin (orange) and DNA (cyan). All scale bars = 20 μm.
Figure 2
Figure 2. Linear size scaling relationships during animal development
(A) Average pole-to-pole mitotic spindle length (left) and aster-to-aster mitotic spindle length (right) versus cell diameter (log2 scale) during the first and second embryonic divisions of various species, r=0.82; p=0.003 (pole-to-pole) and r=0.88, p=0.002 (aster-to-aster). (B) Histogram of average maximum cell diameter of different species on a log2 scale. The largest cell diameter when linear scaling of spindle length is observed is indicated for each species. (C) Cell diameter : aster-to-aster spindle length ratio for cells < 140 μm in diameter. Overlaid diamonds indicate mean cell diameter : spindle length ratio (center horizontal line) and standard deviation (height of vertices). (D) Mitotic spindle width versus cell diameter in cells < 500 μm in diameter. For cells < 140 μm in diameter, r= 0.67, p<0.001. (E) Mitotic metaphase plate length versus cell diameter in cells < 500 μm in diameter. For cells < 140 μm in diameter, r= 0.62, p<0.001. (F) Spindle area (pole-to-pole spindle length x spindle width) versus metaphase plate area (metaphase plate length x width), r=0.73, p<0.001. (C – F) Individual points represent a single spindle measurement. Error bars represent standard deviation of the mean. Different colors represent different species as indicated in Figure 1A key.
Figure 3
Figure 3. Meiotic spindles do not scale to egg size
(A) Images of female meiotic spindles stained for tubulin (orange) and DNA (cyan). Scale bars = 20 μm, MI=meiosis I, MII= meiosis II. (B) Phylogenetic tree indicating phyla with astral (orange) or anastral (blue) female meiotic spindles. (C) Individual species plots of pole-to-pole mitotic (color) and meiotic (grey) spindle length versus cell diameter. (D) Female meiotic pole-to-pole spindle length versus egg diameter (log2 scale), r=0.31, p= 0.1. (E) Average mitotic pole-to-pole spindle length versus cell diameter (log2 scale) from 1- to 4- cell embryos, r= 0.90, p< 0.001. (C–E) Individual data points represent a single spindle measurement and different colors represent different species as indicated. (D and E) Larger points represent averages for each species.
Figure 4
Figure 4. Spindle morphometrics differ between meiotic and mitotic spindles
(A) Regression tree models for meiotic and mitotic spindles obtained through recursive partitioning of continuous explanatory variables (x(i)) with meiotic or mitotic spindle size as response variable (y). Split corresponds to the biggest change in explained spindle size variation and the length of branches reflects the portion of variation explained. Numbers indicate explanatory variable values at each split. (B) Images of female meiotic spindles (top panel) and mitotic spindles from the first or second embryonic division (bottom panel) stained for tubulin (orange) and DNA (cyan). Scale bars = 20 μm. (C) Plots of integrated average microtubule intensity quantified from a 30 pixel-wide linescan that extended beyond the aster-to-aster spindle length. Intensity plots are scaled to 100% linescan length and averaged from metaphase mitotic spindles (color) from 1- to 4-cell embryos and female meiotic spindles (dark gray), error bars (light grey) = SEM.

Similar articles

Cited by

References

    1. Wuhr M, Chen Y, Dumont S, Groen AC, Needleman DJ, Salic A, Mitchison TJ. Evidence for an upper limit to mitotic spindle length. Curr Biol. 2008;16:1256–1261. - PMC - PubMed
    1. Hara Y, Kimura A. Cell-size-dependent spindle elongation in the Caenorhabditis elegans early embryo. Curr Biol. 2009;18:1549–1554. - PubMed
    1. Wilbur JD, Heald R. Mitotic spindle scaling during Xenopus development by kif2a and importin alpha. Elife. 2013:e00290. - PMC - PubMed
    1. Hara Y, Kimura A. An allometric relationship between mitotic spindle width, spindle length, and ploidy in Caenorhabditis elegans embryos. Mol Biol Cell. 2013;9:1411–1419. - PMC - PubMed
    1. Reber SB, Baumgart J, Widlund PO, Pozniakovsky A, Howard J, Hyman AA, Julicher F. XMAP215 activity sets spindle length by controlling the total mass of spindle microtubules. Nat Cell Biol. 2013;9:1116–1122. - PubMed

Publication types