

Total protein is an effective loading control for cerebrospinal fluid western blots
- PMID: 26004848
- PMCID: PMC4540354
- DOI: 10.1016/j.jneumeth.2015.05.011
Total protein is an effective loading control for cerebrospinal fluid western blots
Abstract
Background: Cerebrospinal fluid (CSF) has been used to identify biomarkers of neurological disease. CSF protein biomarkers identified by high-throughput methods, however, require further validation. While Western blotting (WB) is well-suited to this task, the lack of a validated loading control for CSF WB limits the method's accuracy.
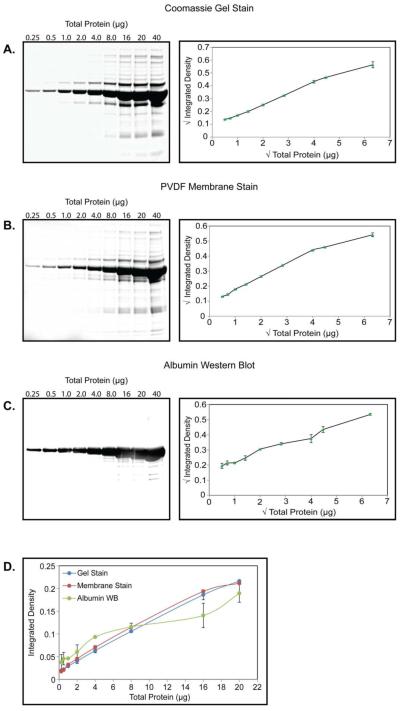
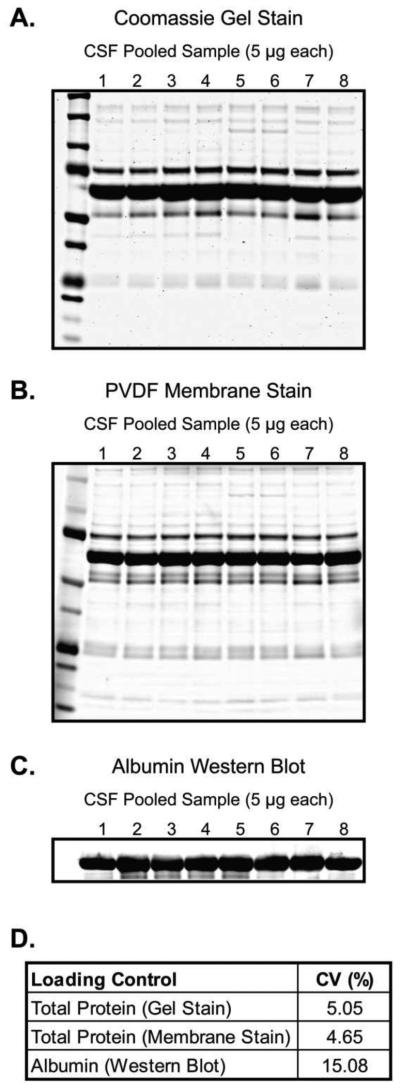
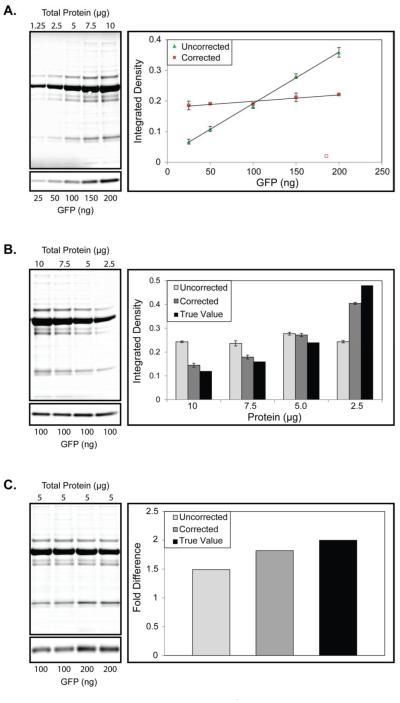
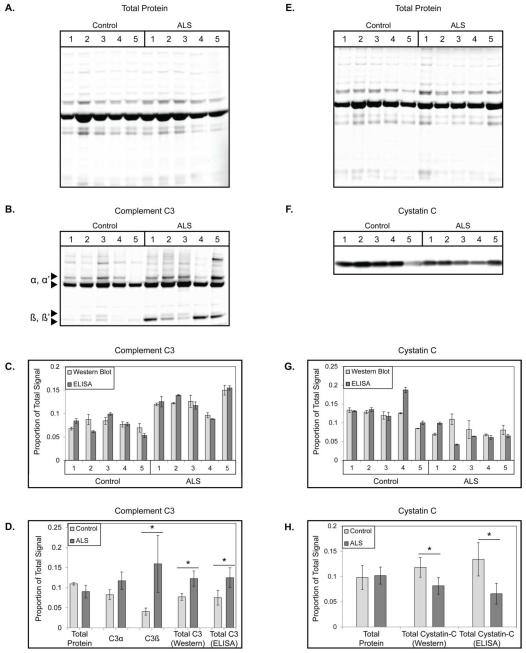
New method: We investigated the use of total protein (TP) as a CSF WB loading control. Using iodine-based reversible membrane staining, we determined the linear range and consistency of the CSF TP signal. We then spiked green fluorescent protein (GFP) into CSF to create defined sample-to-sample differences in GFP levels that were measured by WB before and after TP loading correction. Levels of CSF complement C3 and cystatin C measured by WB with TP loading correction and ELISA in amyotrophic lateral sclerosis and healthy control CSF samples were then compared.
Results: CSF WB with the TP loading control accurately detected defined differences in GFP levels and corrected for simulated loading errors. Individual CSF sample Western blot and ELISA measurements of complement C3 and cystatin C were significantly correlated and the methods showed a comparable ability to detect between-groups differences.
Comparison with existing method: CSF TP staining has a greater linear dynamic range and sample-to-sample consistency than albumin, a commonly used CSF loading control. The method accurately corrects for simulated errors in loading and improves the sensitivity of CSF WB compared to using no loading control.
Conclusions: The TP staining loading control improves the sensitivity and accuracy of CSF WB results.
Keywords: Cerebrospinal fluid; Loading control; Total protein stain; Western blot.
Copyright © 2015 The Authors. Published by Elsevier B.V. All rights reserved.
Figures
Similar articles
-
Sporadic Creutzfeldt-Jakob disease diagnostic accuracy is improved by a new CSF ELISA 14-3-3γ assay.Neuroscience. 2016 May 13;322:398-407. doi: 10.1016/j.neuroscience.2016.02.057. Epub 2016 Mar 3. Neuroscience. 2016. PMID: 26940479
-
Upper reference limits for cerebrospinal fluid total protein and albumin quotient based on a large cohort of control patients: implications for increased clinical specificity.Clin Chem Lab Med. 2016 Feb;54(2):285-92. doi: 10.1515/cclm-2015-0253. Clin Chem Lab Med. 2016. PMID: 26079822
-
Normalized Quantitative Western Blotting Based on Standardized Fluorescent Labeling.Methods Mol Biol. 2016;1450:247-58. doi: 10.1007/978-1-4939-3759-2_20. Methods Mol Biol. 2016. PMID: 27424760
-
Tubulin or Not Tubulin: Heading Toward Total Protein Staining as Loading Control in Western Blots.Proteomics. 2017 Oct;17(20). doi: 10.1002/pmic.201600189. Proteomics. 2017. PMID: 28941183 Review.
-
Adult CSF total protein upper reference limits should be age-partitioned and significantly higher than 0.45 g/L: a systematic review.J Neurol. 2019 Mar;266(3):616-624. doi: 10.1007/s00415-018-09174-z. Epub 2019 Jan 8. J Neurol. 2019. PMID: 30617996
Cited by
-
Resistance wheel running improves contractile strength, but not metabolic capacity, in a murine model of volumetric muscle loss injury.Exp Physiol. 2023 Oct;108(10):1282-1294. doi: 10.1113/EP091284. Epub 2023 Aug 10. Exp Physiol. 2023. PMID: 37526646 Free PMC article.
-
KLF4 defines the efficacy of the epidermal growth factor receptor inhibitor, erlotinib, in triple-negative breast cancer cells by repressing the EGFR gene.Breast Cancer Res. 2020 Jun 18;22(1):66. doi: 10.1186/s13058-020-01305-7. Breast Cancer Res. 2020. PMID: 32552913 Free PMC article.
-
Advancements in Cerebrospinal Fluid Biosensors: Bridging the Gap from Early Diagnosis to the Detection of Rare Diseases.Sensors (Basel). 2024 May 22;24(11):3294. doi: 10.3390/s24113294. Sensors (Basel). 2024. PMID: 38894085 Free PMC article. Review.
-
Infants Uniquely Express High Levels of RBM3 and Other Cold-Adaptive Neuroprotectant Proteins in the Human Brain.Dev Neurosci. 2018;40(4):325-336. doi: 10.1159/000493637. Epub 2018 Nov 6. Dev Neurosci. 2018. PMID: 30399610 Free PMC article.
-
Aberrant Levels of Cystatin C in Amyotrophic Lateral Sclerosis: a Systematic Review and Meta Analysis.Int J Biol Sci. 2018 Jun 3;14(9):1041-1053. doi: 10.7150/ijbs.25711. eCollection 2018. Int J Biol Sci. 2018. PMID: 29989057 Free PMC article.
References
-
- Dubitsky A, DeCollibus D, Ortolano GA. Sensitive fluorescent detection of protein on nylon membranes. J Biochem Biophys Methods. 2002;51:47–56. - PubMed
-
- Gingrich JC, Davis DR, Nguyen Q. Multiplex detection and quantitation of proteins on western blots using fluorescent probes. Biotechniques. 2000;29:636–642. - PubMed
-
- Sternberg SR. Biomedial image processing. IEEE Trans Comput. 1983;32:22–34.
-
- Pepe MS, Etzioni R, Feng Z, Potter JD, et al. Phases of biomarker development for early detection of cancer. J Natl Cancer Inst. 2001;93:1054–1061. - PubMed
Publication types
MeSH terms
Substances
Grants and funding
LinkOut - more resources
Full Text Sources
Other Literature Sources
Miscellaneous
