

Full correlation matrix analysis (FCMA): An unbiased method for task-related functional connectivity
- PMID: 26004849
- PMCID: PMC4500659
- DOI: 10.1016/j.jneumeth.2015.05.012
Full correlation matrix analysis (FCMA): An unbiased method for task-related functional connectivity
Abstract
Background: The analysis of brain imaging data often requires simplifying assumptions because exhaustive analyses are computationally intractable. Standard univariate and multivariate analyses of brain activity ignore interactions between regions and analyses of interactions (functional connectivity) reduce the computational challenge by using seed regions of interest or brain parcellations.
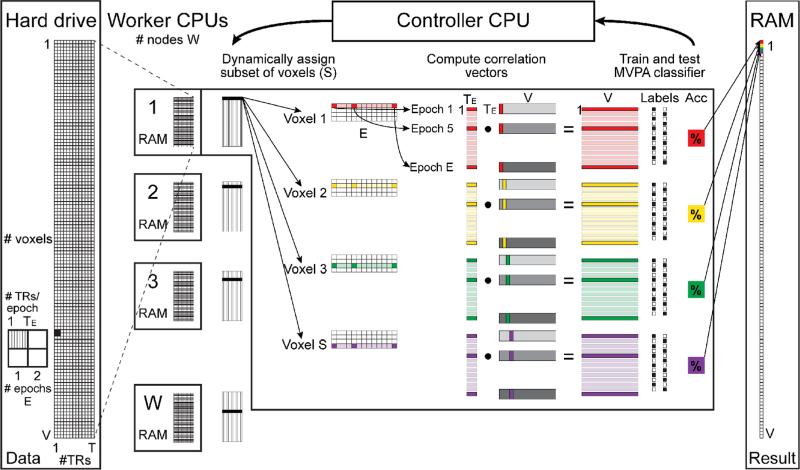
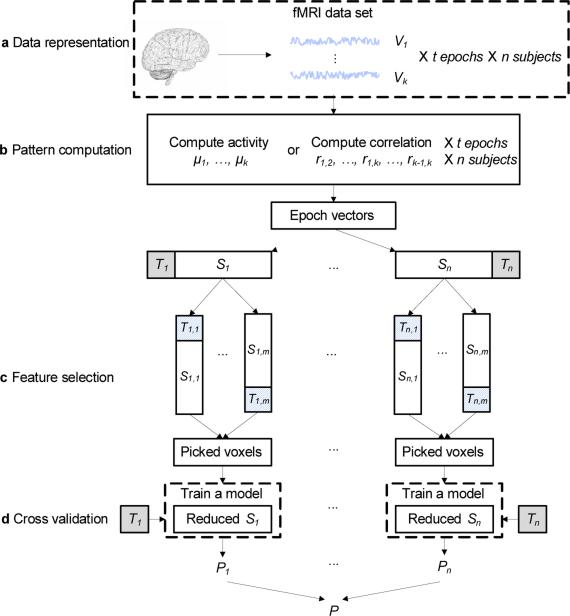
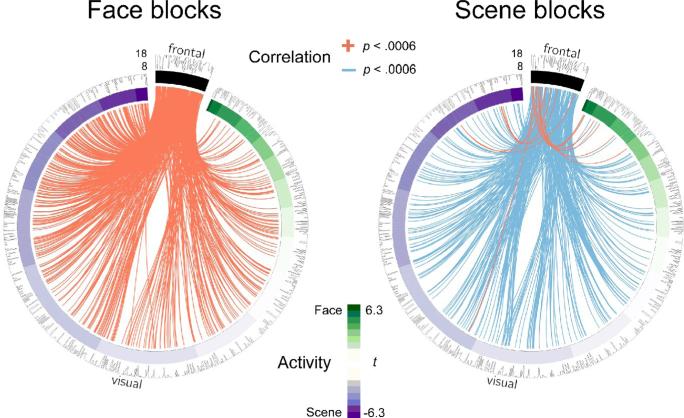
New method: To meet this challenge, we developed full correlation matrix analysis (FCMA), which leverages and optimizes algorithms from parallel computing and machine learning to efficiently analyze the pairwise correlations of all voxels in the brain during different cognitive tasks, with the goal of identifying task-related interactions in an unbiased manner.
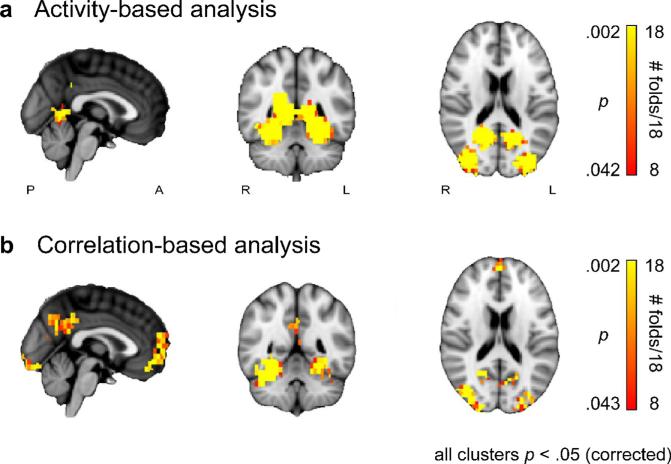
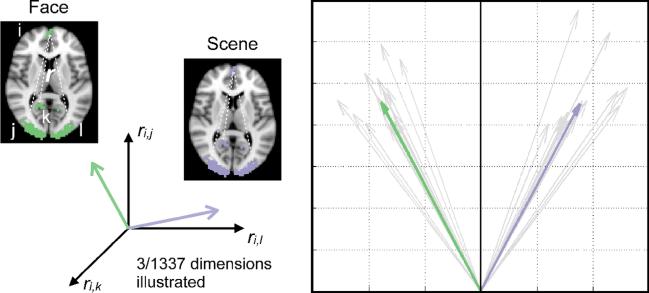
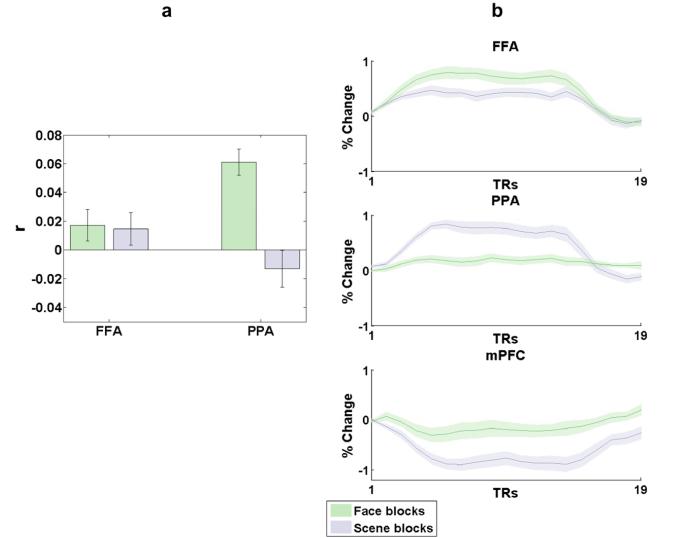
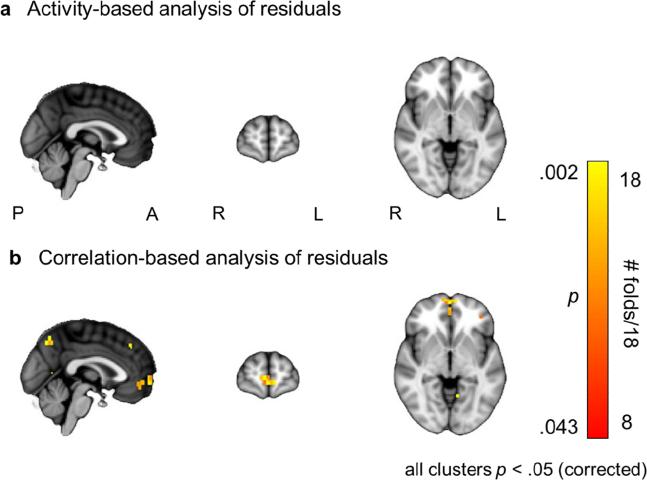
Results: When applied to a localizer dataset on a small compute cluster, FCMA accelerated a naive, serial approach by four orders of magnitude, reducing running time from two years to one hour. In addition to this performance gain, FCMA emphasized different brain areas than existing methods. In particular, beyond replicating known category selectivity in visual cortex, FCMA also revealed a region of medial prefrontal cortex whose selectivity derived from differential patterns of functional connectivity across categories.
Comparison with existing method(s): For benchmarking, we started with a naive approach and progressively built up to the complete FCMA procedure by adding optimized classifier algorithms, multi-threaded parallelism, and multi-node parallelism. To evaluate what can be learned with FCMA, we compared it against multivariate pattern analysis of activity and seed-based analysis of functional connectivity.
Conclusions: FCMA demonstrates how advances in computer science can alleviate computational bottlenecks in neuroscience. We have released a software toolbox to help others evaluate FCMA.
Keywords: Functional magnetic resonance imaging; Machine learning; Multivariate pattern analysis; Parallel computing.
Copyright © 2015 Elsevier B.V. All rights reserved.
Figures
Similar articles
-
Functional connectivity hubs of the mouse brain.Neuroimage. 2015 Jul 15;115:281-91. doi: 10.1016/j.neuroimage.2015.04.033. Epub 2015 Apr 23. Neuroimage. 2015. PMID: 25913701
-
Groupwise spatial normalization of fMRI data based on multi-range functional connectivity patterns.Neuroimage. 2013 Nov 15;82:355-72. doi: 10.1016/j.neuroimage.2013.05.093. Epub 2013 May 28. Neuroimage. 2013. PMID: 23727315
-
Estimation of the effective and functional human cortical connectivity with structural equation modeling and directed transfer function applied to high-resolution EEG.Magn Reson Imaging. 2004 Dec;22(10):1457-70. doi: 10.1016/j.mri.2004.10.006. Magn Reson Imaging. 2004. PMID: 15707795
-
GPU accelerated dynamic functional connectivity analysis for functional MRI data.Comput Med Imaging Graph. 2015 Jul;43:53-63. doi: 10.1016/j.compmedimag.2015.02.009. Epub 2015 Mar 7. Comput Med Imaging Graph. 2015. PMID: 25805449
-
Connectivity and complex systems: learning from a multi-disciplinary perspective.Appl Netw Sci. 2018;3(1):11. doi: 10.1007/s41109-018-0067-2. Epub 2018 Jun 18. Appl Netw Sci. 2018. PMID: 30839779 Free PMC article. Review.
Cited by
-
Multi-Connection Pattern Analysis: Decoding the representational content of neural communication.Neuroimage. 2017 Nov 15;162:32-44. doi: 10.1016/j.neuroimage.2017.08.033. Epub 2017 Aug 13. Neuroimage. 2017. PMID: 28813643 Free PMC article.
-
A Functional Cartography of Cognitive Systems.PLoS Comput Biol. 2015 Dec 2;11(12):e1004533. doi: 10.1371/journal.pcbi.1004533. eCollection 2015 Dec. PLoS Comput Biol. 2015. PMID: 26629847 Free PMC article.
-
Noise correlations in the human brain and their impact on pattern classification.PLoS Comput Biol. 2017 Aug 25;13(8):e1005674. doi: 10.1371/journal.pcbi.1005674. eCollection 2017 Aug. PLoS Comput Biol. 2017. PMID: 28841641 Free PMC article.
-
Propagation of Information Along the Cortical Hierarchy as a Function of Attention While Reading and Listening to Stories.Cereb Cortex. 2019 Sep 13;29(10):4017-4034. doi: 10.1093/cercor/bhy282. Cereb Cortex. 2019. PMID: 30395174 Free PMC article.
-
Within node connectivity changes, not simply edge changes, influence graph theory measures in functional connectivity studies of the brain.Neuroimage. 2021 Oct 15;240:118332. doi: 10.1016/j.neuroimage.2021.118332. Epub 2021 Jul 2. Neuroimage. 2021. PMID: 34224851 Free PMC article.
References
-
- Allison T, Puce A, Spencer DD, McCarthy G. Electrophysiological studies of human face perception. I: Potentials generated in occipitotemporal cortex by face and non-face stimuli. Cerebral Cortex. 1999;9:415–430. - PubMed
-
- Chang CC, Lin CJ. LIBSVM: A library for support vector machines. ACM Trans. Intel. Sys. Tech. 2011;2:1–27. http://www.csie.ntu.edu.tw/~cjlin/libsvm.
Publication types
MeSH terms
Grants and funding
LinkOut - more resources
Full Text Sources
Other Literature Sources
