. 2015 Jun 3;86(5):1215-27.
doi: 10.1016/j.neuron.2015.05.005. Epub 2015 May 21.

Robust Axonal Regeneration Occurs in the Injured CAST/Ei Mouse CNS

Affiliations

Robust Axonal Regeneration Occurs in the Injured CAST/Ei Mouse CNS

Takao Omura et al. Neuron. .

Abstract

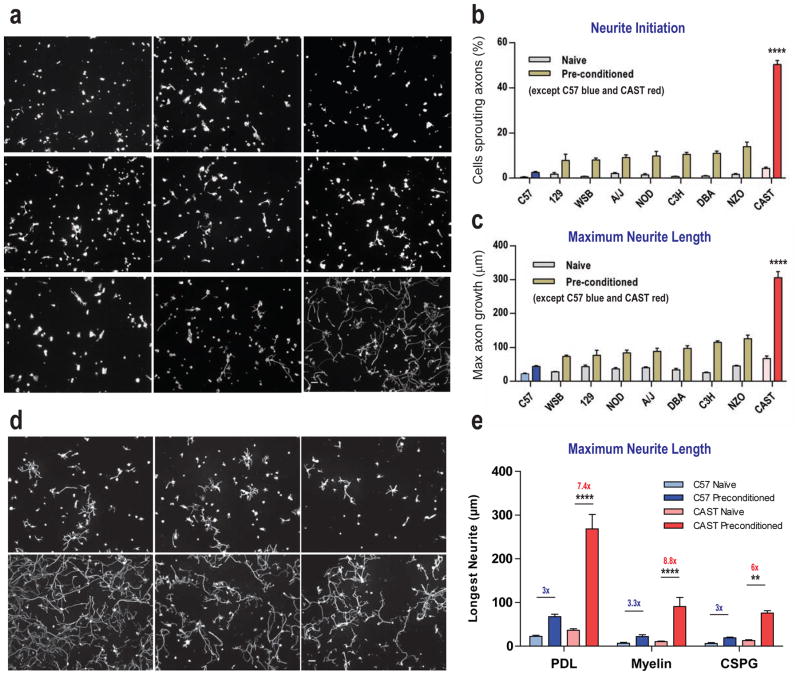
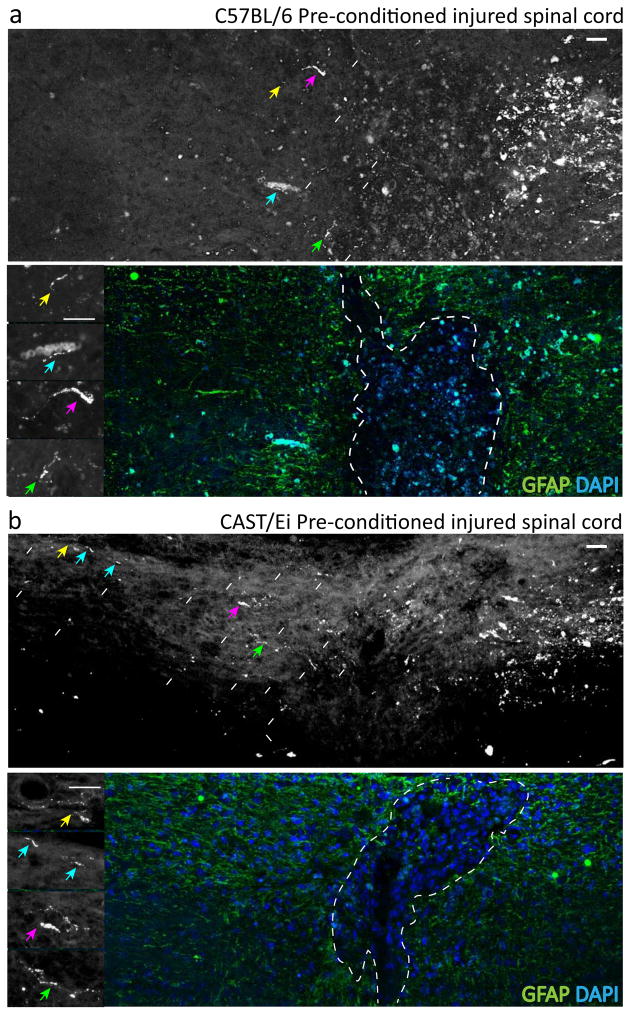
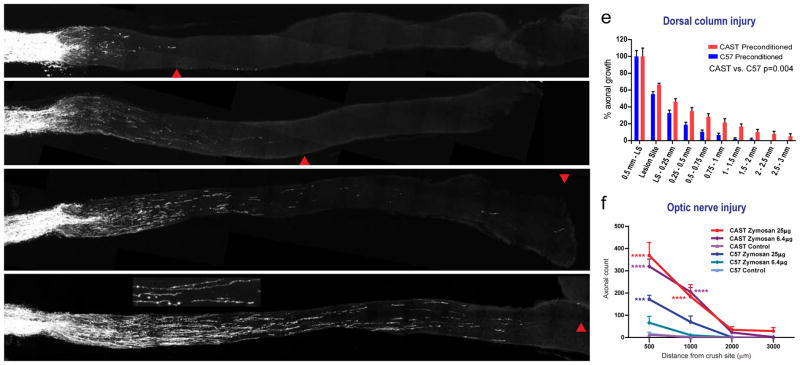
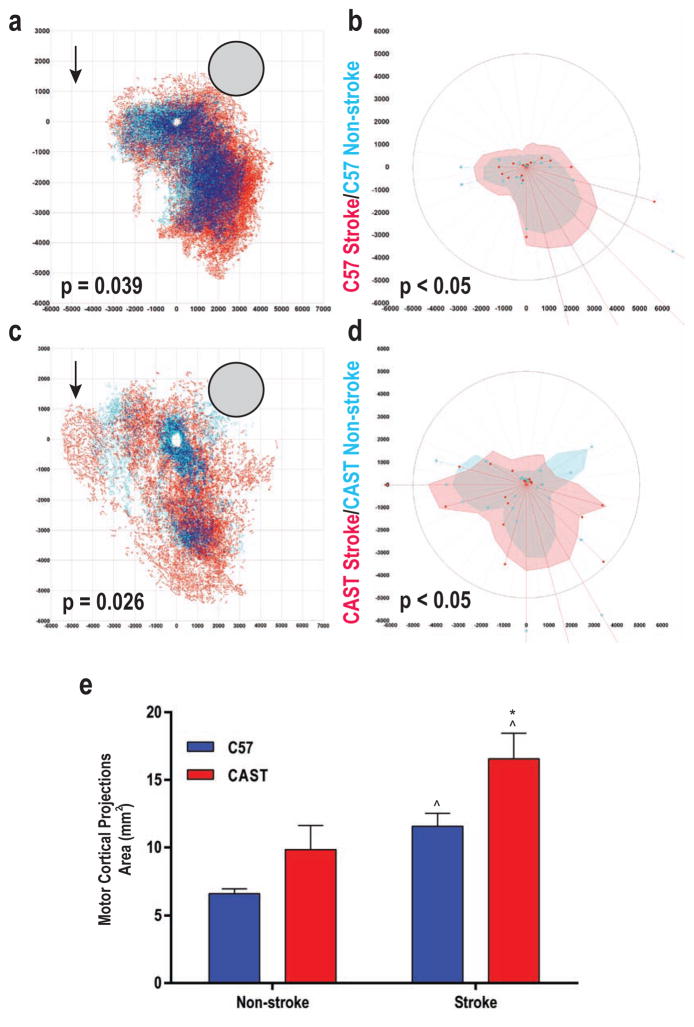
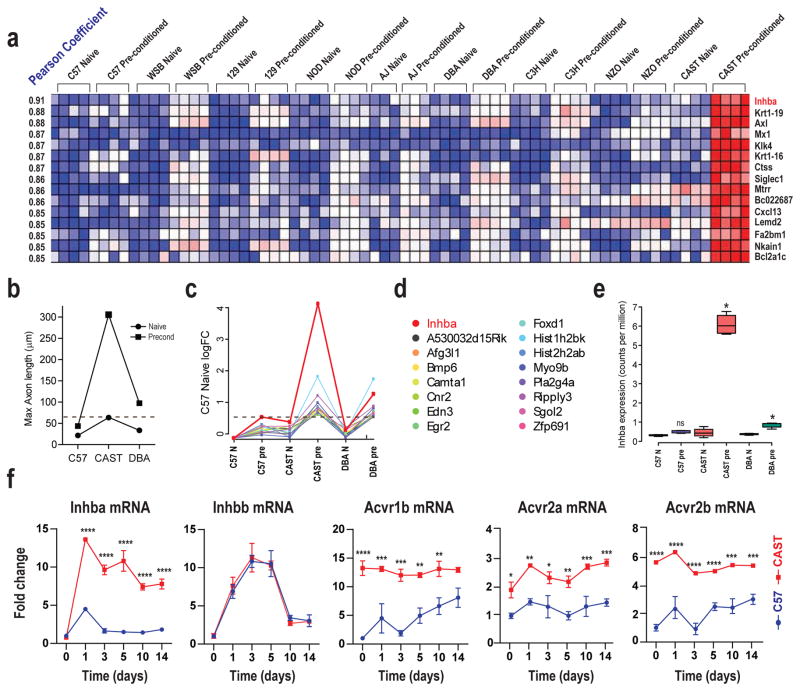
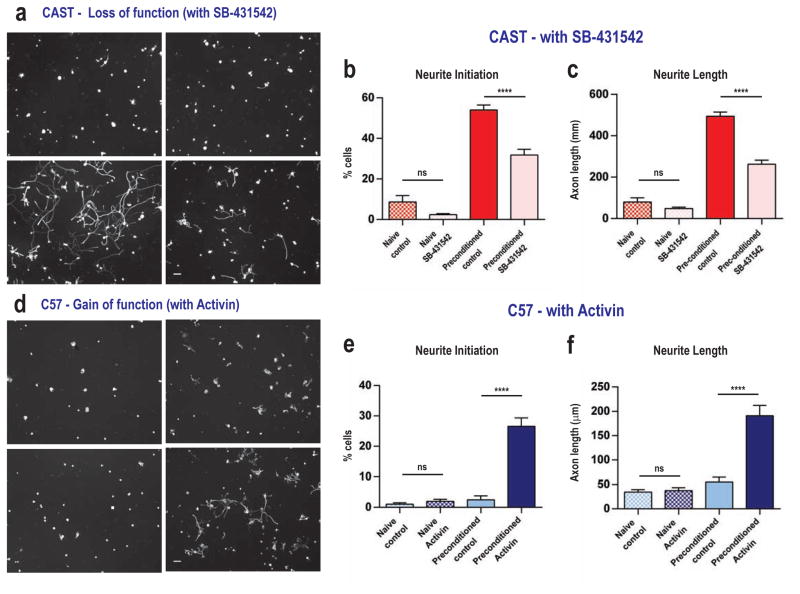
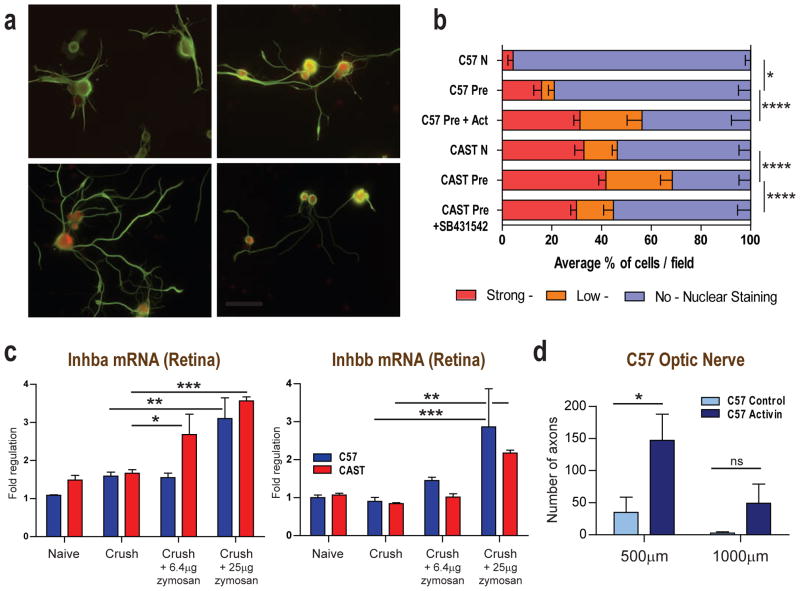
Axon regeneration in the CNS requires reactivating injured neurons' intrinsic growth state and enabling growth in an inhibitory environment. Using an inbred mouse neuronal phenotypic screen, we find that CAST/Ei mouse adult dorsal root ganglion neurons extend axons more on CNS myelin than the other eight strains tested, especially when pre-injured. Injury-primed CAST/Ei neurons also regenerate markedly in the spinal cord and optic nerve more than those from C57BL/6 mice and show greater sprouting following ischemic stroke. Heritability estimates indicate that extended growth in CAST/Ei neurons on myelin is genetically determined, and two whole-genome expression screens yield the Activin transcript Inhba as most correlated with this ability. Inhibition of Activin signaling in CAST/Ei mice diminishes their CNS regenerative capacity, whereas its activation in C57BL/6 animals boosts regeneration. This screen demonstrates that mammalian CNS regeneration can occur and reveals a molecular pathway that contributes to this ability.


Figures

Figure 1
Figure 1. Screening for axonal growth in an inhibitory central growth environment
A: Representative photomicrographs of pre-conditioned axonal growth for nine screened mouse strains (A/J, C3H/HeJ, C57BL/6J, DBA/2J, 129S1/SvImJ, NOD/LtJ, NZO/HlLtJ, CAST/EiJ, and WSB/EiJ) on Myelin. B: Maximal level of axonal sprouting achieved by naïve and pre-conditioned DRG neurons grown on myelin for 24 hours in these mouse strains. C: Maximal level of axonal outgrowth achieved in naïve and pre-conditioned DRG neurons by a sciatic nerve crush injury 5 days prior to growth on myelin for 24 hours. D: Representative photomicrographs of pre-conditioned DRG axonal growth for C57BL/6 and CAST/Ei DRG neurons on PDL, Myelin and CSPG respectively. E: Quantification of growth of naïve and pre-conditioned C57BL/6 and CAST/Ei DRG neurons on a neutral substrate, poly-d-lysine and on inhibitory substrates, myelin and CSPGs. Alternate image capture and counting schemes were used between data given A–C and D–E (see methods). Statistical analysis of B and C: One-way ANOVA; post-hoc Sidak’s corrected, p<0.0001 for pre-conditioned CAST/Ei against all other conditions. For E: Three-way ANOVA; post-hoc Sidak’s. ** p<0.01; **** p<0.0001. Scale, 100 μm. For growth of C57BL/6 and CAST/Ei DRG neurons in the PNS see Suppl Fig 1.
Figure 2
Figure 2. CAST vs. C57 axonal regeneration in the adult spinal cord
Regeneration of central axons of pre-conditioned DRG neurons rostral to a dorsal column injury. A small level of growth is present in C57BL/6 mice (A) but it is significantly greater in CAST/Ei mice (B). Growth quantified in Figure 3. Arrows identifies retrogradely labeled axons from the PNS. The white dashed line indicates the border of the lesion. Asterisk indicates the lesion epicenter (R: rostral, C: caudal). Scale, 100 μm. See also Suppl Fig’s 3 & 2.
Figure 3
Figure 3. CAST vs. C57 axonal regeneration in the adult CNS
A–D: Optic nerve injury treated with low dose (6.4 μg) zymosan in C57BL/6 results in minimal RGC re-growth (A), but the same dose initiates robust growth in CAST/Ei (C). Medium dose zymosan (25μg) stimulates growth in C57BL/6 optic nerves (B) however CAST/Ei RGC growth is much greater (D). Scale, 500 μm. Red arrow head signifies maximal axonal signal in that section. Inset; Magnified image of the regenerating fibers. Scale, 25μm. E: Quantification of percentage of labeled axons crossing the injury site rostral to the lesion site in preconditioned adult C57BL/6 and CAST/Ei spinal cords respectively. F: Quantification of numbers of axons reaching defined distances from the crush site in the optic nerve injury model of central regeneration. C57BL/6 and CAST/Ei 25μg or 6μg zymosan vs. control comparisons ***p<0.001, ****p<0.0001 (two-way ANOVA, post-hoc Sidak’s). For quantification of longest axonal growth in the injured spinal cord see Suppl Fig 4.
Figure 4
Figure 4. CAST vs. C57 axonal regeneration post cortical stroke
A: Connections of forelimb motor cortex in C57BL/6 with and without stroke. Light blue dots indicate the location of projections in non-stroke, red in stroke and dark blue dots are areas of dense overlap between the two conditions. Grey circle is site of tracer injection. X and Y axis represent micron distance from the center of the tracer injection. P-value: Hotellings inverse T-test. B: Polar distribution map in register with connectional plot in (a) showing localization of sprouting in stroke vs. control (Watson’s U2 test; P<0.05). Shaded polygons represent the 70th percentile of the distances of labeled projections from the injection site in each segment of the graph; weighted polar vectors represent normalized distribution of the quantity of points in a given segment of control (blue) or stroke (red) graphs. C: Same conventions as in panel A for CAST/Ei mice (n=5 per group). Note the connections in the far premotor cortex, 4 to 5.5mm anterior to the tracer injection site. These are not present in C57BL/6 after stroke (arrows). D: Same conventions as in Panel B. Overlay of control and post-stroke forelimb motor cortex projections. E: Area of motor cortex projections in C57BL/6 and CAST/Ei mice. Areas taken from 70th percentile of all distances in each radial segment from the injection site (B and D). Student’s t-test, two-tailed. ^ p<0.05, non-stroke vs. stroke C57BL/6 (n=5 for both stroke and non-stroke) and CAST/Ei (n=5 for both stroke and non-stroke) respectively; * p<0.05, CAST/Ei stroke vs. C57BL/6 stroke. See Supplemental Methods for further details.
Figure 5
Figure 5. Genome-wide expression analysis of CAST CNS growth
A: Naïve and preconditioned array data for the 15 genes whose DRG expression behavior most correlated with axonal growth on myelin. Each box represents data from a single array, each column a single DRG sample, each row a single gene, blue is less expressed, red most expressed. The transcripts are listed in order of Pearson correlation co-efficient between expression and axonal growth, the strains are ordered relative to preconditioned growth on myelin. B: The growth phenotype of each strain measured in a follow-up RNAseq screen determined by maximal axonal length. Horizontal red checked line represents the minimal growth level required in the screen for strong growth in the CNS. C: Expression data of the 16 genes identified by RNAseq screen. These data highlight the Inhba transcript expression (red line) as the most related to long distance regeneration in the mammalian CNS. D: Each of the transcripts identified by the screen with the color indicator for the expression profiles shown in (c). E: Actual expression of the Inhba transcript measured by RNAseq (units are counts per million reads); Inhba expression is significantly upregulated after pre-conditioning only in the DBA/2 and CAST/Ei strains (* p-value< 0.01, false discovery rate<0.01, EdgeR). Data from two independent screens then place Activin signaling at the apex of the strong central axonal regeneration phenotype, most clearly seen in the CAST/Ei strain. F: Time course of expression of Inhba, Inhbb and Activin receptor subtype transcripts in ipsilateral L4/5 DRG from naïve mice and 1, 3, 5, 10 and 14 days post-sciatic nerve crush for both C57BL/6 and CAST/Ei. QRT-PCR; Mean fold change ± SEM normalized to naïve C57BL/6 values For statistical analysis, two-way ANOVA was performed, post hoc Sidak’s (*p<0.05, **p<0.01, ***p<0.001, ****p<0.0001). For Activin cascade member sites of expression in the DRG see Suppl Fig 5.
Figure 6
Figure 6. Gain and loss of function assays of Activin action in promoting central axonal growth
A–C: The activin receptor, type IB inhibitor SB-431542 (100nM) significantly decreases neuronal growth of pre-conditioned CAST/Ei DRG neurons on myelin, quantified in (b and c). D–F: A mixture of Activin-A, Activin-B and Activin-AB peptides (10 ng/ml) significantly increased axonal growth in pre-conditioned C57BL/6 DRG neurons, quantified in (e and f). Neuronal counts average of 4 wells per group, run 3 independent times as counted as in Figure 1a–c. For B, C, E, F: Mean ± SEM. ****p<0.0001 (two-way ANOVA, post-hoc Sidak’s). Scale, 100 μm.
Figure 7
Figure 7. Molecular mechanisms of Activin function
A: Representative cultured pre-conditioned C57BL/6 and CAST/Ei DRG neurons immunostained for pSmad2/3 and Tuj1 before and after Activin or SB-431542 treatment. Scale, 100 μm. B: Quantification of nuclear pSmad2/3 in naïve and preconditioned C57BL/6 and CAST/Ei DRG neurons treated with Activin or SB-431542. C: Q-PCR data showing that treating the mouse retina with 6.4μg intraocular zymosan increases Inhba mRNA expression only in CAST/Ei while 25μg induces regulation in both C57BL/6 and CAST/Ei animals. Introcular injection of 6.4μg and 25μg zymosan showing similar Inhbb regulation in C57BL/6 and CAST/Ei animals. D: A mixture of Activin-A, Activin-B and Activin-AB increases ON regeneration in C57BL/6 mice treated with 6.4μg of zymosan. Data quantified as numbers of optic nerve axons growing 500μm and 1000μm from crush site in presence of PBS or Activin peptide mix respectively For B: Mean ± SEM. Statistical analysis Poisson Regression, post-hoc Sidak’s. *p<0.05, ****p<0.0001. For C: Mean fold change ± SEM normalized to naïve C57BL/6 values, for comparisons shown *p<0.05, **p<0.01, ***p<0.001, (two-way ANOVA, post hoc Sidak’s). For D: Counts are average of 4 sections per animal, 5 animals. Average numbers of axons reaching defined distances from the crush site in each animal ± SEM; *p<0.05 (two-way ANOVA, post hoc Sidak’s). For in vitro gain of function assay using Activin peptides on rat retinal ganglion cells see Suppl Fig 7.

Similar articles

Cited by

References

    1. Alilain WJ, Horn KP, Hu H, Dick TE, Silver J. Functional regeneration of respiratory pathways after spinal cord injury. Nature. 2011;475:196–200. - PMC - PubMed
    1. Benowitz LI, Popovich PG. Inflammation and axon regeneration. Curr Opin Neurol. 2011;24:577–583. - PubMed
    1. Benowitz LI, Yin Y. Combinatorial treatments for promoting axon regeneration in the CNS: strategies for overcoming inhibitory signals and activating neurons’ intrinsic growth state. Dev Neurobiol. 2007;67:1148–1165. - PubMed
    1. Blesch A, Lu P, Tsukada S, Alto LT, Roet K, Coppola G, Geschwind D, Tuszynski MH. Conditioning lesions before or after spinal cord injury recruit broad genetic mechanisms that sustain axonal regeneration: superiority to camp-mediated effects. Exp Neurol. 2012;235:162–173. - PMC - PubMed
    1. Chang HL, Jovanis PP. Formulating accident occurrence as a survival process. Accident; analysis and prevention. 1990;22:407–419. - PubMed

Publication types