. 2016 May:124:134-140.
doi: 10.1016/j.biochi.2015.05.007. Epub 2015 May 21.

Adipose tissue Mest and Sfrp5 are concomitant with variations of adiposity among inbred mouse strains fed a non-obesogenic diet

Affiliations

Adipose tissue Mest and Sfrp5 are concomitant with variations of adiposity among inbred mouse strains fed a non-obesogenic diet

Rea P Anunciado-Koza et al. Biochimie. 2016 May.

Abstract

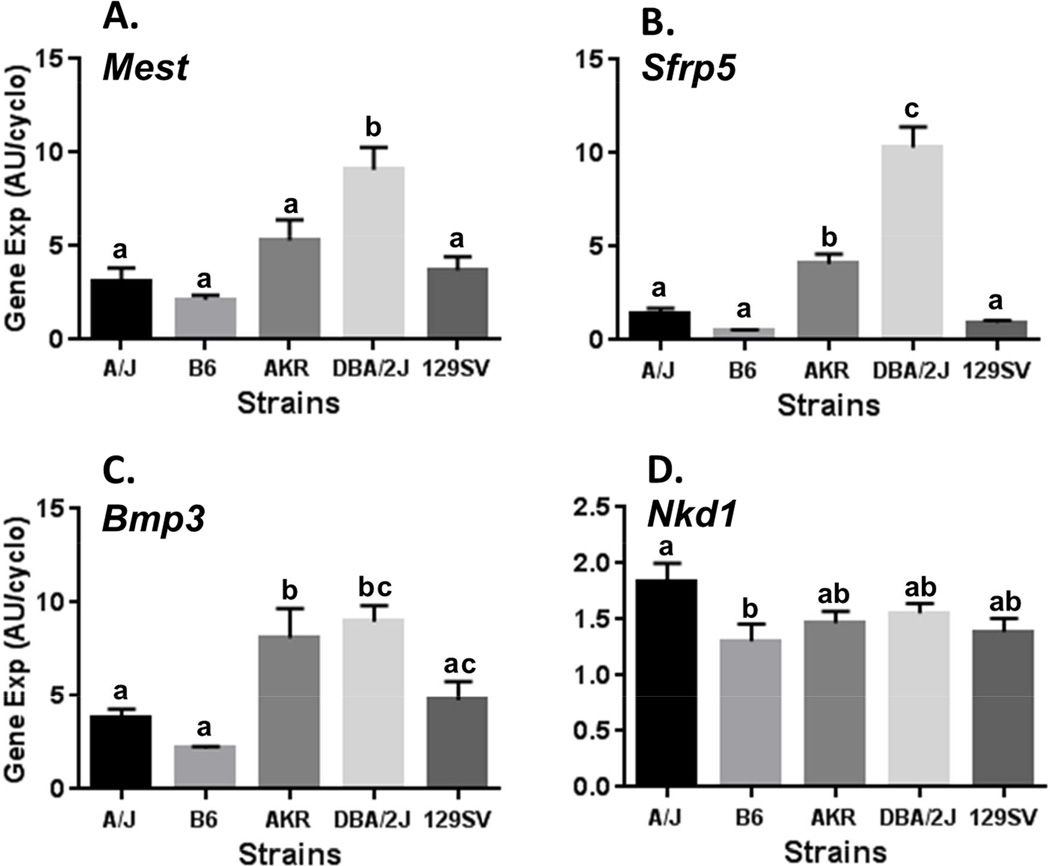
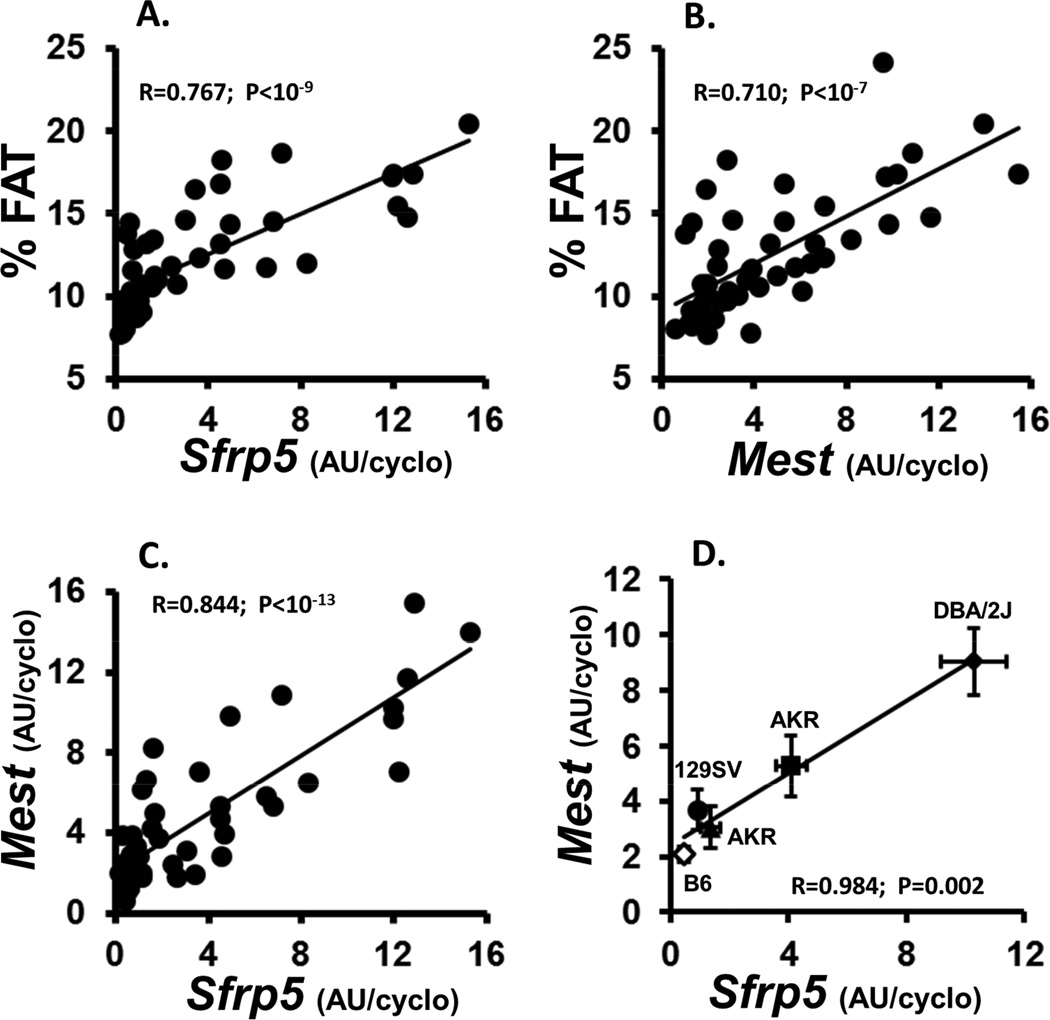
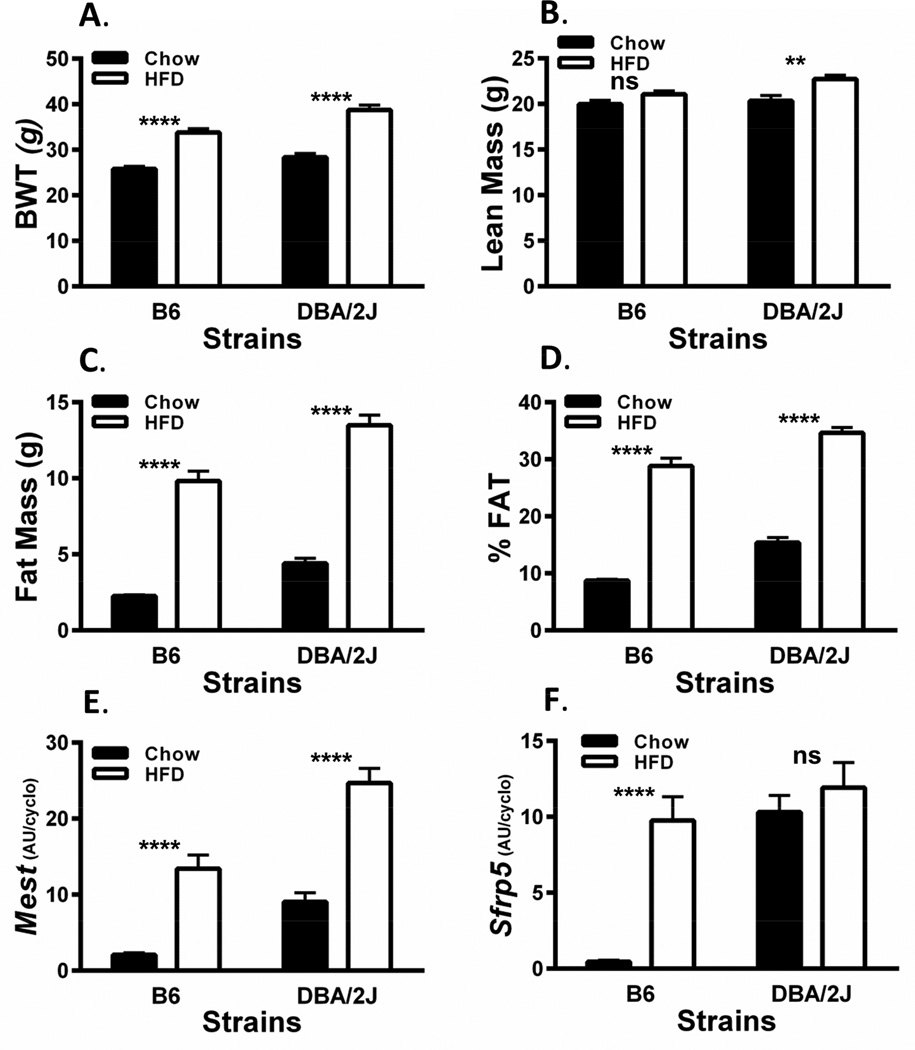
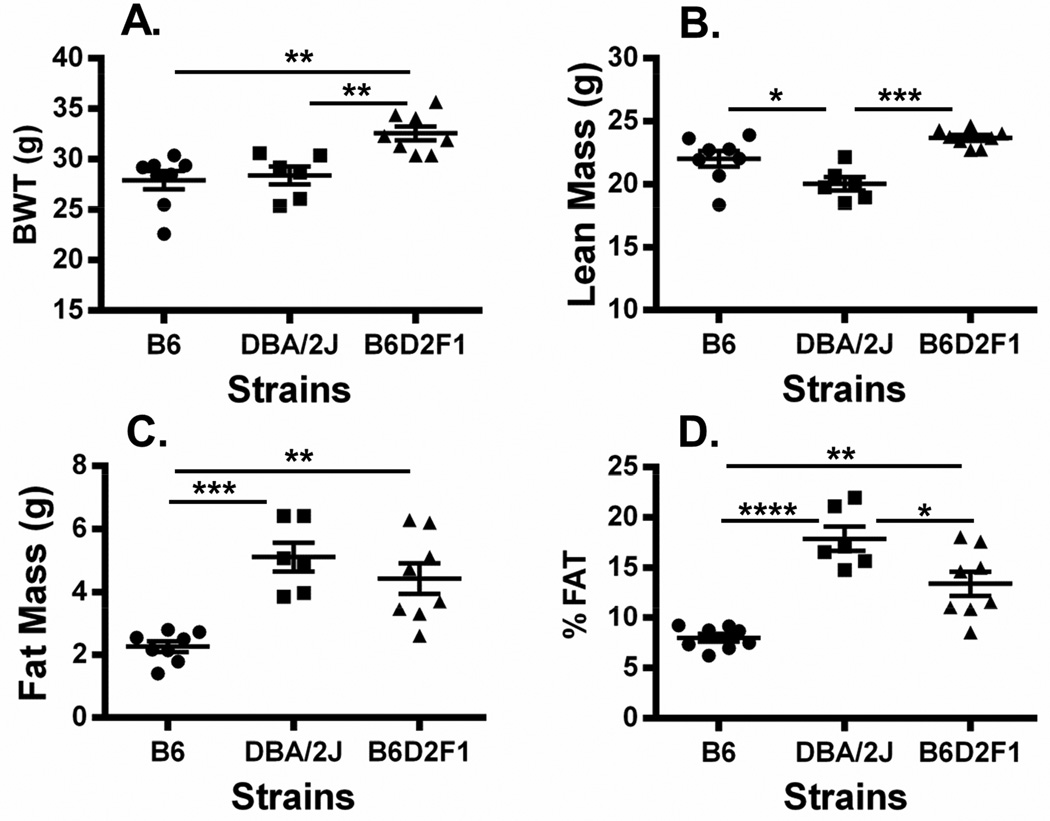
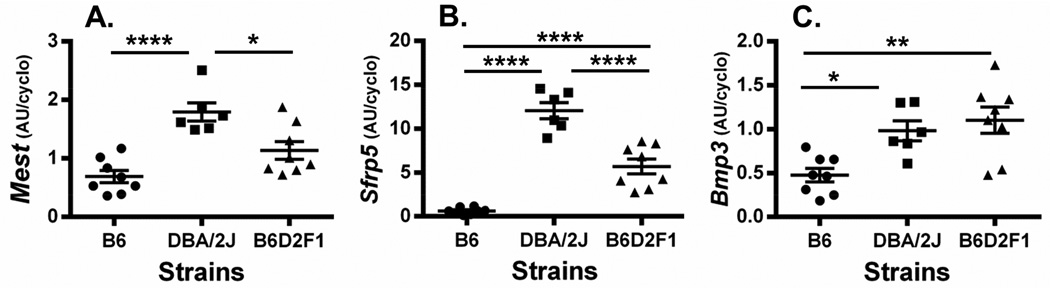
The expression of a subset of genes including mesoderm specific transcript (Mest), secreted frizzled-related protein 5 (Sfrp5) and bone morphogenetic protein 3 (Bmp3) in adipose tissue biopsies of C57BL/6J mice before exposure to an obesogenic diet were shown to be predictive for the development of obesity in mice after feeding a high fat diet for 8 weeks. This observation led to the supposition that adipose tissue expression of this subset of genes within inbred strains of mice could be associated with their susceptibility in the development of adiposity when fed a low fat diet. The analyses of male mice from 5 inbred strains showed average bodyweights ranging from 25.82 to 36.58 g at 16 weeks of age. Bodyweight was highest for AKR/J and adiposity correlated highly with bodyweight for all strains. Analyses of epididymal fat gene expression showed Mest, Sfrp5 and Bmp3 to be highly concomitant with adiposity across all strains of mice. Naked 1 (Nkd1), a gene previously shown to be associated with variations of adiposity in mice fed a high fat diet, but not predictive for the development of adiposity, showed no correlation with adiposity. In addition, the expression of Mest and Sfrp5 were tightly associated across the 5 mouse strains with the highest and lowest expression occurring in DBA/2J and C57BL/6J (B6) respectively suggesting a common mechanism for their regulation. Surprisingly, when independent cohorts for these 2 strains were fed high fat diet for 8 weeks, DBA/2J showed no further increase in Sfrp5 expression whereas expression levels for B6 mice were induced almost 20-fold. Analyses of (B6 x DBA2/J) F1 mice fed a low fat diet for 8 weeks showed intermediate levels of adiposity and gene expression for Sfrp5 and Mest suggesting a strong genetic basis for these differences.

Keywords: Bmp3; Epigenetics; Genetics; Mest; Obesity; Sfrp5.


Conflict of interest statement

The authors declare that there are no conflicts of interest.

Figures

Figure 1
Figure 1
Analyses of Mest (A), Sfrp5 (B), Bmp3 (C) and Nkd1 (D) mRNA expression in epididymal fat (EPI) of 5 inbred mouse strains fed a low fat diet (LFD) until 16 weeks of age. Gene expression measured by TaqMan QRT-PCR is represented as arbitrary units (AU) normalized to cyclophilin b. Each strain represents the mean ± SEM of at least 9 mice. Datasets annotated with the same letter indicate no significant differences between groups. Mest expression (A) is significantly higher in DBA/2J compared with B6 (P<0.0001), A/J (P=0.0002), 129SV (P=0.0007) and AKR (P=0.029). Sfrp5 expression (B) is significantly higher in DBA/2J compared with all strains (P<0.0001); and, AKR is higher than B6 (P=0.0007), 129SV (P=0.004) and A/J (P=0.02). Bmp3 expression (C) is significantly higher in DBA/2J compared with B6 (P=0.0003), A/J (P=0.006), 129SV (P=0.03); and higher in AKR compared with B6 (P=0.002) and A/J (P=0.03). Nkd1 expression (D) is significantly higher in A/J compared to B6 (P=0.04).
Figure 2
Figure 2
Data represents the correlation between indices of adiposity (% FAT) with Sfrp5 (A) and Mest (B) gene expression; and, the correlation between Mest and Sfrp5 gene expression in all individuals from the 5 mouse strains (C) or by the mean ± SEM of each of the strains (D). Each strain represents the mean ± SEM of at least 9 mice. Body composition was measured via NMR. Gene expression measured by TaqMan QRT-PCR is represented as arbitrary units (AU) normalized to cyclophilin b.
Figure 3
Figure 3
Analyses of bodyweight (BWT; A), lean mass (B), fat mass (C), adiposity (%FAT; D); and, epididymal (EPI) fat Mest (E) and Sfrp5 (F) mRNA expression in B6 and DBA/2J inbred mice fed a low fat diet (LFD) until 8 weeks of age and then fed either the LFD or a high fat diet (HFD; 58% kcal fat) for an additional 8 weeks until 16 weeks of age. Body composition was measured via NMR. Gene expression measured by TaqMan QRT-PCR is represented as arbitrary units (AU) normalized to cyclophilin b. Each group represents the mean ± SEM of at least 9 mice. Datasets annotated with ns, ** and **** indicate no significant differences, P<0.01 and P<0.0001 between groups respectively.
Figure 4
Figure 4
Data shows a scatterplot of bodyweight (BWT; A), lean mass (B), fat mass (C) and adiposity (% FAT; B) in of B6, DBA/2J and (B6 × DBA/2J)F1 hybrid (B6D2F1) mice fed a low fat diet (LFD) until 16 weeks of age. Body composition was measured via NMR. Each group represents the mean ± SEM of 6–8 mice. Datasets annotated with 1, 2, 3 or 4 asterisks indicate significant differences of P<0.05, P<0.01, P<0.001 and P<0.0001 respectively.
Figure 5
Figure 5
Data shows a scatterplot of Mest (A), Sfrp5 (B) and Bmp3 (C) mRNA expression in epididymal fat (EPI) of B6 (n=8), DBA/2J (n=6) and (B6 × DBA/2J)F1 (n=8) hybrid (B6D2F1) mice fed a low fat diet (LFD) until 16 weeks of age. Gene expression measured by TaqMan QRT-PCR is represented as arbitrary units (AU) normalized to cyclophilin b. Each group represents the mean ± SEM of 6–8 mice. Datasets annotated with 1, 2, and 4 asterisks indicate significant differences of P<0.05, P<0.01, and P<0.0001 respectively.

References

    1. Burcelin R, et al. Heterogeneous metabolic adaptation of C57BL/6J mice to high-fat diet. Am J Physiol Endocrinol Metab. 2002;282(4):E834–E842. - PubMed
    1. Koza RA, et al. Changes in gene expression foreshadow diet-induced obesity in genetically identical mice. PLoS Genet. 2006;2(5):e81. - PMC - PubMed
    1. Takahashi M, Kamei Y, Ezaki O. Mest/Peg1 imprinted gene enlarges adipocytes and is a marker of adipocyte size. Am J Physiol Endocrinol Metab. 2004 - PubMed
    1. Moraes RC, et al. Study of the alteration of gene expression in adipose tissue of diet-induced obese mice by microarray and reverse transcription-polymerase chain reaction analyses. Endocrinology. 2003;144(11):4773–4782. - PubMed
    1. Soukas A, et al. Leptin-specific patterns of gene expression in white adipose tissue. Genes Dev. 2000;14(8):963–980. - PMC - PubMed

Publication types

Substances

LinkOut - more resources