

Broad diversity of host responses of the white-footed mouse Peromyscus leucopus to Borrelia infection and antigens
- PMID: 26005106
- PMCID: PMC4504778
- DOI: 10.1016/j.ttbdis.2015.04.009
Broad diversity of host responses of the white-footed mouse Peromyscus leucopus to Borrelia infection and antigens
Abstract
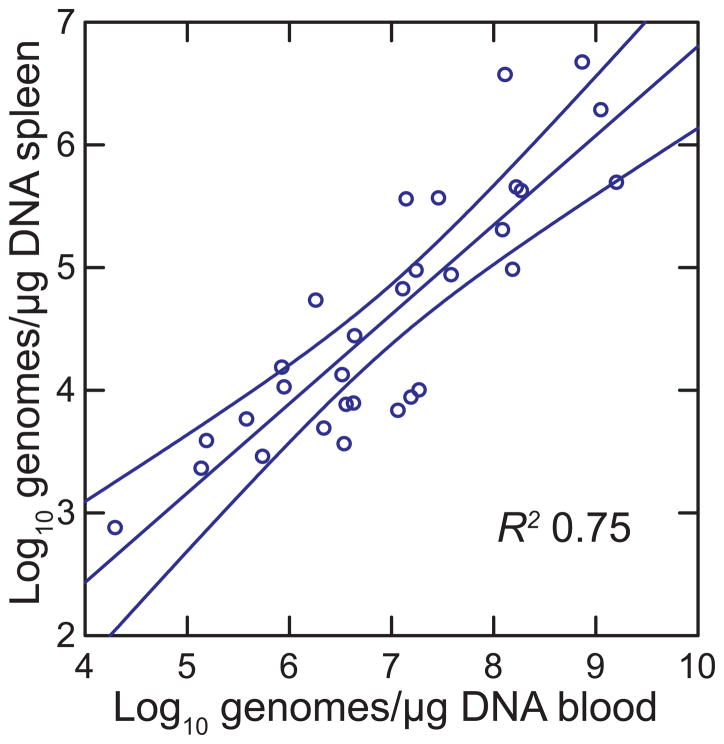
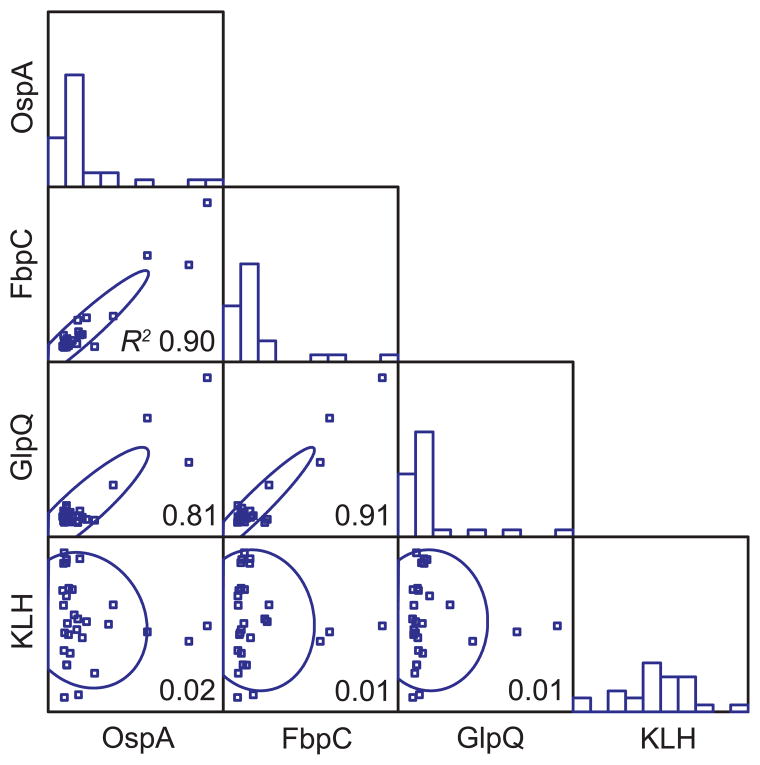
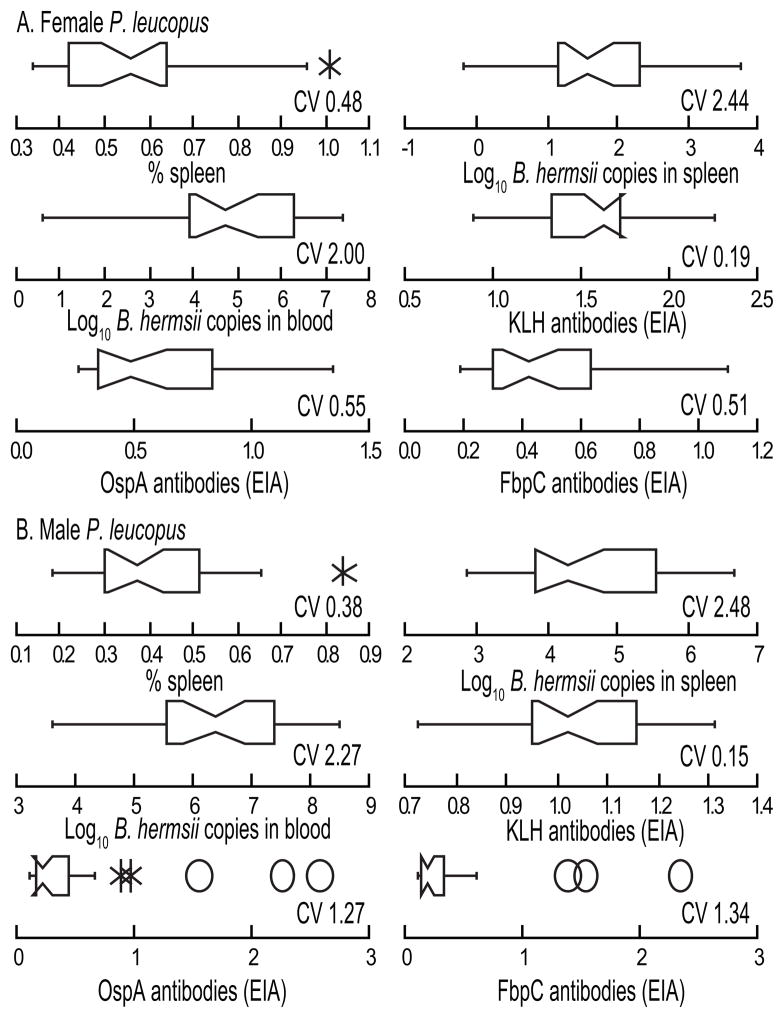
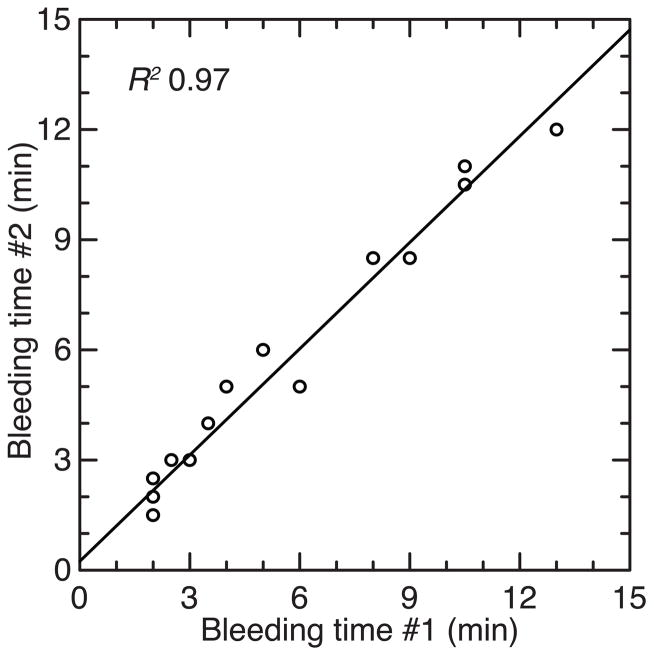
Peromyscus leucopus, the white-footed mouse, is one of the more abundant mammals of North America and is a major reservoir host for at least five tickborne diseases of humans, including Lyme disease and a newly-recognized form of relapsing fever. In comparison to Mus musculus, which is not a natural reservoir for any of these infections, there has been little research on experimental infections in P. leucopus. With the aim of further characterizing the diversity of phenotypes of host responses, we studied a selection of quantitative traits in colony-bred and -reared outbred P. leucopus adults that were uninfected, infected with the relapsing fever agent Borrelia hermsii alone, or infected after immunization with Lyme disease vaccine antigen OspA and keyhole limpet hemocyanin (KLH). The methods included measurements of organ weights, hematocrits, and bleeding times, quantitative PCR for bacterial burdens, and enzyme immunoassays for serum antibodies against both the immunization proteins and cellular antigens of the infecting organism. The results included the following: (i) uninfected animals displayed wide variation in relative sizes of their spleens and in their bleeding times. (ii) In an experiment with matched littermates, no differences were observed between females and males at 7 days of infection in bacterial burdens in blood and spleen, relative spleen size, or antibody responses to the B. hermsii specific-antigen, FbpC. (iii) In studies of larger groups of males or females, the wide variations between bacterial burdens and in relative spleen sizes between individuals was confirmed. (iv) In these separate groups of males and females, all animals showed moderate-to-high levels of antibodies to KLH but wide variation in antibody levels to OspA and to FbpC. The study demonstrated the diversity of host responses to infection and immunization in this species and identified quantitative traits that may be suitable for forward genetics approaches to reservoir-pathogen interactions.
Keywords: Lyme disease; Relapsing fever; Reservoir; Tickborne; Vaccine; Wildlife.
Copyright © 2015 Elsevier GmbH. All rights reserved.
Figures


Similar articles
-
Genomes, expression profiles, and diversity of mitochondria of the White-footed Deermouse Peromyscus leucopus, reservoir of Lyme disease and other zoonoses.Sci Rep. 2019 Nov 26;9(1):17618. doi: 10.1038/s41598-019-54389-3. Sci Rep. 2019. PMID: 31772306 Free PMC article.
-
Experimental infections of the reservoir species Peromyscus leucopus with diverse strains of Borrelia burgdorferi, a Lyme disease agent.mBio. 2012 Dec 4;3(6):e00434-12. doi: 10.1128/mBio.00434-12. mBio. 2012. PMID: 23221801 Free PMC article.
-
Seasonal prevalence of Borrelia burgdorferi in natural populations of white-footed mice, Peromyscus leucopus.J Clin Microbiol. 1987 Aug;25(8):1564-6. doi: 10.1128/jcm.25.8.1564-1566.1987. J Clin Microbiol. 1987. PMID: 3624451 Free PMC article.
-
OspA immunization decreases transmission of Borrelia burgdorferi spirochetes from infected Peromyscus leucopus mice to larval Ixodes scapularis ticks.Vector Borne Zoonotic Dis. 2001 Spring;1(1):65-74. doi: 10.1089/153036601750137705. Vector Borne Zoonotic Dis. 2001. PMID: 12653137
-
Infection resistance and tolerance in Peromyscus spp., natural reservoirs of microbes that are virulent for humans.Semin Cell Dev Biol. 2017 Jan;61:115-122. doi: 10.1016/j.semcdb.2016.07.002. Epub 2016 Jul 2. Semin Cell Dev Biol. 2017. PMID: 27381345 Free PMC article. Review.
Cited by
-
Peromyscus transcriptomics: Understanding adaptation and gene expression plasticity within and between species of deer mice.Semin Cell Dev Biol. 2017 Jan;61:131-139. doi: 10.1016/j.semcdb.2016.08.011. Epub 2016 Aug 12. Semin Cell Dev Biol. 2017. PMID: 27531052 Free PMC article. Review.
-
Host associations and genomic diversity of Borrelia hermsii in an endemic focus of tick-borne relapsing fever in western North America.Parasit Vectors. 2016 Nov 10;9(1):575. doi: 10.1186/s13071-016-1863-0. Parasit Vectors. 2016. PMID: 27832805 Free PMC article.
-
Peromyscus spp. Deer Mice as Rodent Model of Acute Leptospirosis.Emerg Infect Dis. 2025 Jul;31(7):1365-1376. doi: 10.3201/eid3107.241579. Emerg Infect Dis. 2025. PMID: 40562727 Free PMC article.
-
The genome of Peromyscus leucopus, natural host for Lyme disease and other emerging infections.Sci Adv. 2019 Jul 24;5(7):eaaw6441. doi: 10.1126/sciadv.aaw6441. eCollection 2019 Jul. Sci Adv. 2019. PMID: 31355335 Free PMC article.
-
Borrelia burgdorferi BBK32 Inhibits the Classical Pathway by Blocking Activation of the C1 Complement Complex.PLoS Pathog. 2016 Jan 25;12(1):e1005404. doi: 10.1371/journal.ppat.1005404. eCollection 2016 Jan. PLoS Pathog. 2016. PMID: 26808924 Free PMC article.
References
-
- Amman BR, Manangan AP, Flietstra TD, Calisher CH, Carroll DS, Wagoner KD, Mills JN. Association between movement and Sin Nombre virus (Bunyaviridae: Hantavirus) infection in North American deermice (Peromyscus maniculatus) in Colorado. J Wildl Dis. 2013;49:132–142. - PubMed
-
- Baker RH. Habitats and distribution. In: King JA, editor. Biology of Peromyscus (Rodentia) American Society of Mammalogists; Stillwater, OK: 1968.
Publication types
MeSH terms
Substances
Grants and funding
LinkOut - more resources
Full Text Sources
Other Literature Sources
