. 2015 May 8:8:12.
doi: 10.3389/fnmol.2015.00012. eCollection 2015.

Intracellular calcium dynamics in cortical microglia responding to focal laser injury in the PC::G5-tdT reporter mouse

Affiliations

Intracellular calcium dynamics in cortical microglia responding to focal laser injury in the PC::G5-tdT reporter mouse

Amir Pozner et al. Front Mol Neurosci. .

Abstract

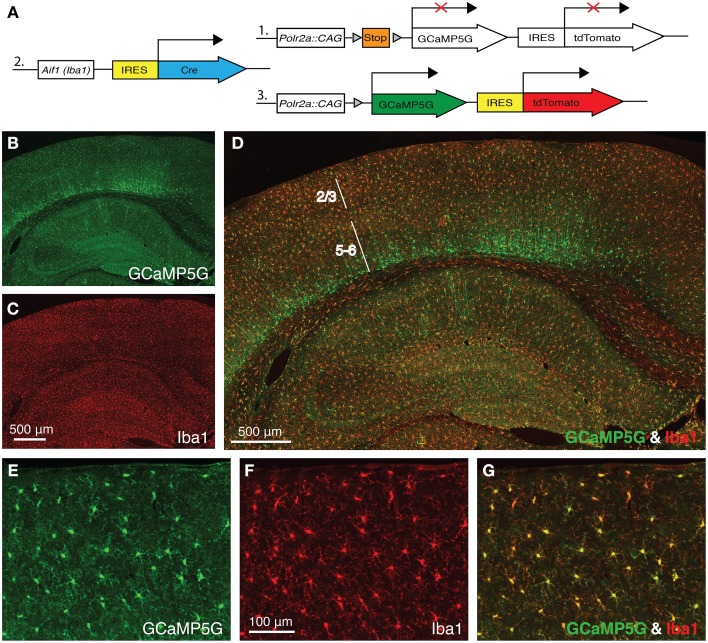
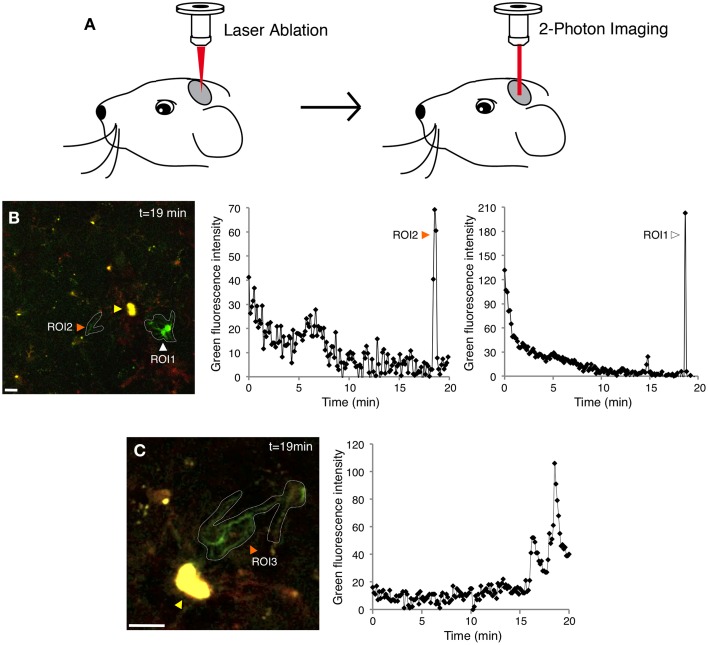
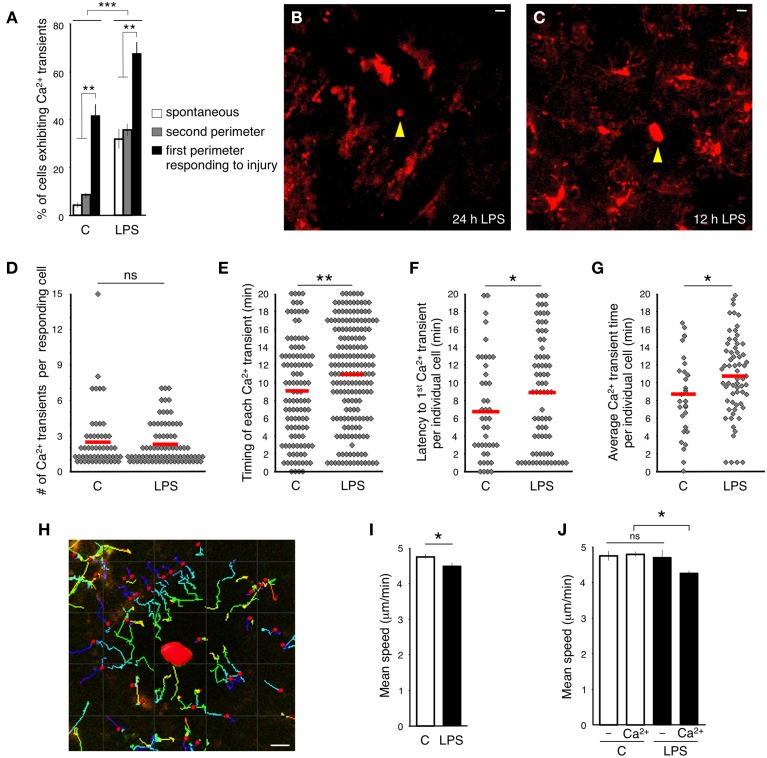
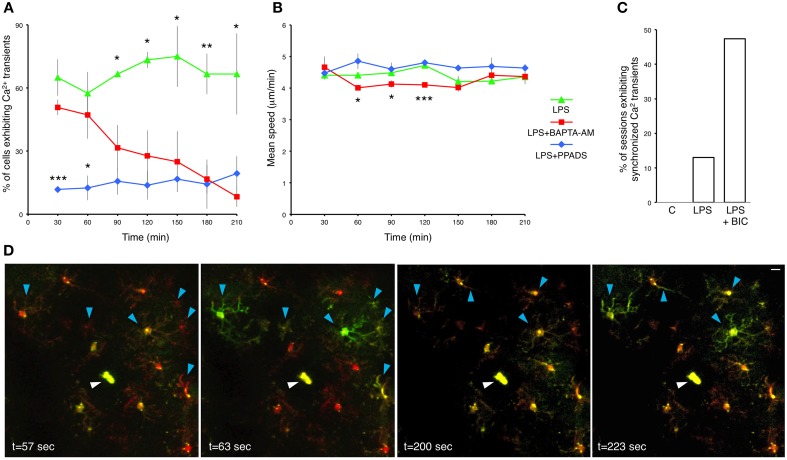
Microglia, the resident immune cells of the brain parenchyma, are highly responsive to tissue injury. Following cell damage, microglial processes redirect their motility from randomly scouting the extracellular space to specifically reaching toward the compromised tissue. While the cell morphology aspects of this defense mechanism have been characterized, the intracellular events underlying these responses remain largely unknown. Specifically, the role of intracellular Ca(2+) dynamics has not been systematically investigated in acutely activated microglia due to technical difficulty. Here we used live two-photon imaging of the mouse cortex ubiquitously expressing the genetically encoded Ca(2+) indicator GCaMP5G and fluorescent marker tdTomato in central nervous system microglia. We found that spontaneous Ca(2+) transients in microglial somas and processes were generally low (only 4% of all microglia showing transients within 20 min), but baseline activity increased about 8-fold when the animals were treated with LPS 12 h before imaging. When challenged with focal laser injury, an additional surge in Ca(2+) activity was observed in the somas and protruding processes. Notably, coherent and simultaneous Ca(2+) rises in multiple microglial cells were occasionally detected in LPS-treated animals. We show that Ca(2+) transients were pre-dominantly mediated via purinergic receptors. This work demonstrates the usefulness of genetically encoded Ca(2+) indicators for investigation of microglial physiology.

Keywords: GCaMP5G; GECI; PC::G5-tdT; calcium imaging; microglia; purinergic receptors.


Figures

Figure 1
Figure 1
Aif1-IRES-Cre driver labels Iba1-positive microglia. (A) A schematic diagram of the PC::G5-tdT allele (1) crossed with Aif1-IRES-Cre (2). Expression of IRES-Cre at the Aif1 locus results in the expression of GCaMP5G and tdTomato following Cre-mediated excision of the STOP cassette (3). (B–D) A coronal section of Aif1-IRES-Cre; PC::G5-tdT brain stained with anti-GFP (GCaMP5G) and anti-Iba1 antibodies. (B) The section was imaged specifically in the green channel (GCaMP5G expression), (C) red channel (Iba1 expression) and (D) overlay of green and red channels. The PC::G5-tdT allele is expressed in all Aif1 lineage cells, including layer 5/6 cortical neurons. Layers 2/3 and 5–6 are indicated. (E–G) Coronal sections of somatosensory cortex layer 2/3 region of Aif1-IRES-Cre; PC::G5-tdT brains stained with anti-GFP and anti-Iba1 antibodies. (E) GCaMP5G expression, (F) endogenous Iba1 staining and (G) Overlay. PC::G5-tdT was co-expressed in all Iba1-positive cells studied in these experiments. Adult animals (6–8 weeks) were used for immunohistochemistry in (B-G).
Figure 2
Figure 2
Simultaneous two-photon imaging of tdTomato and GCaMP5G signals in cortical microglia. (A) Cartoon demonstrating the two-photon microscopy approach used to image microglial Ca2+ responses after laser inflicted focal injury in layer 2/3 of the somatosensory or visual cortex. (B) GCaMP5G fluorescence remains stable, allowing long imaging sessions (Supplementary Movie 2). A recording of green fluorescence intensity in ROI1 (white arrowhead) shows a large Ca2+ transient in the soma and processes 19 min after the laser injury. Another recording in ROI2 (orange arrowhead) shows a Ca2+ transient localized mainly to the microglial processes. The corresponding tdTomato fluorescence time series for this experiment is shown in Supplementary Figure 2B and Supplementary Movie 1. (C) A different example of a process-restricted Ca2+ transient. Variability in branch spiking was often observed in the same cell (Supplementary Movie 3). ROI; Region of Interest. Yellow arrowheads indicate the laser injury sites. Scale bars: 10 μm.
Figure 3
Figure 3
Effect of systemic peripheral inflammation on intracellular calcium dynamics in microglia. (A) Percentage of microglia exhibiting Ca2+ transients in response to focal laser injury and LPS induced peripheral inflammation. White bars show the percentage of cells exhibiting spontaneous Ca2+ transients. Gray bars specify the percentage of 2nd perimeter microglia positive for Ca2+ transients. Black bars illustrate the percentage of Ca2+ positive 1st perimeter microglia. We define 1st perimeter microglia as the circle of microglial cells that are most proximal to the laser ablation site. Their processes always spread toward the injury. 2nd perimeter microglia have their cell bodies located farther away, behind the 1st perimeter microglia. 2nd perimeter microglial processes do not spread toward the injury in our experiments. (B) A representative image of inflammation-activated microglia with amoeboid-like appearance. Focal laser injury (yellow arrowhead) was induced 24 h after subcutaneous LPS administration and imaged immediately after the ablation. (C) Twelve hour after the injection, LPS-primed microglia maintained normal ramified morphology. Focal laser injury (yellow arrowhead) was induced 12 h after LPS administration. (D) A graph illustrating the distribution of the number of Ca2+ transients in responding cells during the entire imaging session. No significant (ns) differences were detected between control and LPS-primed cells. The red lines indicate the means. (E) Time between injury and each individual Ca2+ transient emerging in responding cells. (F) Latency between the time of injury and the first Ca2+ transient observed in a specific responding cell. (G) Latency from the time of injury to the average emergence time of all Ca2+ transients detected per one responding cell. (H) An example of tracking the microglial process movement with Imaris software. The injury site is marked in red. (I) Average speed of process protrusion was significantly reduced in LPS-primed microglia. (J) No process speed difference was found between LPS-primed microglia not exhibiting Ca2+ transients and control cells. In contrast, the mean process speed was significantly reduced in LPS-primed Ca2+-positive microglia. Bar graphs are mean ± SEM from n = 3 mice (>10 cells per mouse), (>18 cells per mouse in I–J). *p < 0.05, **p < 0.005 by Student's t-test, ***p < 0.02 by a 2 × 3 factor ANOVA (treatments × groups). Scale bars: 10 μm.
Figure 4
Figure 4
Pharmacological interrogation of calcium responses in LPS-primed microglia. (A) Percentage of LPS-primed microglia exhibiting Ca2+ transients in response to focal laser injury as a function of time. BAPTA-AM (5 μg/ml) and PPADS (5 mM) were topically applied through the craniotomy 12 h after subcutaneous LPS administration. Two focal laser injuries were induced half an hour later, and were immediately followed by a 20 min long imaging session. Successive injury/imaging sessions were taken in 30 min intervals. Upper asterisks refer to statistical significance between LPS and LPS+BAPTA-AM treatments. Lower asterisks refer to statistical significance between LPS+BAPTA-AM and LPS+PPADS treatments. (B) Average speed of microglial processes as a function of time after BAPTA-AM and PPADS application. (C) A bar graph illustrating the fraction of imaging sessions which include synchronized microglial Ca2+ transients during 20 min recordings after focal laser injury. C-control: untreated mice. LPS: primed mice 12 h post-subcutaneous LPS administration. LPS+BIC: 12 h LPS-primed mice treated with topical application of bicuculline (250 μM). (D) Time lapse images from a representative 20 min recording session showing synchronized microglial Ca2+ transients traversing across the entire imaging field. This particular example shows two distinct waves at t = 63 s and t = 223 s. Blue arrowheads indicate cell bodies and processes of the microglia demonstrating synchronized Ca2+ waves. White arrowheads indicate the laser injury sites. Data are mean ± SEM (n = 3 mice, 4–10 cells for each time point per mouse). *p < 0.05, **p < 0.01, ***p < 0.005 by Student's t-test. Scale bar: 10 μm.

References

    1. Aguzzi A., Barres B. A., Bennett M. L. (2013). Microglia: scapegoat, saboteur, or something else? Science 339, 156–161. 10.1126/science.1227901 - DOI - PMC - PubMed
    1. Akerboom J., Chen T. W., Wardill T. J., Tian L., Marvin J. S., Mutlu S., et al. . (2012). Optimization of a GCaMP calcium indicator for neural activity imaging. J. Neurosci. 32, 13819–13840. 10.1523/JNEUROSCI.2601-12.2012 - DOI - PMC - PubMed
    1. Berridge M. J., Bootman M. D., Roderick H. L. (2003). Calcium signalling: dynamics, homeostasis and remodelling. Nat. Rev. Mol. Cell Biol. 4, 517–529. 10.1038/nrm1155 - DOI - PubMed
    1. Brawek B., Garaschuk O. (2013). Microglial calcium signaling in the adult, aged and diseased brain. Cell Calcium 53, 159–169. 10.1016/j.ceca.2012.12.003 - DOI - PubMed
    1. Busche M. A., Eichhoff G., Adelsberger H., Abramowski D., Wiederhold K. H., Haass C., et al. . (2008). Clusters of hyperactive neurons near amyloid plaques in a mouse model of Alzheimer's disease. Science 321, 1686–1689. 10.1126/science.1162844 - DOI - PubMed

LinkOut - more resources