. 2015 May 8:9:167.
doi: 10.3389/fncel.2015.00167. eCollection 2015.

Differential expression of sirtuins in the aging rat brain

Affiliations

Differential expression of sirtuins in the aging rat brain

Nady Braidy et al. Front Cell Neurosci. .

Abstract

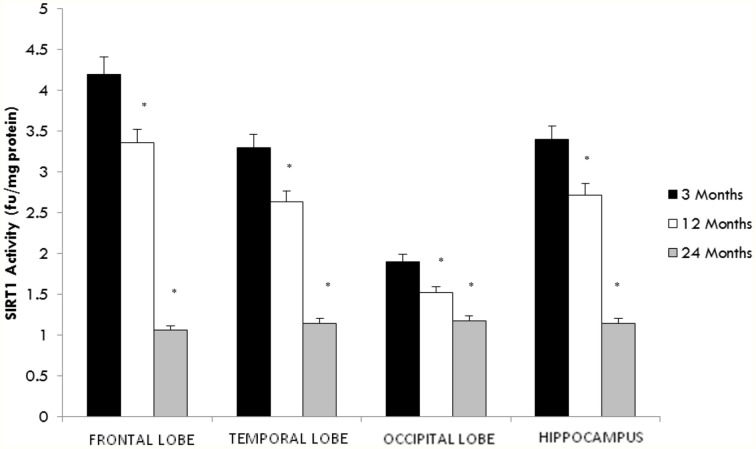
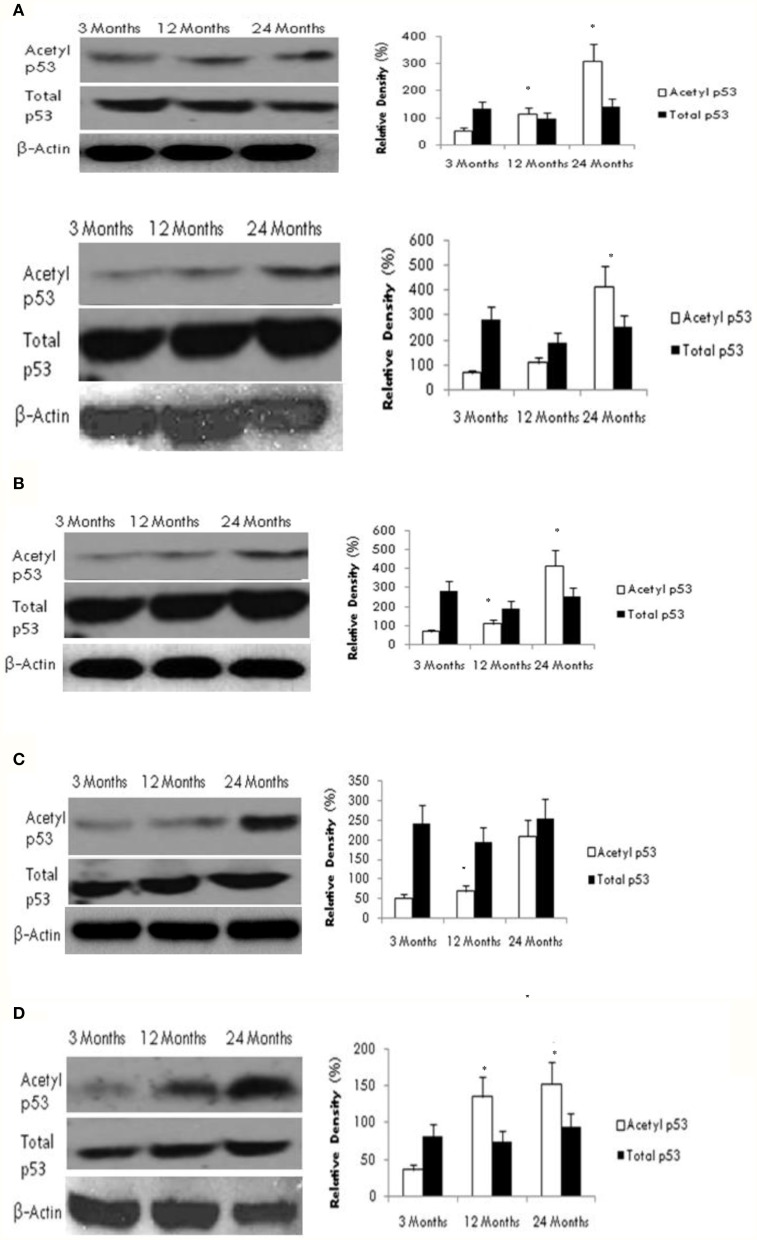
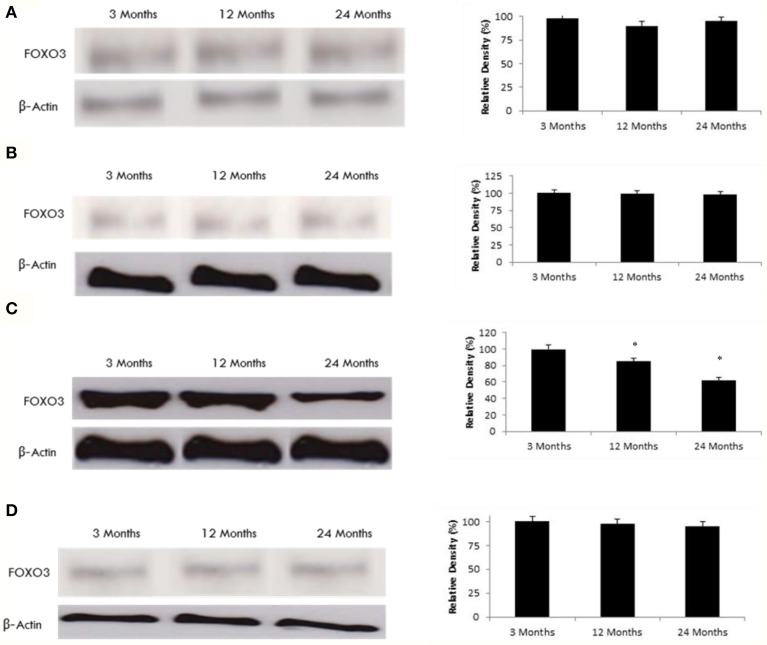
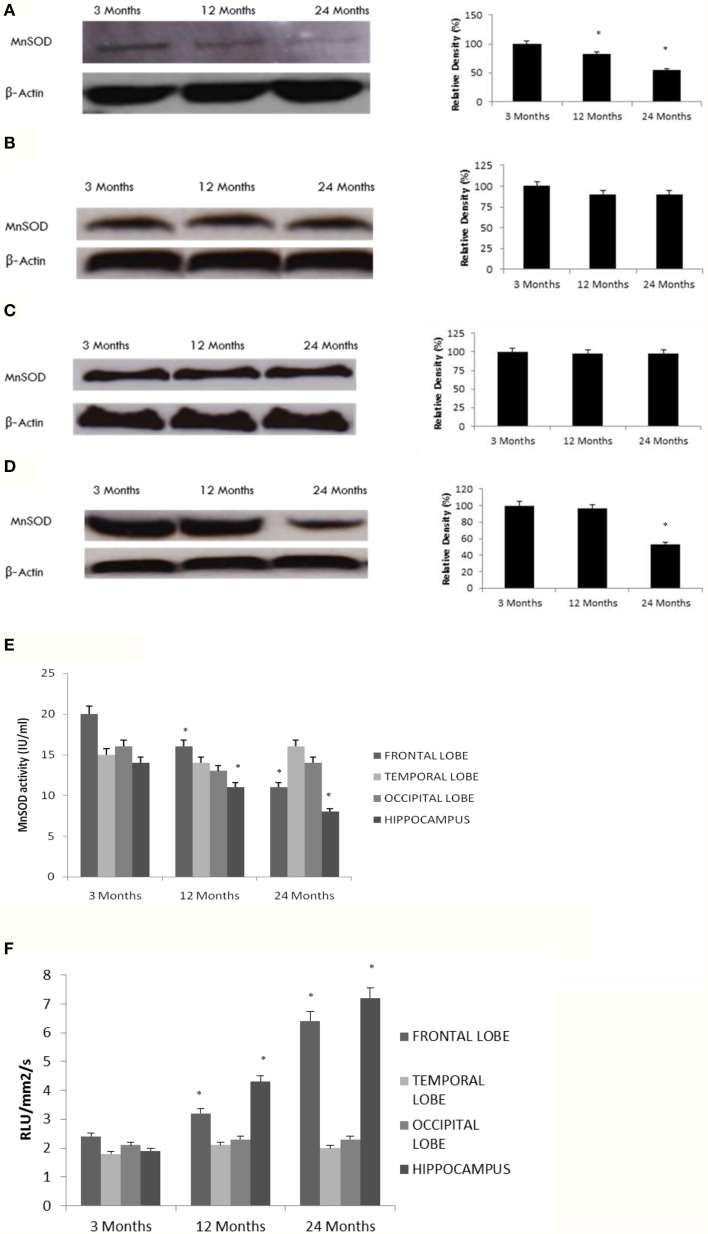
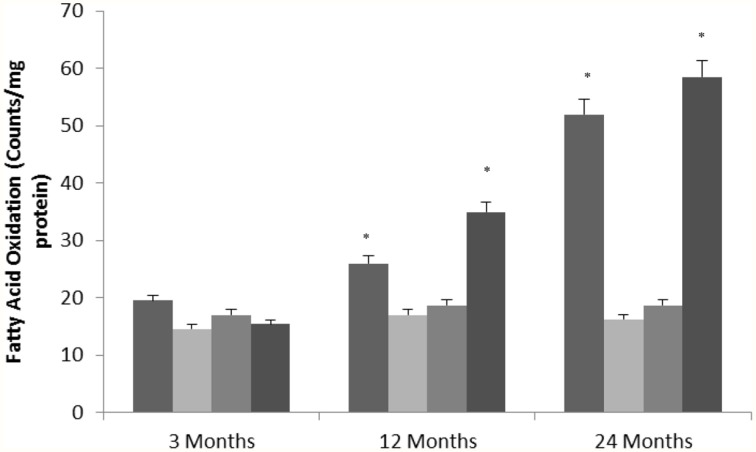
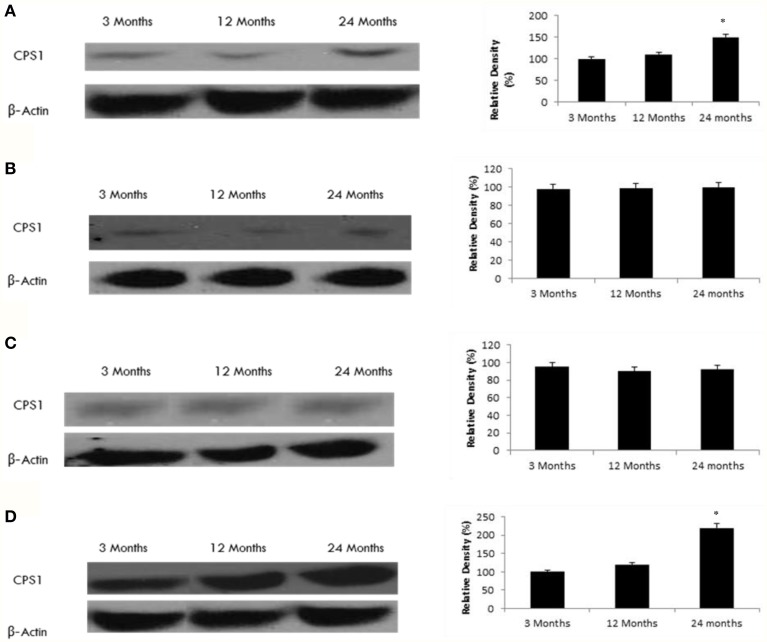
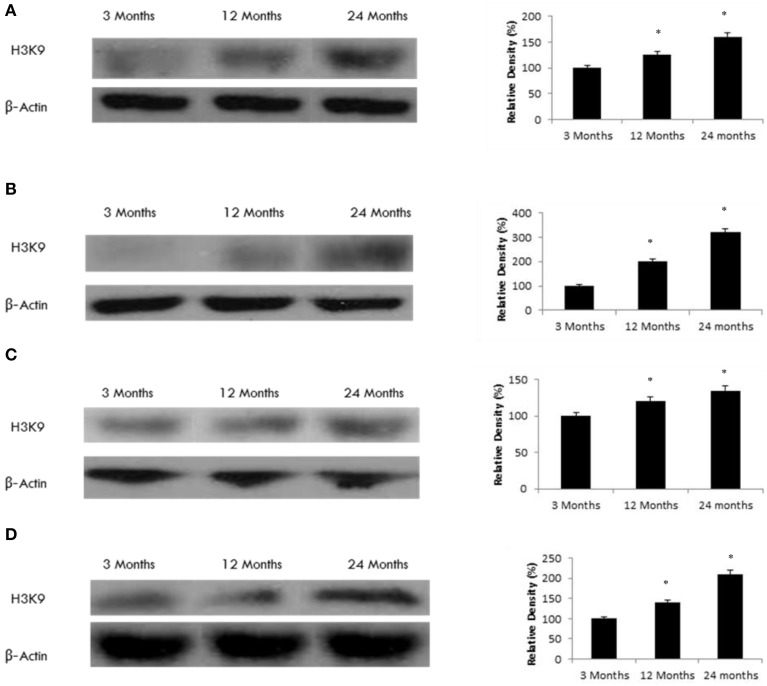
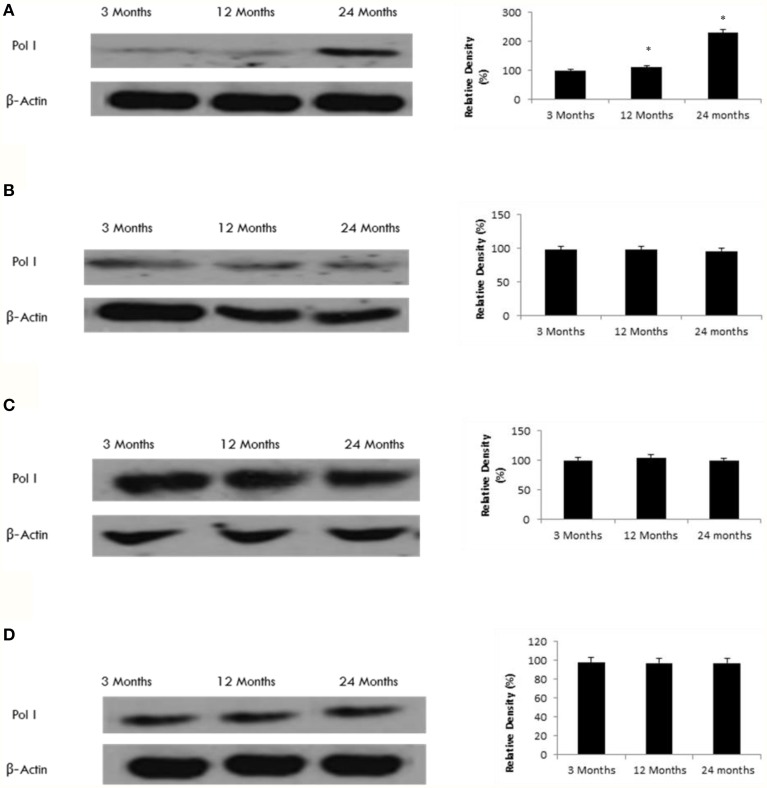
Although there are seven mammalian sirtuins (SIRT1-7), little is known about their expression in the aging brain. To characterize the change(s) in mRNA and protein expression of SIRT1-7 and their associated proteins in the brain of "physiologically" aged Wistar rats. We tested mRNA and protein expression levels of rat SIRT1-7, and the levels of associated proteins in the brain using RT-PCR and western blotting. Our data shows that SIRT1 expression increases with age, concurrently with increased acetylated p53 levels in all brain regions investigated. SIRT2 and FOXO3a protein levels increased only in the occipital lobe. SIRT3-5 expression declined significantly in the hippocampus and frontal lobe, associated with increases in superoxide and fatty acid oxidation levels, and acetylated CPS-1 protein expression, and a reduction in MnSOD level. While SIRT6 expression declines significantly with age acetylated H3K9 protein expression is increased throughout the brain. SIRT7 and Pol I protein expression increased in the frontal lobe. This study identifies previously unknown roles for sirtuins in regulating cellular homeostasis and healthy aging.

Keywords: aging; brain; longevity; p53; sirtuins.


Figures

Figure 1
Figure 1
Altered SIRT1 activity in the aging rat brain. Reduced SIRT1 activity was observed in the aging rat brain after 12 months of age using a fluorimetry based assay which detected the deacetylation of lysine residues. All values are means ± S.E.M. using brains from eight rats for each age group. Significance *p < 0.01 compared to 3 month old rats.
Figure 2
Figure 2
Reduced SIRT1 activity promotes p53 acetylation in the aging brain. Acetylated p53 and total p53 levels were determined by Western blotting in (A) frontal lobe, (B) temporal lobe, (C) occipital lobe, and (D) hippocampus in the brain with aging using anti-acetylated p53 and anti-total p53 antibodies. The blots shown are representative tracings of an experiment repeated eight times. Graphs are mean ± S.E brains of data from brains using eight rats for each age group. Significance *p < 0.01 was established by comparison with 3 month old rats.
Figure 3
Figure 3
FOXO3 protein expression is altered in the aging rat brain occipital lobe. Western blotting for FOXO3 in (A) frontal lobe, (B) temporal lobe, (C) occipital lobe, and (D) hippocampus in the brain with aging using anti-FOXO3a antibody. The blots shown are representative tracings of an experiment done eight times. Graphs are mean ± S.E brains from brains from eight different rats for each age group. Each bar of the quantification graph represents the corresponding band for each age group. Significance *p < 0.01 compared to 3 month old rats.
Figure 4
Figure 4
Reduced MnSOD correlates with SIRT3 pattern of expression in the aging rat brain. Western blotting for MnSOD in (A) frontal lobe, (B) temporal lobe, (C) occipital lobe, and (D) hippocampus in the brain with aging using anti-MnSOD antibody. The blots shown are representative tracings of an experiment done eight times. Graphs are mean ± S.E brains from brains from eight different rats for each age group. Each bar of the quantification graph represents the corresponding band for each age group. Significance *p < 0.01 compared to 3 month old rats. (E) MnSOD activity in aged rat brain tissue. Significance *p < 0.01 compared to 3 month old rats. (F) Superoxide levels in aged rat brain tissue. Significance *p < 0.01 compared to 3 month old rats.
Figure 5
Figure 5
SIRT4 protein expression regulates fatty oxidation in the aging rat brain. Fatty acid oxidation in aged rat brain tissue. Significance *p < 0.01 compared to 3 month old rats.
Figure 6
Figure 6
Raised acetylated CPS1 protein levels in the aging rat brain. Western blotting for acetylated CPS1 in (A) frontal lobe, (B) temporal lobe, (C) occipital lobe, and (D) hippocampus in the brain with aging. The blots shown are representative tracings of an experiment done eight times. Graphs are mean ± S.E brains from brains from eight different rats for each age group. Each bar of the quantification graph represents the corresponding band for each age group. Significance *p < 0.01 compared to 3 month old rats.
Figure 7
Figure 7
Raised acetylated H3K9 protein levels in the aging rat brain. Western blotting for acetylated H3K9 in (A) frontal lobe, (B) temporal lobe, (C) occipital lobe, and (D) hippocampus in the brain with aging. The blots shown are representative tracings of an experiment done eight times. Graphs are mean ± S.E brains from brains from eight different rats for each age group. Each bar of the quantification graph represents the corresponding band for each age group. Significance *p < 0.01 compared to 3 month old rats.
Figure 8
Figure 8
Raised Pol I protein levels in the aging rat brain. Western blotting for Pol I in (A) frontal lobe, (B) temporal lobe, (C) occipital lobe, and (D) hippocampus in the brain with aging. The blots shown are representative tracings of an experiment done eight times. Graphs are mean ± S.E brains from brains from eight different rats for each age group. Each bar of the quantification graph represents the corresponding band for each age group. Significance *p < 0.01 compared to 3 month old rats.

Similar articles

Cited by

References

    1. Ahn B., Kim H., Song S., Lee I., Liu J., Vassilopoulos A., et al. . (2008). A role for the mitochondrial deacetylase Sirt3 in regulating energy homeostasis. Proc. Natl. Acad. Sci. U.S.A. 105, 14447–14452. 10.1073/pnas.0803790105 - DOI - PMC - PubMed
    1. Alafuzoff I., Iqbal K., Friden H., Adolfsson R., Winblad B. (1987). Histopathological criteria for progressive dementia disorders: clinical-pathological correlation and classification by multivariate data analysis. Acta Neuropathol. (Berl) 74, 209–225. 10.1007/BF00688184 - DOI - PubMed
    1. Anastasiou D., Krek W. (2006). SIRT1: linking adaptive cellular responses to aging-associated changes in organismal physiology. Physiology (Bethesda) 21, 404–410. 10.1152/physiol.00031.2006 - DOI - PubMed
    1. Andersen J. (2004). Oxidative stress in neurodegeneration: cause or consequence? Nat. Med. 10(Suppl.), S18–S25. 10.1038/nrn1434 - DOI - PubMed
    1. Anekonda T. S., Reddy P. H. (2006). Neuronal protection by sirtuins in Alzheimer's disease. J. Neurochem. 96, 305–313. 10.1111/j.1471-4159.2005.03492.x - DOI - PubMed