. 2015 May 8:6:381.
doi: 10.3389/fmicb.2015.00381. eCollection 2015.

Multidimensional metrics for estimating phage abundance, distribution, gene density, and sequence coverage in metagenomes

Affiliations

Multidimensional metrics for estimating phage abundance, distribution, gene density, and sequence coverage in metagenomes

Ramy K Aziz et al. Front Microbiol. .

Abstract

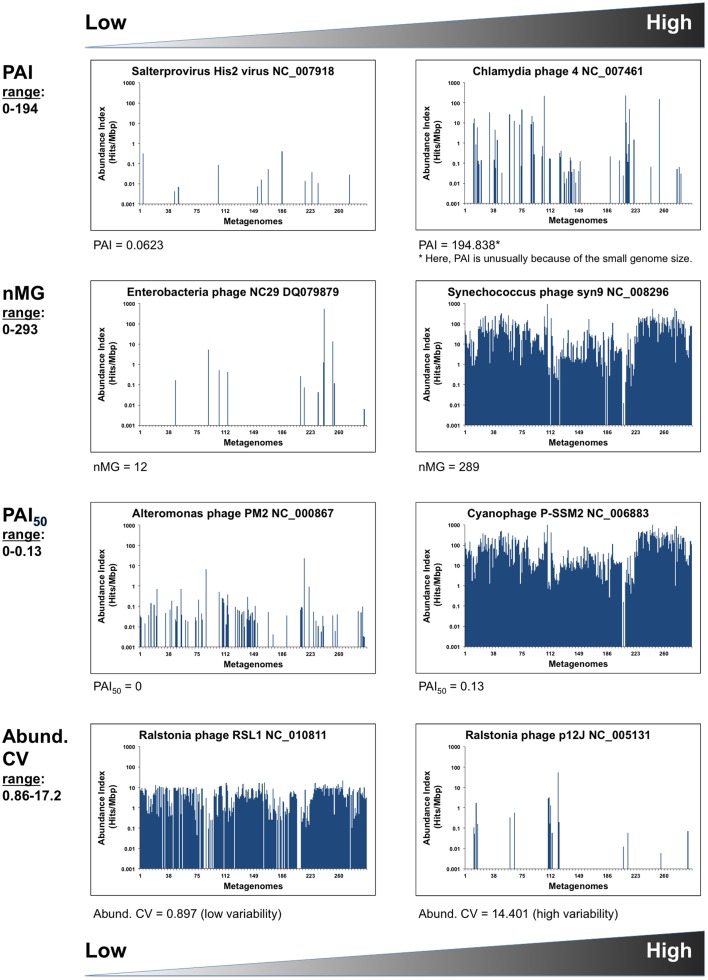
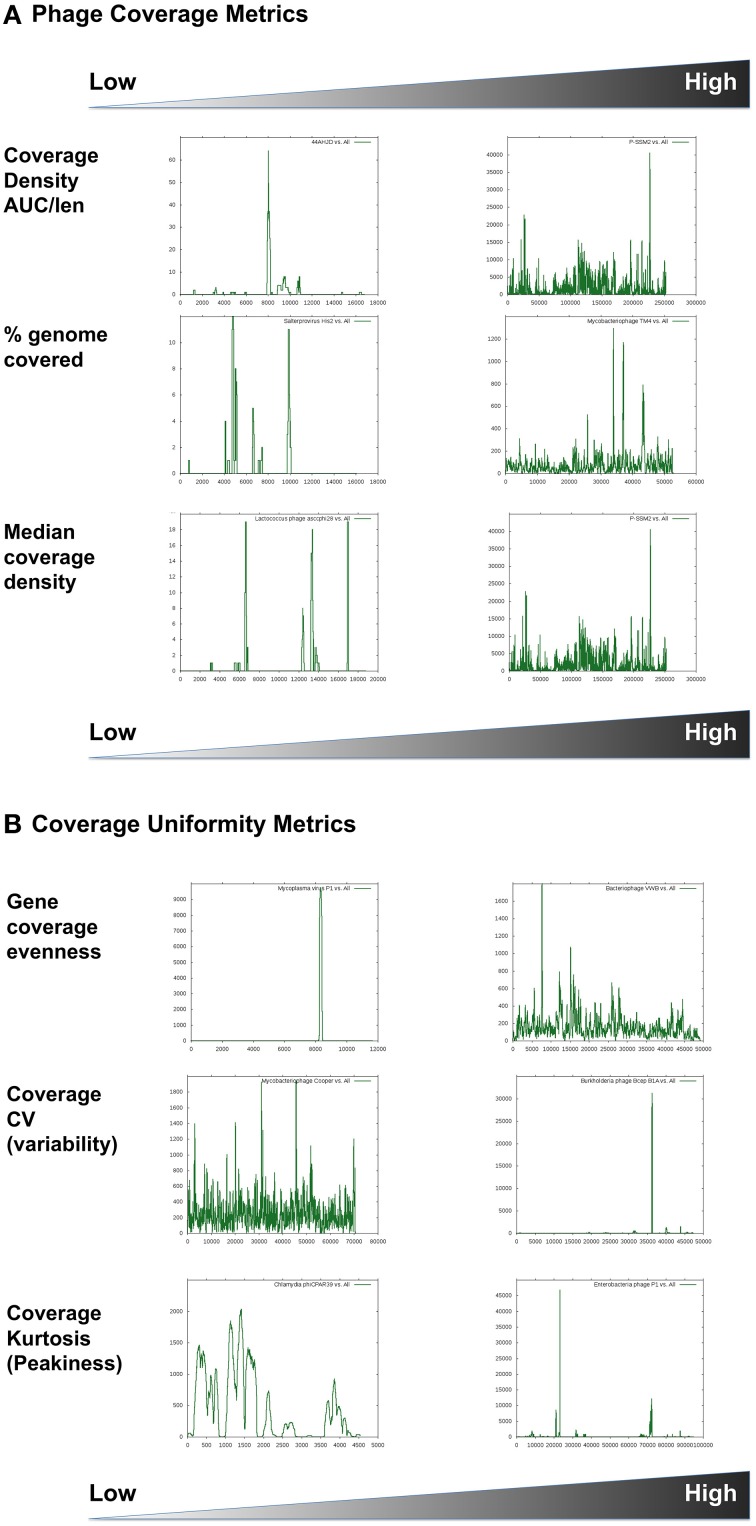
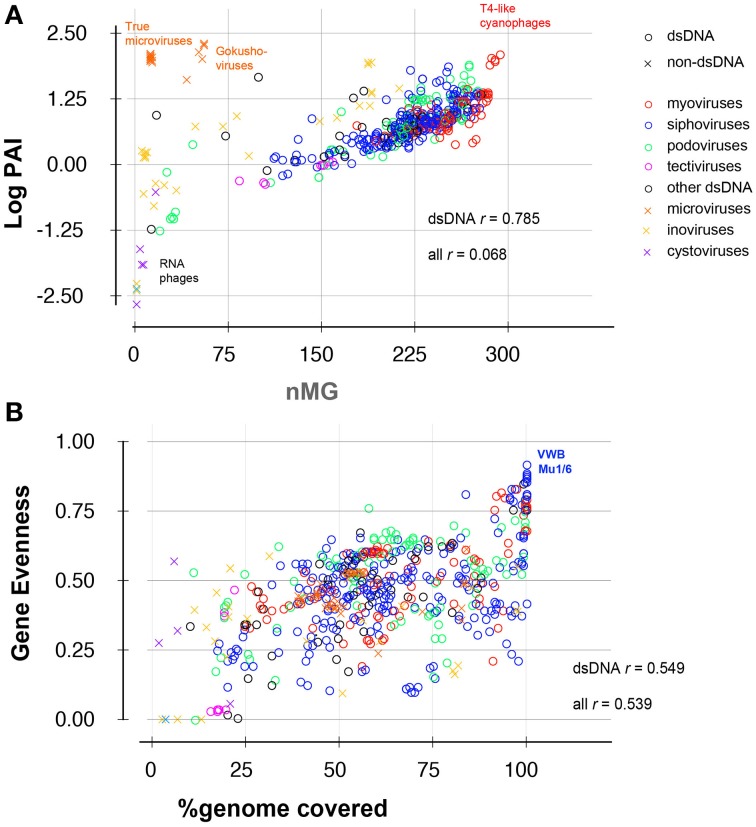
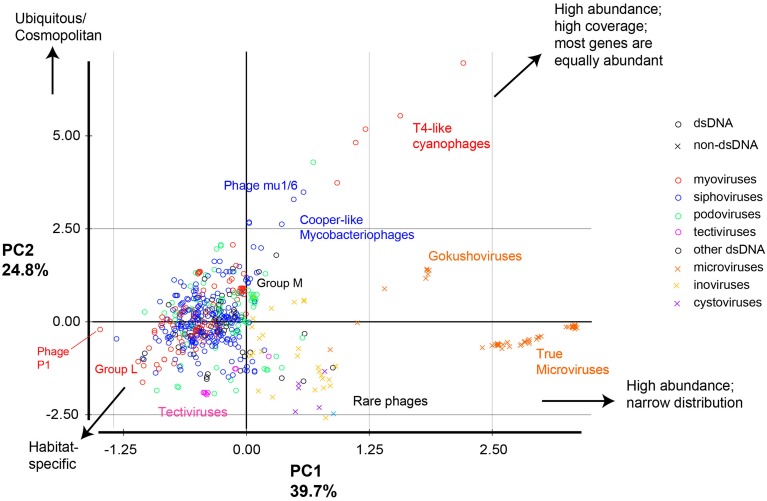
Phages are the most abundant biological entities on Earth and play major ecological roles, yet the current sequenced phage genomes do not adequately represent their diversity, and little is known about the abundance and distribution of these sequenced genomes in nature. Although the study of phage ecology has benefited tremendously from the emergence of metagenomic sequencing, a systematic survey of phage genes and genomes in various ecosystems is still lacking, and fundamental questions about phage biology, lifestyle, and ecology remain unanswered. To address these questions and improve comparative analysis of phages in different metagenomes, we screened a core set of publicly available metagenomic samples for sequences related to completely sequenced phages using the web tool, Phage Eco-Locator. We then adopted and deployed an array of mathematical and statistical metrics for a multidimensional estimation of the abundance and distribution of phage genes and genomes in various ecosystems. Experiments using those metrics individually showed their usefulness in emphasizing the pervasive, yet uneven, distribution of known phage sequences in environmental metagenomes. Using these metrics in combination allowed us to resolve phage genomes into clusters that correlated with their genotypes and taxonomic classes as well as their ecological properties. We propose adding this set of metrics to current metaviromic analysis pipelines, where they can provide insight regarding phage mosaicism, habitat specificity, and evolution.

Keywords: bacteriophage; ecology; genomics; metagenomics; virus.


Figures

Figure 1
Figure 1
Phage distribution metrics. Inter-phage metrics and statistics quantifying different aspects of phage abundance and distribution in 296 metagenomic samples. Graphical examples show the phage genomes at the high and low ends of each parameter. X-axes represent the metagenomes (MG) listed in the same order as in Table S1 (i.e., grouped by environment). Y-axes are in logarithmic scales.
Figure 2
Figure 2
Phage coverage metrics, including (A) density and (B) uniformity estimates. Graphical examples show high and low ends of each parameter used. X-axes represent the genome coordinates while Y-axes represent number of hits to each nucleotide. Graphs are scaled differently. The coverage plots are for the following phages: (A) Staphylococcus phage 44AHJD compared to Cyanophage P-SSM2; Salterprovirus His2 virus compared to Mycobacteriophage TM4; Lactococcus phage asccphi28 compared to Cyanophage P-SSM2. (B) Mycoplasma virus P1 compared to Bacteriophage VWB; Mycobacterophage Cooper compared to Burkholderia cenocepacia phage BcepB1A; Chlamydia phage phiCPAR39 compared to Enterobacteria phage P1.
Figure 3
Figure 3
Scatter plots showing correlation between (A) abundance and ubiquity or (B) gene evenness and % genome coverage of 588 viruses in 296 metagenomes. Data points are labeled according to phage family (different colors), and nucleic acid content (circles: dsDNA phages; crosses: other phages, i.e., ssRNA, dsRNA, and ssDNA phages). Correlation coefficients (r) are shown for all phages and for dsDNA phages alone.
Figure 4
Figure 4
Principal component analysis of phage genomes according to their ecological properties. All phages were compared based on 11 metrics, then the 11 dimensions were reduced into two principal components that explain most of the variance. Circles represent dsDNA phages and x signs represent other types of phage genomes; colors represent different phage classes. Examples of phages and groups of phage discussed in the text are labeled.

Similar articles

Cited by

References

    1. Abedon S. T. (2009). Phage evolution and ecology. Adv. Appl. Microbiol. 67, 1–45. 10.1016/S0065-2164(08)01001-0 - DOI - PubMed
    1. Altschul S. F., Madden T. L., Schaffer A. A., Zhang J., Zhang Z., Miller W., et al. . (1997). Gapped BLAST and PSI-BLAST: a new generation of protein database search programs. Nucleic Acids Res. 25, 3389–3402. 10.1093/nar/25.17.3389 - DOI - PMC - PubMed
    1. Angly F., Rodriguez-Brito B., Bangor D., McNairnie P., Breitbart M., Salamon P., et al. . (2005). PHACCS, an online tool for estimating the structure and diversity of uncultured viral communities using metagenomic information. BMC Bioinformatics 6:41. 10.1186/1471-2105-6-41 - DOI - PMC - PubMed
    1. Angly F. E., Felts B., Breitbart M., Salamon P., Edwards R. A., Carlson C., et al. . (2006). The marine viromes of four oceanic regions. PLoS Biol. 4:e368. 10.1371/journal.pbio.0040368 - DOI - PMC - PubMed
    1. Angly F. E., Willner D., Prieto-Davo A., Edwards R. A., Schmieder R., Vega-Thurber R., et al. . (2009). The GAAS metagenomic tool and its estimations of viral and microbial average genome size in four major biomes. PLoS Comput. Biol. 5:e1000593. 10.1371/journal.pcbi.1000593 - DOI - PMC - PubMed

LinkOut - more resources