. 2015:4:26.
doi: 10.12715/har.2015.4.26.

Quantitative measures of healthy aging and biological age

Affiliations

Quantitative measures of healthy aging and biological age

Sangkyu Kim et al. Healthy Aging Res. 2015.

Abstract

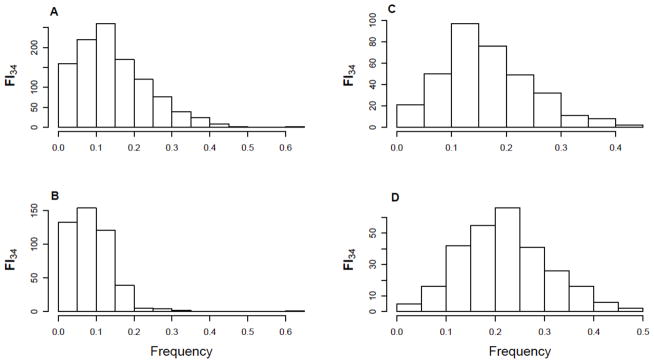
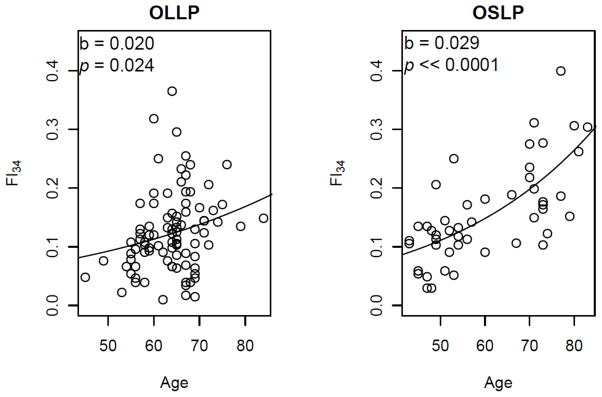
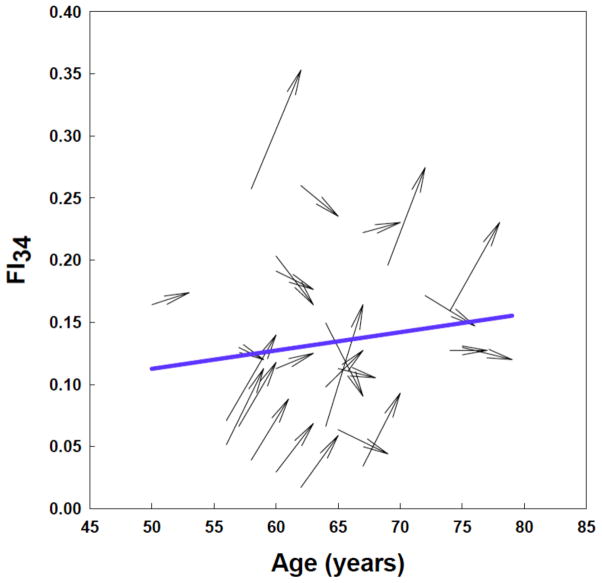
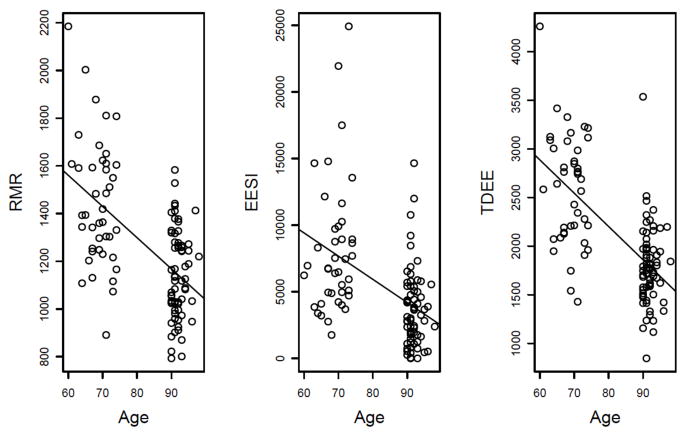
Numerous genetic and non-genetic factors contribute to aging. To facilitate the study of these factors, various descriptors of biological aging, including 'successful aging' and 'frailty', have been put forth as integrative functional measures of aging. A separate but related quantitative approach is the 'frailty index', which has been operationalized and frequently used. Various frailty indices have been constructed. Although based on different numbers and types of health variables, frailty indices possess several common properties that make them useful across different studies. We have been using a frailty index termed FI34 based on 34 health variables. Like other frailty indices, FI34 increases non-linearly with advancing age and is a better indicator of biological aging than chronological age. FI34 has a substantial genetic basis. Using FI34, we found elevated levels of resting metabolic rate linked to declining health in nonagenarians. Using FI34 as a quantitative phenotype, we have also found a genomic region on chromosome 12 that is associated with healthy aging and longevity.


Conflict of interest statement

Competing interests: The authors have declared that no competing interests exist.

Figures

Figure 1
Figure 1
Distribution of FI34 scores of individuals in the Louisiana Healthy Aging Study (LHAS) and the Healthy Aging Family Study (HAFS). The FI34 scores were compiled for subjects in LHAS [76] and HAFS [35], according to the methods described [35]. Shown are all the age groups (A), 459 young individuals (20–60 years old) (B); 348 middle-aged (60–90 years old) (C), and 382 old (90–104 years old) (D).
Figure 2
Figure 2
Scatter plots of FI34 scores by age in the “offspring of long-lived parents” (OLLP) of the Healthy Aging Family Study and the “offspring of short-lived parents” (OSLP) of the Louisiana Healthy Aging Study. Using the FI34 as a dependent variable and age as an independent variable, the exponential function a•e(b•age) was fitted to estimate the parameters a and b. The value of a=0.034 for OLLP and 0.026 for OSLP. Shown are the estimated b values with corresponding p values under the null hypothesis that slope =0. Reproduced with permission from [35] with modifications.
Figure 3
Figure 3
Age trajectories of FI34 scores of individuals in the Healthy Aging Family Study [35]. FI34 scores can decline individually as noted previously [38], but the population or group statistic of FI34 increases over time. The plots (arrows) are from two data sets collected over a three- to four-year interval from 25 HAFS participants who were 50 to 75 years old at the time of collection of the initial data set. The blue line is the average FI34 for this group of subjects.
Figure 4
Figure 4
Energy expenditure components are inversely correlated with age in the Louisiana Healthy Aging Study. Energy expenditure associated with physical activity is represented by the energy expenditure summary index (EESI) in the Yale Physical Activity survey. The plots were generated using data from 109 study participants aged 80–98. RMR, resting metabolic rate; TDEE, total daily energy expenditure.
Figure 5
Figure 5
Age-dependent variation of FI34 and RMR. The “resid.FI34” on the y axis represents residuals (the differences between the observed FI34 scores and the predicted FI34 scores) from a linear regression of FI34 on age with adjustments for sex, fat mass and fat-free mass. Likewise, “resid.RMR” on the x axis represents residuals (the differences between the observed RMR scores and the predicted RMR scores) from a linear regression of RMR on age with adjustments for sex, fat mass and fat-free mass. A, 28 subjects aged 22–34 (“young”); B, 42 subjects aged 60–74 (“middle”); C, 67 nonagenarians. FI34 (y axis) becomes more variable (spread) in older age groups (p=5.8·10−7 for “young” vs. “middle”; p=0.019 for “middle” vs. nonagenarian; p=7.2·10−11 for “young” vs. nonagenarian, according to an F test to compare the variances). On the other hand, RMR (x axis) does not exhibit much change over the three age groups (p ≫ 0.05). Note that the red dotted line in each plot represents the correlation between resid.FI34 and resid.RMR. This “residual” correlation is significant only in the oldest-old group as indicated.

Similar articles

Cited by

References

    1. Jones OR, Scheuerlein A, Salguero-Gomez R, Camarda CG, Schaible R, Casper BB, et al. Diversity of ageing across the tree of life. Nature. 2014;505(7482):169–73. - PMC - PubMed
    1. Yashin AI, Jazwinski SM, editors. Aging and Health - A Systems Biology Perspective. Basel: Karger; 2015. - PubMed
    1. Evert J, Lawler E, Bogan H, Perls T. Morbidity profiles of centenarians: survivors, delayers, and escapers. J Gerontol A Biol Sci Med Sci. 2003;58(3):232–7. - PubMed
    1. Beekman M, Nederstigt C, Suchiman HE, Kremer D, van der Breggen R, Lakenberg N, et al. Genome-wide association study (GWAS)-identified disease risk alleles do not compromise human longevity. PNAS. 2010;107(42):18046–9. - PMC - PubMed
    1. Sebastiani P, Sun FX, Andersen SL, Lee JH, Wojczynski MK, Sanders JL, et al. Families Enriched for Exceptional Longevity also have Increased Health-Span: Findings from the Long Life Family Study. Frontiers in public health. 2013;1:38. - PMC - PubMed

LinkOut - more resources