

Dynamic control and quantification of bacterial population dynamics in droplets
- PMID: 26005763
- PMCID: PMC4527312
- DOI: 10.1016/j.biomaterials.2015.05.038
Dynamic control and quantification of bacterial population dynamics in droplets
Abstract
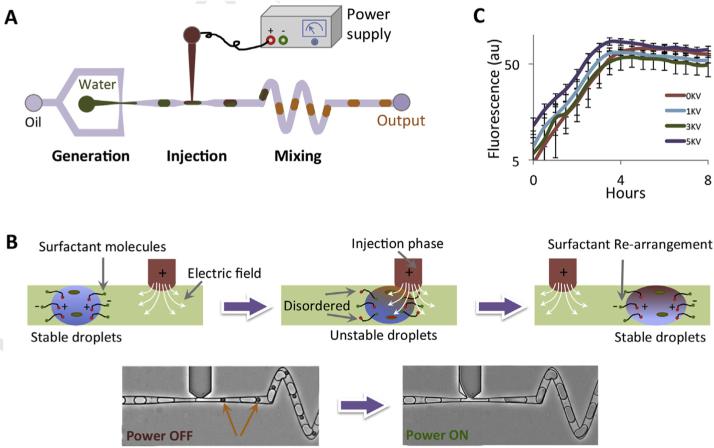
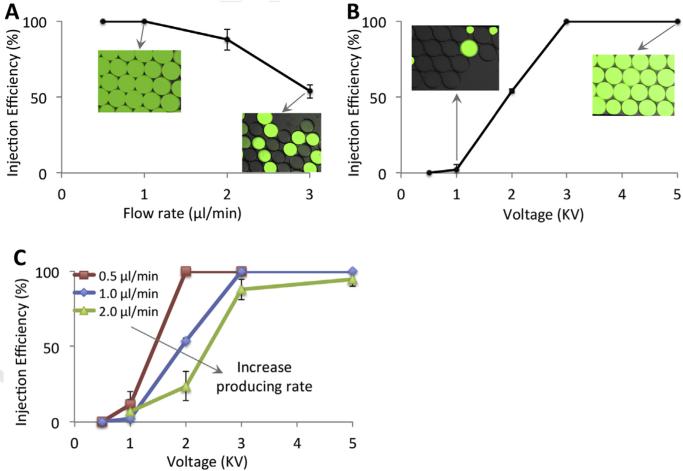
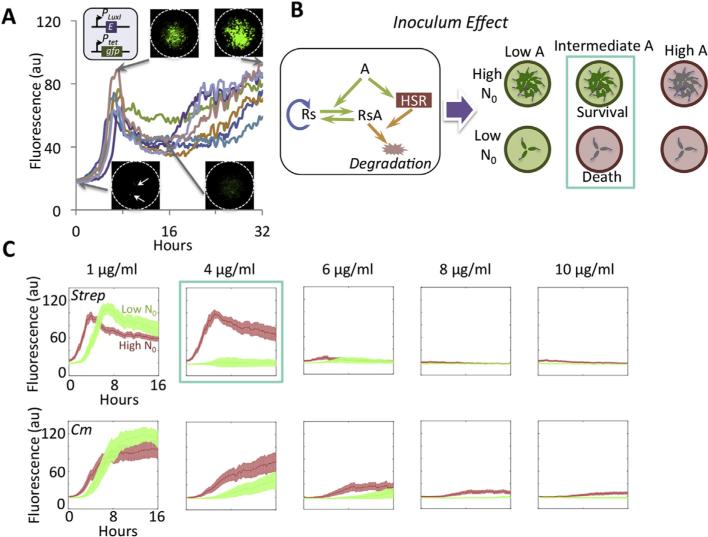
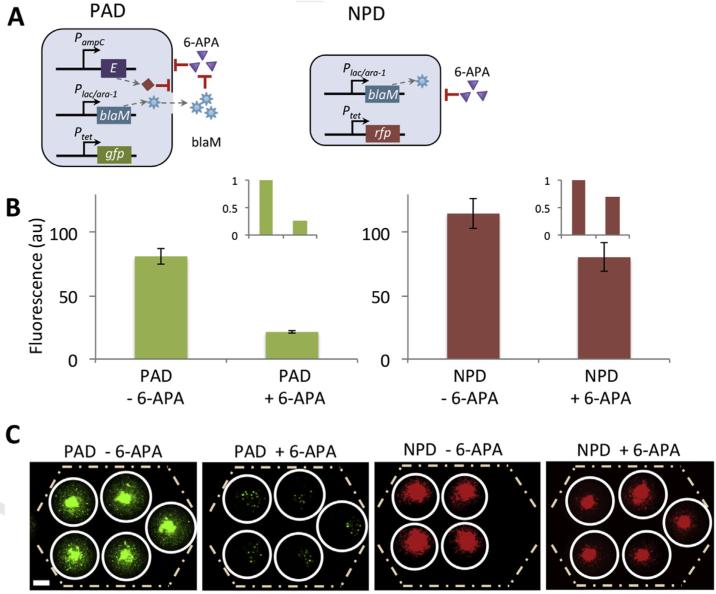
Culturing and measuring bacterial population dynamics are critical to develop insights into gene regulation or bacterial physiology. Traditional methods, based on bulk culture to obtain such quantification, have the limitations of higher cost/volume of reagents, non-amendable to small size of population and more laborious manipulation. To this end, droplet-based microfluidics represents a promising alternative that is cost-effective and high-throughput. However, difficulties in manipulating the droplet environment and monitoring encapsulated bacterial population for long-term experiments limit its utilization. To overcome these limitations, we used an electrode-free injection technology to modulate the chemical environment in droplets. This ability is critical for precise control of bacterial dynamics in droplets. Moreover, we developed a trapping device for long-term monitoring of population dynamics in individual droplets for at least 240 h. We demonstrated the utility of this new microfluidic system by quantifying population dynamics of natural and engineered bacteria. Our approach can further improve the analysis for systems and synthetic biology in terms of manipulability and high temporal resolution.
Keywords: Bacterial population dynamics; Droplet injection; Dynamic droplet manipulation; Microfluidics.
Copyright © 2015 Elsevier Ltd. All rights reserved.
Figures
Similar articles
-
Integrated microfluidic system capable of size-specific droplet generation with size-dependent droplet separation.J Biomed Nanotechnol. 2013 Jun;9(6):944-8. doi: 10.1166/jbn.2013.1523. J Biomed Nanotechnol. 2013. PMID: 23858958
-
Splitting a droplet for femtoliter liquid patterns and single cell isolation.ACS Appl Mater Interfaces. 2015 May 6;7(17):9060-5. doi: 10.1021/am509177s. Epub 2015 Mar 29. ACS Appl Mater Interfaces. 2015. PMID: 25761507
-
A portable low-cost long-term live-cell imaging platform for biomedical research and education.Biosens Bioelectron. 2015 Feb 15;64:639-49. doi: 10.1016/j.bios.2014.09.061. Epub 2014 Sep 28. Biosens Bioelectron. 2015. PMID: 25441413
-
Microfluidic assay-based optical measurement techniques for cell analysis: A review of recent progress.Biosens Bioelectron. 2016 Mar 15;77:227-36. doi: 10.1016/j.bios.2015.07.068. Epub 2015 Jul 30. Biosens Bioelectron. 2016. PMID: 26409023 Review.
-
Droplet microfluidics based microseparation systems.J Sep Sci. 2012 Jun;35(10-11):1284-93. doi: 10.1002/jssc.201200115. J Sep Sci. 2012. PMID: 22733508 Review.
Cited by
-
Droplet Microfluidics for Microbial Biotechnology.Adv Biochem Eng Biotechnol. 2022;179:129-157. doi: 10.1007/10_2020_140. Adv Biochem Eng Biotechnol. 2022. PMID: 32888037
-
Passive microinjection within high-throughput microfluidics for controlled actuation of droplets and cells.Sci Rep. 2019 Apr 30;9(1):6723. doi: 10.1038/s41598-019-43056-2. Sci Rep. 2019. PMID: 31040307 Free PMC article.
-
Tracking the stochastic growth of bacterial populations in microfluidic droplets.Phys Biol. 2022 Feb 17;19(2):026003. doi: 10.1088/1478-3975/ac4c9b. Phys Biol. 2022. PMID: 35042205 Free PMC article.
-
Interindividual Variation in Dietary Carbohydrate Metabolism by Gut Bacteria Revealed with Droplet Microfluidic Culture.mSystems. 2020 Jun 30;5(3):e00864-19. doi: 10.1128/mSystems.00864-19. mSystems. 2020. PMID: 32606031 Free PMC article.
-
Droplet-based methodology for investigating bacterial population dynamics in response to phage exposure.Front Microbiol. 2023 Nov 21;14:1260196. doi: 10.3389/fmicb.2023.1260196. eCollection 2023. Front Microbiol. 2023. PMID: 38075890 Free PMC article.
References
-
- Balagadde FK, You L, Hansen CL, Arnold FH, Quake SR. Long-term monitoring of bacteria undergoing programmed population control in a micro-chemostat. Science. 2005;309:137–140. - PubMed
-
- Thomas CM, Nielsen KM. Mechanisms of, and barriers to, horizontal gene transfer between bacteria. Nat. Rev. Microbiol. 2005;3:711–721. - PubMed
Publication types
MeSH terms
Grants and funding
LinkOut - more resources
Full Text Sources
Other Literature Sources
