. 2015 Jul;12(7):671-8.
doi: 10.1038/nmeth.3415. Epub 2015 May 25.

Functional cortical neurons and astrocytes from human pluripotent stem cells in 3D culture

Affiliations

Functional cortical neurons and astrocytes from human pluripotent stem cells in 3D culture

Anca M Paşca et al. Nat Methods. 2015 Jul.

Abstract

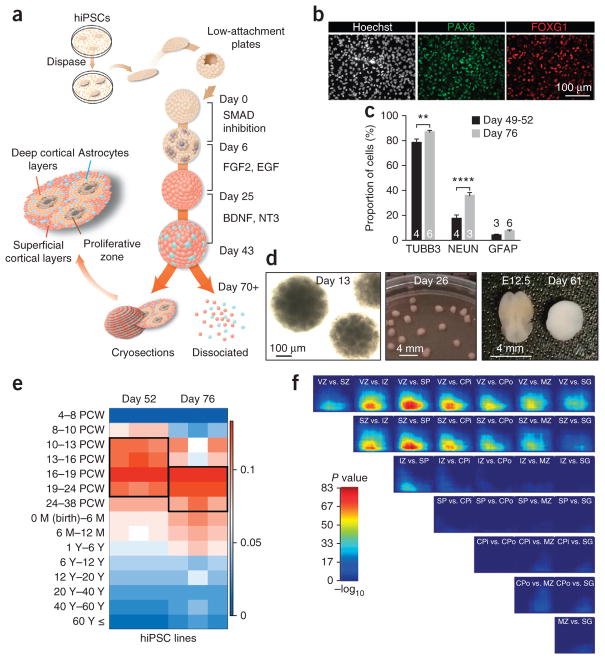
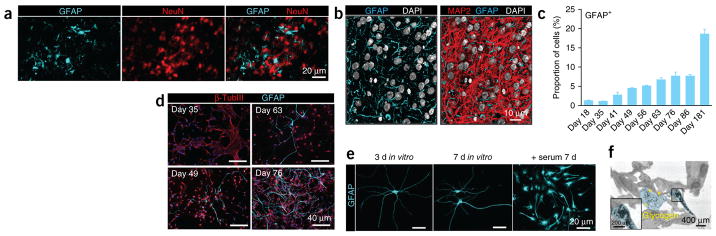
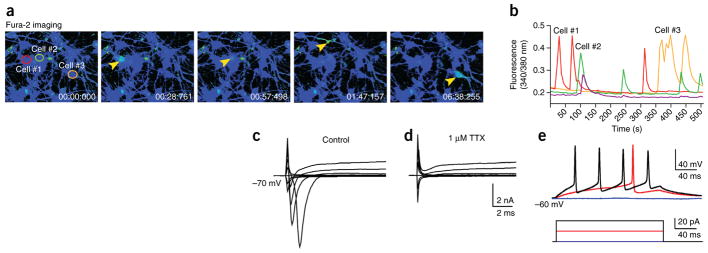
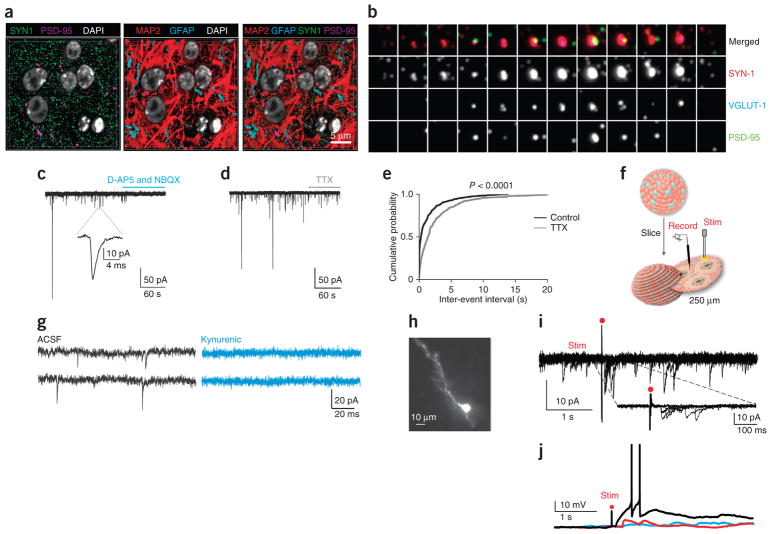
The human cerebral cortex develops through an elaborate succession of cellular events that, when disrupted, can lead to neuropsychiatric disease. The ability to reprogram somatic cells into pluripotent cells that can be differentiated in vitro provides a unique opportunity to study normal and abnormal corticogenesis. Here, we present a simple and reproducible 3D culture approach for generating a laminated cerebral cortex-like structure, named human cortical spheroids (hCSs), from pluripotent stem cells. hCSs contain neurons from both deep and superficial cortical layers and map transcriptionally to in vivo fetal development. These neurons are electrophysiologically mature, display spontaneous activity, are surrounded by nonreactive astrocytes and form functional synapses. Experiments in acute hCS slices demonstrate that cortical neurons participate in network activity and produce complex synaptic events. These 3D cultures should allow a detailed interrogation of human cortical development, function and disease, and may prove a versatile platform for generating other neuronal and glial subtypes in vitro.


Conflict of interest statement

COMPETING FINANCIAL INTERESTS

The authors declare no competing financial interests.

Figures

Figure 1
Figure 1
Generation and characterization of human cortical spheroids (hCS) from hiPSCs. (a) Scheme illustrating the main stages of the method for generating hCSs from hiPSCs. Floating hCSs can either be dissociated for flow cytometry or monolayer culture or be fixed and sectioned for immunofluorescence experiments. (b) Immunostaining for PAX6 and FOXG1 in dissociated neural cultures at day 18 in vitro. (c) Proportions of β3-tubulin (TUBB3)-, NEUN- and GFAP-expressing cells at days 49–52 and day 76 in vitro. Quantification performed in dissociated cells for TUBB3 and GFAP and in cryosections for NEUN (mean ± s.e.m.; n = 3–6 hCSs (numbers are listed within each bar); two-way ANOVA, F1,20 = 47.67, P < 0.0001 for time point (day 49–52 versus day 76), Bonferroni multiple-comparison tests: **P < 0.01, ****P < 0.0001). (d) Morphology and size of hCSs at days 13, 26 and 61 in vitro. For size comparison at day 61, a dissected E12.5 mouse brain is shown. (e) Transcriptional analyses and mapping onto the developing and adult human brain (age 4 PCW to >60 years) of hCSs at days 52 and 76 using the machine-learning algorithm CoNTExT (n = 3 hiPSC lines per time point from three subjects). (f) Rank-rank hypergeometric overlap (RRHO) between hCSs at days 52 and 76 (n = 3 hiPSC lines) and laminae in the developing human cortex. VZ, ventricular zone; SZ, subventricular zone; IZ, intermediate zone; SP, subplate; CPi, inner cortical plate; CPo, outer cortical plate; MZ, marginal zone; SG, subpial granular layer.
Figure 2
Figure 2
Corticogenesis in the hCS. (a) Cryosection of a hCS at day 52 stained for PAX6 (progenitors) and NEUN (neurons), demonstrating the presence of a VZ-like region organized around a lumen. (b) Intermediate progenitor cells (TBR2+) are present in a SVZ-like region beyond the VZ; Ncad stains the luminal side of the progenitors. (cf) Radial glial cells expressing combinations of GFAP, PAX6 or TBR2 and pVIM are present in proliferative zones, extend processes perpendicular to the lumen (L) and, when plated in monolayer, have either one or two processes. White arrowheads indicate the cell body and yellow arrowheads processes. (g) Mitoses (PH3+) are spatially restricted to the luminal side of the proliferative zones. (h) Live imaging showing interkinetic nuclear migration (Lenti-GFAP::EGFP). (i) RELN+ neurons are positioned horizontally on the surface of hCSs. (j) Quantification in cryosections of the proportion of cells expressing layer-specific cortical markers at three time points of differentiation (mean ± s.e.m.; n = 3–13 hCSs (numbers are listed within each bar) from four hiPSC lines derived from four individuals; two-way ANOVA, F2,48 = 32.96, P < 0.0001 for time point (day 52 versus day 76 versus day 137); Tukey’s multiple-comparison tests: *P < 0.05, **P < 0.01, ****P < 0.0001). (k,l) Cryosections of hCSs at 137 d stained for the indicated markers, showing organization of layer-specific neurons. (m,n) Flow cytometry of dissociated hCSs at 76 d for cells expressing the indicated markers. (o,p) Cryosections of hCSs loaded with EdU for 48 h at 55 d of differentiation and analyzed 3 weeks later for TBR1+ deep-layer neurons (o) and SATB2+ superficial-layer neurons (p) (numbers below indicate days of differentiation).
Figure 3
Figure 3
Astrogenesis in cortical hCSs. (a) The micrographs show hCSs at 76 d of in vitro differentiation stained for the indicated markers. (b) Volume rendering by array tomography of the interior of a hCS (74 × 88 × 2.45 μm) revealing the commingling of MAP2 (red) staining of neuronal dendrites and GFAP (cyan) staining of glial processes. DAPI staining for nuclei is rendered in white. (c,d) Developmental time course (3 weeks to 6 months in vitro) for the generation of GFAP+ cells. Quantification performed in dissociated hCSs (mean ± s.e.m.; n = 3 for all time points except for day 63, when n = 4; ANOVA F8,19 = 66.75, P < 0.0001). (e) Astrocyte morphology after the indicated periods of in vitro culture in monolayer in defined, serum-free medium and after a 1-week exposure to serum. (f) Transmission electron micrograph of a hCS section. An astrocyte process is pseudocolored in cyan; the inset shows granules (yellow arrowheads) within a hCS.
Figure 4
Figure 4
Functional characterization of cortical neurons from hCSs. (a) Time course of live calcium imaging in neurons dissociated from a hCS and cultured in monolayer (Fura-2 imaging). Arrowheads indicate active cells. (b) Average [Ca2+]i measurements in the neurons indicated in a (cells #1–3) demonstrating spontaneous activity. (c,d) A representative trace of whole-cell voltage-clamp Na+ current and K+ currents recorded in neurons from dissociated hCSs cultured in monolayer for 2 weeks (representative of data from 28 cells from hCSs differentiated from two hiPSC clones; 20-mV steps from −70 mV). TTX (1 μM) blocks Na+ currents. (e) Representative trace of a whole-cell current-clamp recording in human neurons from dissociated hCSs cultured in monolayer for 2 weeks (n = 9 cells from hCSs differentiated from two hiPSC clones). The trace shows action potential generation (red and black upper traces) in response to 20 pA current injections (lower traces).
Figure 5
Figure 5
Synaptogenesis in hCSs. (a) The distribution of structural (MAP2, GFAP) and synaptic proteins (SYN-1, PSD-95) inside hCSs visualized with array tomography (volume: 29 × 29 × 2.45 μm). (b) ‘Synaptogram’ (70-nm sections) revealing a synapse inside a hCS. Twelve consecutive sections are represented in each row, and different antibody stains for the same section are represented in each column. (c,d) Representative traces of spontaneous EPSCs recorded at −70 mV in neurons derived in hCSs and cultured in monolayer for 2 weeks, testing the effect of 25 μM NBQX and 50 μM D-AP5 (c) or of TTX (d). (Quantification in Supplementary Fig. 7). (e) Cumulative distribution of EPSC inter-event interval in the absence or presence of TTX (P < 0.0001, Kolmogorov-Smirnov test, n = 10 cells). (f) Schematic illustrating slicing of hCSs, electrophysiological recordings (Record) and stimulation (Stim). (g) Representative EPSC traces recorded before (black) and during (blue) application of kynurenic acid in an acute slice preparation. (h) Biocytin-filled neuron after recording. (i) Voltage-clamp recordings showing EPSCs after electrical stimulation in an acute hCS slice preparation. Composite of seven overlaid sweeps from a neuron. Inset shows stimulus evoked EPSCs at higher temporal resolution. The electrical stimulation artifact is designated by a red dot. Other examples and quantification shown in Supplementary Figure 8d,e. (j) Current clamp recordings of action potentials (black trace), EPSPs (red trace) and failures (blue trace) evoked by electrical stimulation (red dot) of hCS slices. Also see Supplementary Figure 8f.

Similar articles

Cited by

References

    1. Dolmetsch R, Geschwind DH. The human brain in a dish: the promise of iPSC-derived neurons. Cell. 2011;145:831–834. - PMC - PubMed
    1. Takahashi K, Yamanaka S. Induction of pluripotent stem cells from mouse embryonic and adult fibroblast cultures by defined factors. Cell. 2006;126:663–676. - PubMed
    1. Tabar V, Studer L. Pluripotent stem cells in regenerative medicine: challenges and recent progress. Nat Rev Genet. 2014;15:82–92. - PMC - PubMed
    1. Brennand KJ, Simone A, Tran N, Gage FH. Modeling psychiatric disorders at the cellular and network levels. Mol Psychiatry. 2012;17:1239–1253. - PMC - PubMed
    1. Paşca SP, Panagiotakos G, Dolmetsch RE. Generating human neurons in vitro and using them to understand neuropsychiatric disease. Annu Rev Neurosci. 2014;37:479–501. - PubMed

Publication types

Associated data