. 2015 Jul;18(7):988-96.
doi: 10.1038/nn.4024. Epub 2015 May 25.

The human epilepsy mutation GABRG2(Q390X) causes chronic subunit accumulation and neurodegeneration

Affiliations

The human epilepsy mutation GABRG2(Q390X) causes chronic subunit accumulation and neurodegeneration

Jing-Qiong Kang et al. Nat Neurosci. 2015 Jul.

Abstract

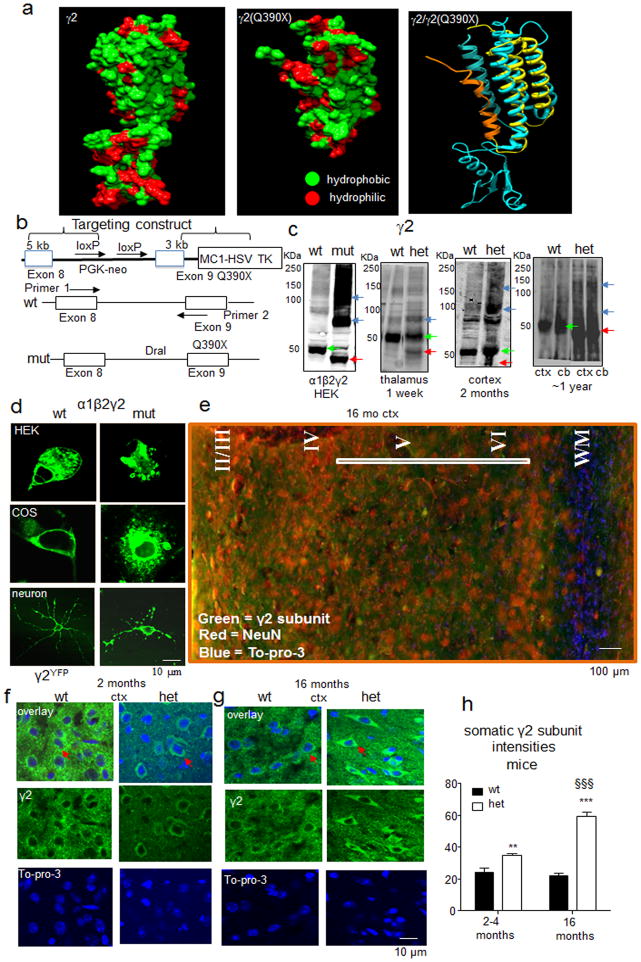
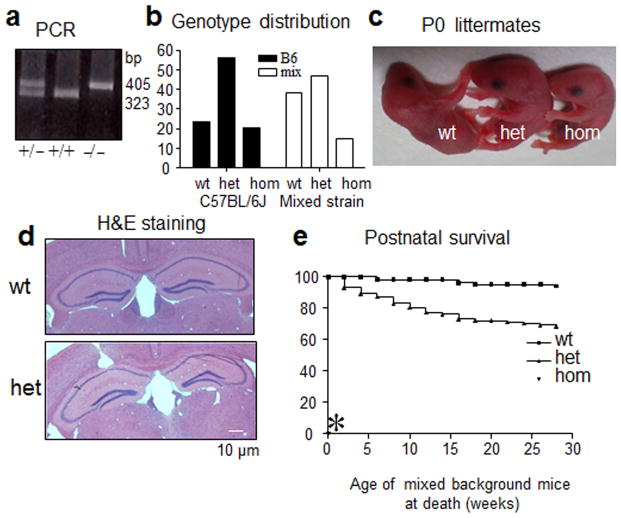
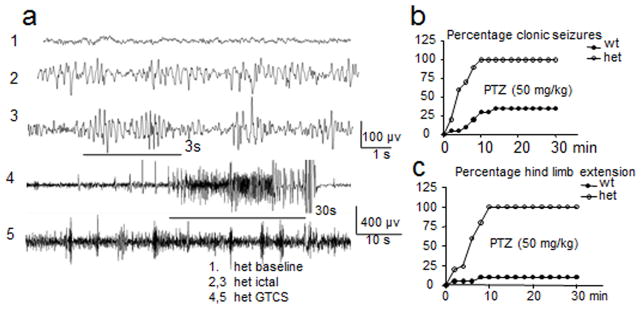
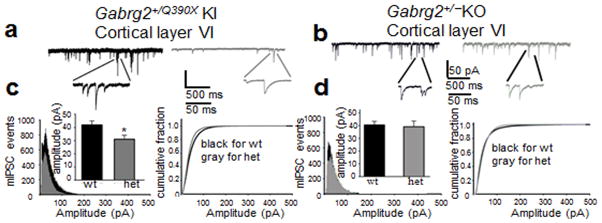
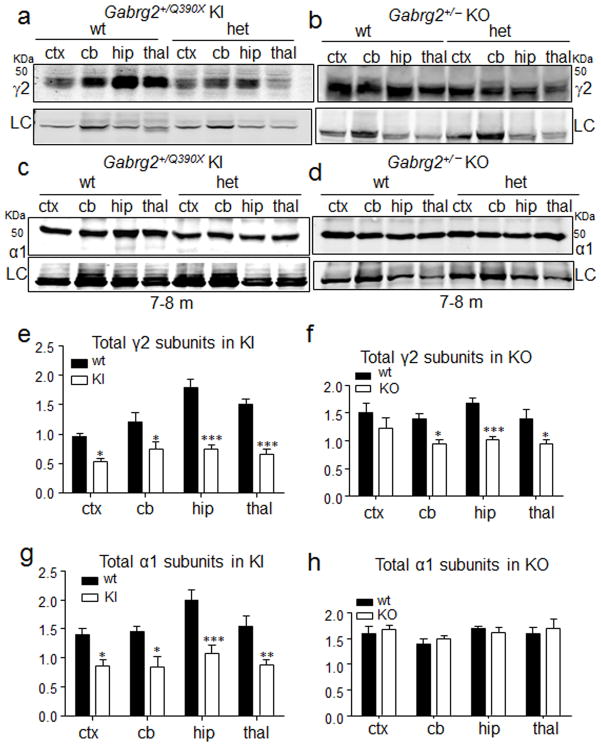
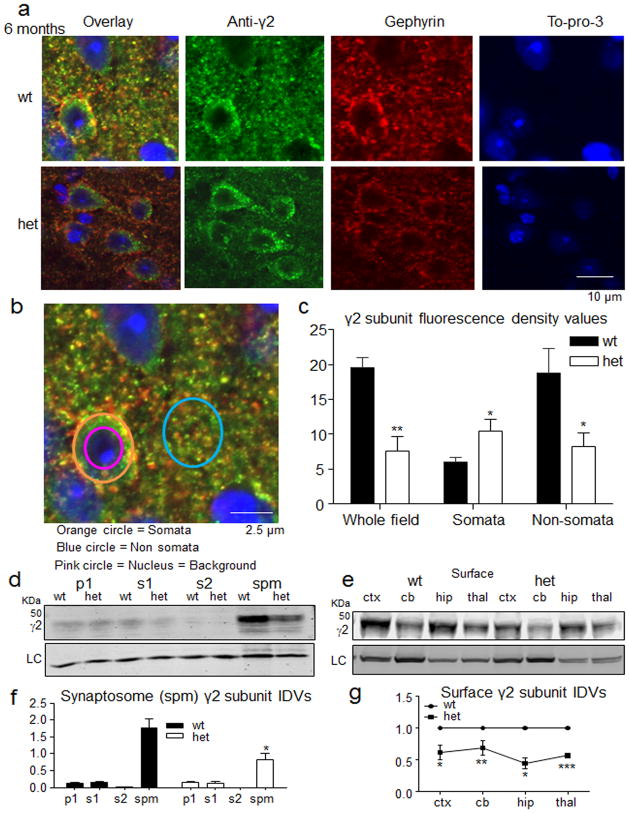
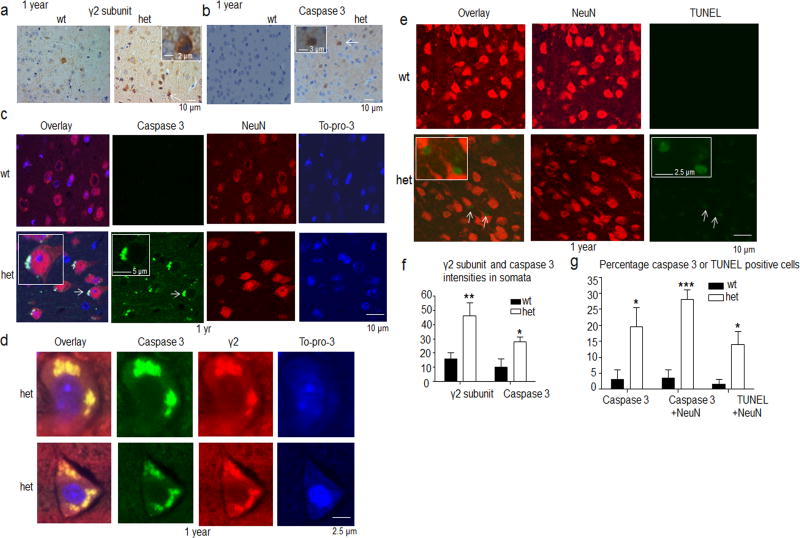
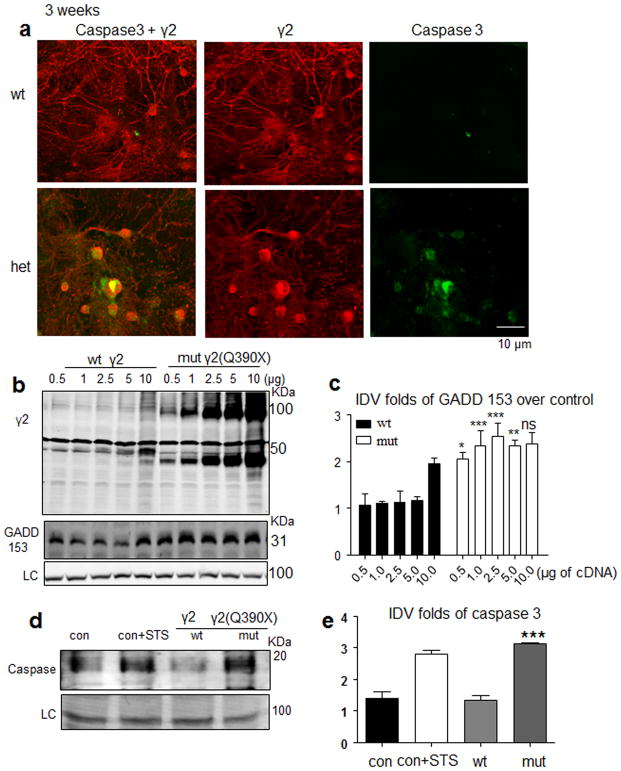
Genetic epilepsy and neurodegenerative diseases are two common neurological disorders that are conventionally viewed as being unrelated. A subset of patients with severe genetic epilepsies who have impaired development and often go on to die of their disease respond poorly to anticonvulsant drug therapy, suggesting a need for new therapeutic targets. Previously, we reported that multiple GABAA receptor epilepsy mutations result in protein misfolding and abnormal receptor trafficking. We have now developed a model of a severe human genetic epileptic encephalopathy, the Gabrg2(+/Q390X) knock-in mouse. We found that, in addition to impairing inhibitory neurotransmission, mutant GABAA receptor γ2(Q390X) subunits accumulated and aggregated intracellularly, activated caspase 3 and caused widespread, age-dependent neurodegeneration. These findings suggest that the fundamental protein metabolism and cellular consequences of the epilepsy-associated mutant γ2(Q390X) ion channel subunit are not fundamentally different from those associated with neurodegeneration. Our results have far-reaching relevance for the identification of conserved pathological cascades and mechanism-based therapies that are shared between genetic epilepsies and neurodegenerative diseases.


Figures

Figure 1
Figure 1. The GABRG2(Q390X) mutation associated with the epileptic encephalopathy Dravet syndrome caused the mutant subunit to be aggregate prone and to accumulate intracellularly
a, Predicted structural models. The left and middle panels show protein surfaces of wild-type γ2 and mutant γ2(Q390X) subunits, respectively, where green indicates hydrophobic residues and red shows hydrophilic (polar or charged) residues. The right panel shows the mutant and wild-type subunits superimposed with the same orientation as the left and middle panels (γ2 subunit in cyan/blue and γ2(Q390X) subunit in yellow/orange). The transmembrane 4 (TM4) α-helix (YARIFFPTAFCLFNLVYWVSYLYL) in the wild-type γ2 subunit and a new α-helix (KDKDKKKKNPAPTIDIRPRSATI) in the mutant γ2(Q390X) subunit are shown in highlight with edged representations. b, The Gabrg2+/Q390X KI mouse was constructed with insertion of a DraI restriction site in the mutant allele. c, Wild-type γ2 subunits or mutant γ2(Q390X) subunit monomers and oligomers were detected in lysates from HEK 293T cells coexpressing α1β2γ2 or α1β2γ2(Q390X) subunits (HEK), lysates from wild-type and KI mouse thalami (1 week), wild-type and Gabrg2+/Q390X mouse cortical membrane preparations (2 months) and immunopurified γ2 subunits from wild-type and KI mouse cortex (cxt) and cerebellum (cb) (~1 year). d, γ2(Q390X), but not γ2, subunits accumulated intracellularly in live α1β2γ2YFP (wt) or α1β2γ2(Q390X)YFP (mut) subunit-transfected HEK 293T cells (HEK) and COS-7 (COS) cells and γ2YFP or γ2YFP and γ2(Q390X)YFP subunit-transfected cultured rat cortical neurons. e. Image showing a coronal brain section of somatosensory cortex layers II–VI from a 16 month old wild-type mouse stained with anti-γ2 subunit (green) and anti-NeuN (red) antibodies and with To-pro-3 (blue). White line designates the approximate layers surveyed in g and h. f, g, Freshly prepared brain sections from 2–4 months old (f) or over 16 months old (g) wild-type and KI littermates were immunostained with anti-γ2 subunit antibody and visualized with Alexa-488 fluorophores (green) under confocal microscopy. The nuclei were stained with To-pro-3 (blue). h, Fluorescence intensities of γ2 subunits conjugated with Alexa-488 fluorophores in cortical brain sections from wild-type and heterozygous mice were quantified. (unpaired t test, p = 0.008 wt vs het for 2–4 months old, p < 0.0001 wt vs het for 16 months and 2–4 months vs 16 months (n = 5 for 5 pairs of mice; 5 independent experiments, error bars are s.e.m.) (** p < 0.01; ***p < 0.001 vs wt, §§§p < 0.001 vs 2–4 months old mice. In c, the red arrows designate the mutant γ2 subunit monomers, the green arrows designate the wild-type γ2 subunits and the blue arrows designate the mutant γ2 subunit aggregates. In f and g, the red arrows designate the somatic regions of individual cells.
Figure 2
Figure 2. Gabrg2+/Q390X KI mice had increased mortality both pre- and postnatally
a, The wild-type γ2 subunit allele PCR product was 323 bp while the mutant γ2 subunit allele product was 405 bp due to the insertion of an 82 bp fragment as shown in the PCR image for genotyping. b, The distribution of each genotype for pups in mixed C57Bl/6J/129Svj (n = 7 litters, 58 pups) and C57Bl/6J (n = 8 litters, 69 pups) backgrounds was plotted. c, Mutant P0 pups were grossly normal. d, Sections of cerebral cortex including the hippocampal formation were stained with hematoxylin and eosin. e, A survival plot was obtained that showed the percentage of surviving mice with each genotype for 30 postnatal weeks (n = 51 for wt and 47 for het). Note that homozygous KI mice did not survive beyond P0 (asterisk).
Figure 3
Figure 3. Gabrg2+/Q390X KI mice had severe seizures and behavioral comorbidities
a, Representative EEG recordings show that the heterozygous (het) KI mice had interictal periods without (het baseline) or with (het ictal) epileptiform activity and had spontaneous generalized tonic clonic seizures with epileptiform discharges (het GTCS). b, c, KI mice had lowered seizure threshold with intraperitoneal pentylenetetrazol (PTZ) administration (50 mg/kg). After PTZ injection, KI mice in the C57BL/6J background (open circles) progressed more rapidly to (b) clonic seizures and hind limb extension (c) than wild-type (wt) mice (filled circles) (n = 20 mice for wt and 23 for het).
Figure 4
Figure 4. The GABAergic mISPCSs from Gabrg2+/Q390X KI mice were not equivalent to those from Gabrg2+/ KO mice
a, b, Representative traces of GABAergic mIPSCs from cortical layer VI pyramidal neurons from two month old wild-type (wt) and heterozygous (het) KI (a) or KO (b) mice. c, d, mIPSC amplitudes were plotted as a function of frequency of occurrence and amplitude (inserts) and in cumulative histograms for both het KI (c) and KO (d) mice. (For KI mice, n = 15 cells from 11 slices from 10 mice for wt and 11 cells from 8 slices from 8 mice for het, unpaired t test, p = 0.022 wt vs het; For KO mice, n = 8 cells from 6 slices from 5 mice for wt, n = 9 cells from 7 slices from 6 het mice, p = 0.966 wt vs het). Error bars are mean +/− s.e.m.,* p < 0.01 vs wt).
Figure 5
Figure 5. Gabrg2+/Q390X KI mice were not equivalent to Gabrg2+/− KO mice with respect to the remaining wild-type GABAA receptor subunit expression
a–d, Lysates from different brain regions (cortex (cxt), cerebellum (cb), hippocampus (hip) and thal (thalamus)) from heterozygous (het) KO and KI mice were subjected to SDS-PAGE and immunoblotted with anti-γ2 subunit antibody (a, b) or anti-α1 subunit antibody (c, d). eh, Integrated density values (IDVs) for total γ2 and α1 subunits from wild-type and het KI (e, g) or wild-type and het KO (f, h) mice were normalized to the Na+/K+ ATPase or anti-glyceraldehyde-3-phosphate dehydrogenase (GAPDH) loading control (LC) in each specific brain region and plotted. (In e–h, *p < 0.05; **p < 0.01; ***p < 0.001 vs wt. n = 5 pairs of mice for KI and 5 pairs of mice for KO, error bars are s.e.m. Full-length gels are presented in Supplementary Fig. 4. See Supplementary Methods checklist for full details of statistical tests.)
Figure 6
Figure 6. Younger Gabrg2+/Q390X KI mice had increased γ2 subunit accumulation in neuronal somata, but reduced expression of γ2 subunits in synaptosomes and on the cell surface
a, The brains from 6 month old wild-type and heterozygous (het) KI littermates were blocked, short fixed with 4% paraformaldehyde for 30 min and immersed in 30% sucrose overnight. The brain tissues were sectioned by cryostat at 15 μm and stained with rabbit anti-γ2 subunit antibody (green), mouse anti-gephyrin antibody (red) and cellular nucleus marker To-pro-3 (blue). The presented images were from cortex layers V–VI. b, An enlarged image from the wt overlay was used to illustrate the quantification of the fluorescent intensity values in somatic and non-somatic regions with ImageJ. The fluorescent intensities of the whole field, somatic or non-somatic regions were measured. c, The fluorescence intensity values in the nuclei were used as background values that were subtracted in each condition. The total fluorescence intensity values from the whole field and non-somatic regions were reduced but were increased in the somata in the het mouse brains. (p = 0.0048 for whole field, p = 0.0031 for somata, p = 0.0136 for nonsomata, n = 11 mice for wt and 12 mice for het, unpaired t test. d, f, The forebrains of 2–4 months old mice were subfractionated. Equal amounts of protein from nuclei and cell debris (p1), total cytosol (s1), cytosol and light membrane (s2) and synaptosomes (spm) were analyzed by SDS-PAGE and immunoblotted with anti-γ2 subunit antibody. The protein IDVs in each fraction were normalized to their own loading control (LC) Na+/K+ ATPase or β-Tubulin (p = 0.034 wt vs het spm, n = 4 pairs of mice, 4 independent experiments, unpaired t test). e, g, The surface proteins from the live mouse brain slices were biotinylated and analyzed by SDS-PAGE and immunoblotted with anti-γ2 subunit antibody (p = 0.011 for cor, p = 0.0088 for cb, p = 0.0154 for hip, p = 0.0007 for thal, n = 4 pairs of mice. One sample t test). (In c, f–g, *p < 0.05; **p < 0.01, *** vs wt. Error bars are s.e.m., See Supplementary Methods Checklist for full details of statistical tests. Full-length gels for d and e are presented in Supplementary Fig. 4.)
Figure 7
Figure 7. Older Gabrg2+/Q390X KI mice had caspase 3 activation and neuronal death in the deep layers of cerebral cortex
a, b, Brain sections from 1 year old wild-type (wt) and heterozygous (het) KI mice were stained with (a) rabbit anti-γ2 subunit antibody or (b) rabbit cleaved caspase 3. c–e, Similar sections were stained for cleaved caspase 3 (green) in combination with (c) mouse monoclonal neuronal marker NeuN (red) and cellular nuclei marker To-pro-3 (blue), (d) mouse anti-γ2 subunit (red) and cellular nuclei marker To-pro-3 (blue), or (e) NeuN (red) and cell death marker TUNEL (green). f, The γ2 subunit and cleaved caspase 3 protein density values in the cell somata were quantified using image J (p = 0.005 for γ2 subunit, p = 0.0161 for caspase 3 intensity, n = 12 sections from 7 mice for wt and n =11 sections from 7 mice for het., unpaired t test). (*p < 0.05; **p < 0.01 vs wt, n = 12 for wt and11 for het). g, The cleaved caspase 3 positive staining cells in the total cellular population, the cleaved caspase 3 positive staining in NeuN positive cells and the TUNEL positive cells in the NeuN expressing populations were quantified and plotted (p = 0.0301 for caspase 3, p < 0.0001 for caspase 3 + NeuN, P<0.0001 for TUNEL. n = 7 pairs of mice, unpaired t test. (In f–g,*p < 0.05; **p < 0.01 vs wt, ***p < 0.001 vs wt Error bars are s.e.m. See Supplementary Methods Checklist for full details of statistical tests.).
Figure 8
Figure 8. Increased ER stress and caspase 3 activation were detected in cells expressing mutant γ2(Q390X) subunits
a, Hippocampal neurons from P0 wild-type and heterozygous (het) KI mice were grown in cell culture for three weeks, and neurons were stained with rabbit polyclonal anti-cleaved caspase 3 (green) and mouse monoclonal anti-γ2 subunit (red) antibodies (a). c, d, Lysates from HEK 293T cells expressing γ2 or γ2(Q390X) subunits with progressively increased cDNA concentrations were immunoblotted with either anti-γ2 subunit or the ER stress hallmark anti-GADD153 antibody with an Na+/K+ ATPase loading control (LC) (c), and the normalized GADD153 IDVs were plotted (*p < 0.05; **p < 0.01, ***p < 0.001 vs wt of the same cDNA amount, n = 4 different transfections. See Supplementary Methods Checklist for full details of statistical tests.) (d). e, f, HEK 293T cells were either untransfected (con) or transfected with γ2 (wt) or γ2(Q390X) (mut) subunits. The apoptosis inducer staurosporine (3 μM) was applied for 4 hrs as positive control (con + STS). The cells were harvested 2 days after transfection and analyzed by SDS-PAGE and immunoblotted by the anti-cleaved caspase 3 (e). The IDVs for each condition were normalized to the loading control Na+/K+ ATPase or β-tubulin and plotted (***p < 0.001 vs wt, n = 4 different transfections (f). (Error bars are s.e.m.. See Supplementary Methods Checklist for full details of statistical tests. Full-length gel for e is presented in Supplementary Fig. 4.)

Similar articles

Cited by

References

    1. Noebels JL. Exploring new gene discoveries in idiopathic generalized epilepsy. Epilepsia. 2003;44(Suppl 2):16–21. - PubMed
    1. Heron SE, et al. De novo SCN1A mutations in Dravet syndrome and related epileptic encephalopathies are largely of paternal origin. J Med Genet. 2010;47:137–141. - PubMed
    1. Shi X, et al. Missense mutation of the sodium channel gene SCN2A causes Dravet syndrome. Brain Dev. 2009;31:758–762. - PubMed
    1. Patino GA, et al. A functional null mutation of SCN1B in a patient with Dravet syndrome. J Neurosci. 2009;29:10764–10778. - PMC - PubMed
    1. Ogiwara I, et al. A homozygous mutation of voltage-gated sodium channel beta(I) gene SCN1B in a patient with Dravet syndrome. Epilepsia. 2012;53:e200–e203. - PubMed

Publication types

MeSH terms