. 2015 Jul;18(7):1008-16.
doi: 10.1038/nn.4023. Epub 2015 May 25.

The schizophrenia risk gene product miR-137 alters presynaptic plasticity

Affiliations

The schizophrenia risk gene product miR-137 alters presynaptic plasticity

Sandra Siegert et al. Nat Neurosci. 2015 Jul.

Erratum in

Abstract

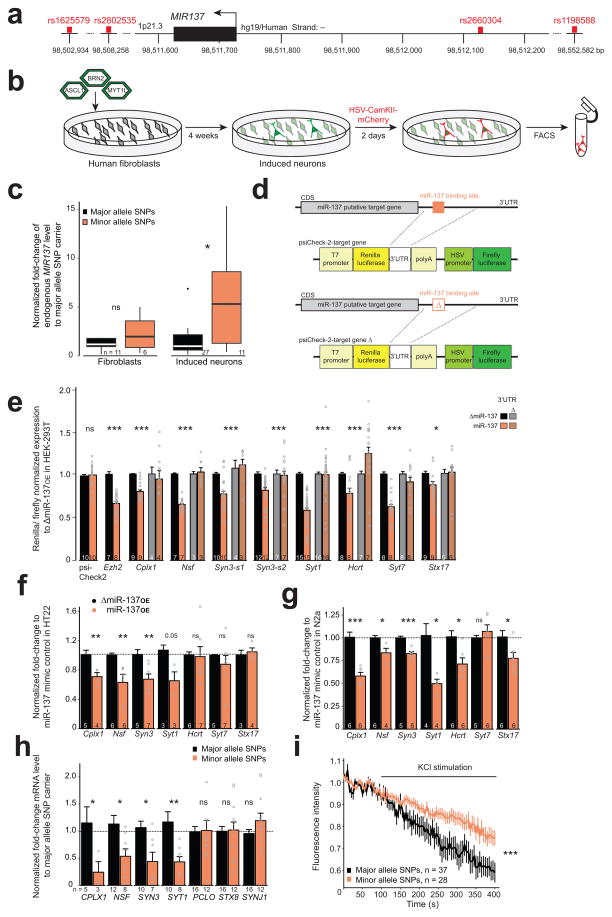
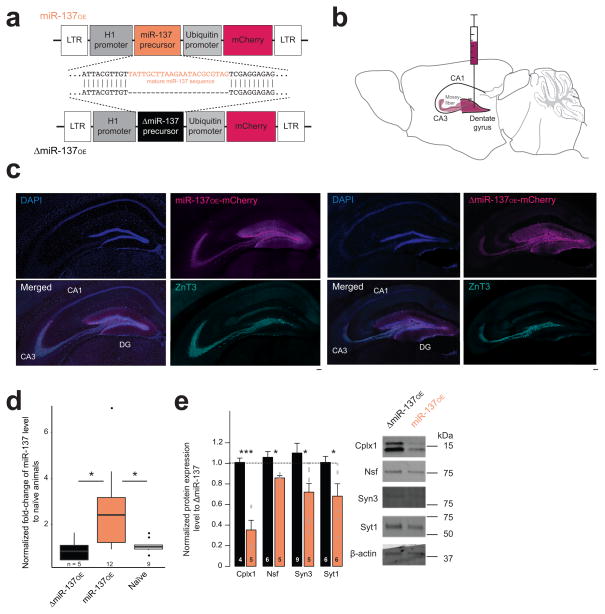
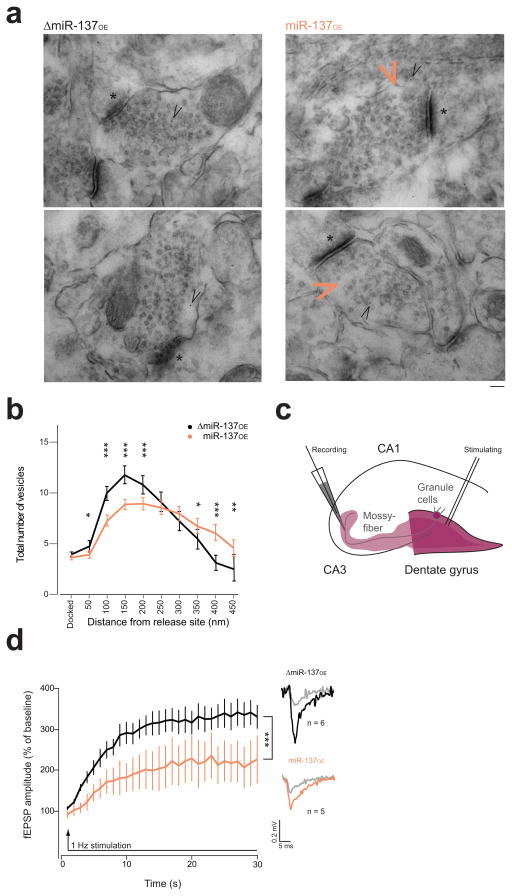
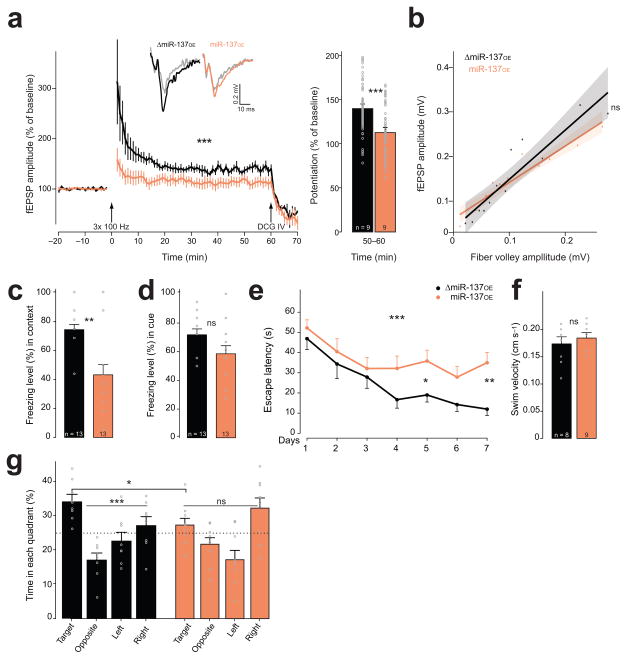
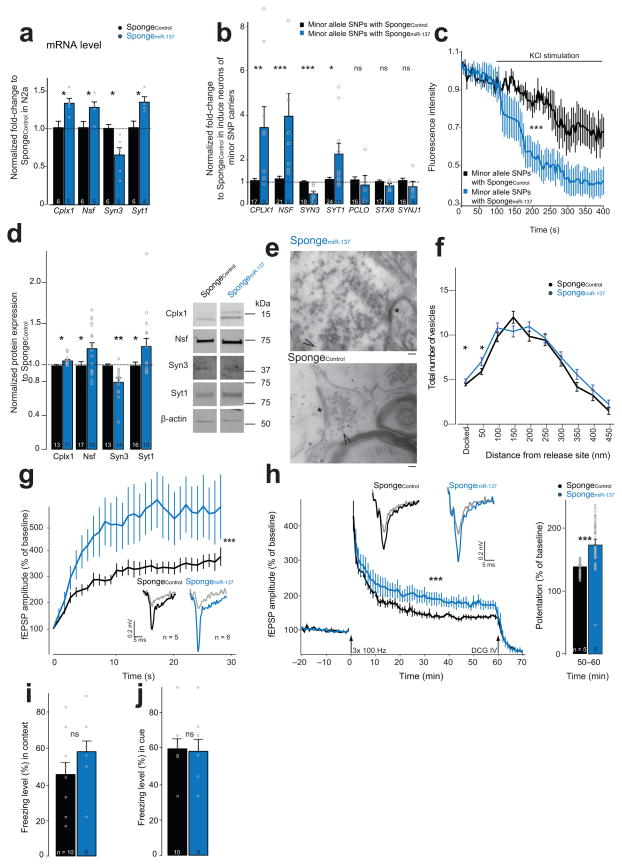
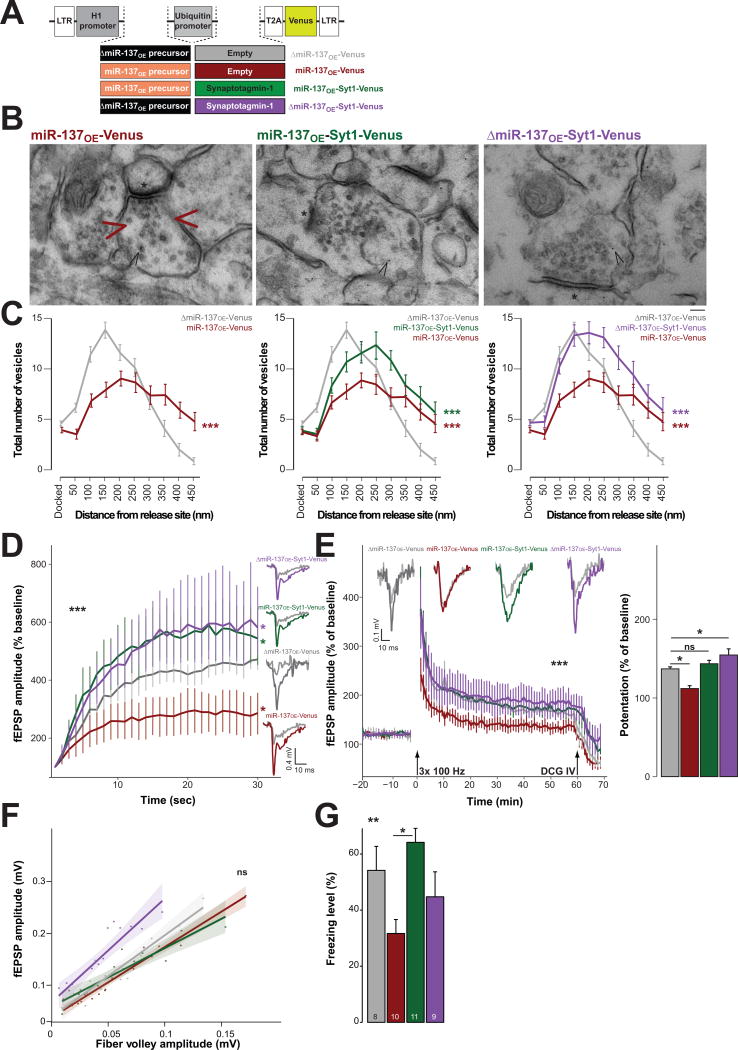
Noncoding variants in the human MIR137 gene locus increase schizophrenia risk with genome-wide significance. However, the functional consequence of these risk alleles is unknown. Here we examined induced human neurons harboring the minor alleles of four disease-associated single nucleotide polymorphisms in MIR137. We observed increased MIR137 levels compared to those in major allele-carrying cells. microRNA-137 gain of function caused downregulation of the presynaptic target genes complexin-1 (Cplx1), Nsf and synaptotagmin-1 (Syt1), leading to impaired vesicle release. In vivo, miR-137 gain of function resulted in changes in synaptic vesicle pool distribution, impaired induction of mossy fiber long-term potentiation and deficits in hippocampus-dependent learning and memory. By sequestering endogenous miR-137, we were able to ameliorate the synaptic phenotypes. Moreover, reinstatement of Syt1 expression partially restored synaptic plasticity, demonstrating the importance of Syt1 as a miR-137 target. Our data provide new insight into the mechanism by which miR-137 dysregulation can impair synaptic plasticity in the hippocampus.


Figures

Figure 1
Figure 1. MIR137 gain of function affects presynaptic targets
(a) Location of the four disease-associated SNPs (red) in the human genome. Black bar: MIR137 coding region (Chr1:98,511,626–727, UCSC genome browser, GRCh37/hg19). (b) Schematic overview for direct induction of human fibroblasts to neurons. Fluorescence-activated cell sorting (FACS). (c) Fold-change differences of MIR137 determined by qRT-PCR. WFibroblasts = 19, nsP = 0.1802, r = −0.33, WInducedNeurons = 65, *P = 0.0157, r = −0.40; box plot shows, in ascending order, the lowest maximum value, the first quartile, median, third quartile and the highest maximum value, with dots representing outliers; n, analyzed samples obtained from three reprogramming from each fibroblast line. (d–g) Confirmation of in silico predicted miR-137 presynaptic target genes. (d) Schematic overview of the luciferase assay. CDS, coding DNA sequence. (e) Luciferase activity normalized to ΔmiR-137OE. Light gray and dark orange, deleted miR-137-binding site. Syn3 has two predicted miR-137-binding sites, s1 and s2. tpsiCheck2(53.51) = 0.40, nsP = 0.6932, r = 0.06; tEzh2(40.7) = −8.94, ***P < 0.001, r = 0.81; FCplx1(3,74) = 6.73, ***P < 0.001; FNsf(3,54) = 97.32, ***P < 0.001; FSyn3-s1(3,75) = 16.67, ***P < 0.001; FSyn3-s2(3,108) = 8.47, ***P < 0.001; FSyt1(3,181) = 67.12, ***P < 0.001, FHcrt(3,85) = 14.12, ***P < 0.001, FSyt7(3,74) = 37.38, ***P < 0.001, FStx17(3,80) = 3.44, *P = 0.0207, post hoc pairwise comparison of ΔmiR-137OE-miR-137OE after Benjamini and Hochberg-adusted P value for multiple comparisons: Cplx1 (P = 0.0006), Nsf (P < 0.001), Syn3-s1 (P < 0.001), Syn3-s2 (P = 0.00016), Syt1 (P < 0.001), Hcrt (P = 0.0029), Syt7 (P < 0.001), Stx17 (P = 0.043); n, number of experiments, each in triplicate. (f,g) mRNA levels of miR-137 target genes in HT22 (f) and N2a (g) cells transfected with a commercially available miR-137 mimic normalized to a mimic-control. HT22: tCplx1(6.98) = −3.58, **P = 0.0090, r = 0.81; WNsf = 0, **P = 0.0022, r = −0.89; tSyn3(9.71) = −3.40, **P = 0.007, r = 0.74; tSyt1(3.21) = −2.99, nsP = 0.0535, r = 0.86; WHcrt = 15, nsP = 0.4452, r = −0.21; tSyt7(6.06) = −1.02, nsP = 0.3481, r = 0.38; tStx17(4.31) = 0.51, nsP = 0.6337, r = 0.24; N2a: tCplx1(9.10) = −6.18, ***P < 0.001, r = 0.90; tNsf(4.43) = −3.01, *P = 0.3453, r = 0.82; tSyn3(8.99) = −6.23, ***P < 0.001, r = 0.90; WSyt1 = 0, *P = 0.0286, r = −0.77, tHcrt(10) = −3.15, *P = 0.0103, r = −0.71; tSyt7(6.27) = 0.91, nsP = 0.3962, r = 0.34 tStx17(9.96) = −2.47, *P = 0.033, r = 0.62; n, number of experiments. (h) mRNA levels in induced neurons by qRT-PCR. tCPLX1 (5.97) = 2.56, *P = 0.043, r = 0.72; tNSF (17.89) = 2.85, *P = 0.0107, r = 0.56; tSYN3 (11.29) = 3.00, *P = 0.0118, r = 0.67; tSYT1 (13.40) = 3.45, **P = 0.004, r = 0.69; tPCLO (22.95) = 1.05, nsP = 0.3034, r = 0.22, tSTX8 (20.36) = −0.49, nsP = 0.7013, r = 0.22, tSYNJ1 (18.94) = −1.21, nsP = 0.2398, r = 0.27; n, number of samples from at least three reprogrammings of each fibroblast line. (i) FM4-64 imaging analysis, H(1) = 38.15, ***P < 0.001; n, number of analyzed cells, usually one cell per coverslip from two reprogramming from each fibroblast line. ns, not significant. Error bars, s.e.m, W, Wilcoxon-rank sum and signed rank tests, r, effect size, H, Kruskal-Wallis rank sum test.
Figure 2
Figure 2. Recapitulation of miR-137 gain of function by overexpressing miR-137 in the mouse dentate gyrus
(a) Schematic overview of the lentivirus delivery constructs, expressing the miR-137 precursor under the RPPH1 promoter (miR-137OE). ΔmiR-137OE lacks mature miR-137 region. LTR, long terminal repeat. (b) Schematic overview of stereotactic virus injection into the murine dorsal dentate gyrus. (c) Tile-scan of hippocampi injected with either miR-137OE (left) or ΔmiR-137OE (right), labeled against mCherry (magenta), the mossy fiber marker zinc transporter 3 (ZnT3, green) and the nuclear dye DAPI (blue). DG, dentate gyrus. Representative images of at least three animals. Scale bars, 100 μm. (d) miR-137 expression in ΔmiR-137OE-, miR-137OE-injected, and naive animals, H(2) = 7.68, *P = 0.0215, post hoc pairwise comparison after Tukey (tΔmiR-137OE-miR-137OE = 2.53, *P = 0.0471, tmiR-137OE-naive = −2.72, *P = 0.0312, tΔmiR-137OE-naive = 0.261, nsP = 0.796), box plot shows, in ascending order, the lowest maximum value, the first quartile, median, third quartile and the highest maximum value, with dots representing outliers; n, number of dissected dorsal DG regions from at least three animals. (e) Quantified protein levels of miR-137 target genes in mossy fiber-CA3 pathway for ΔmiR-137OE and miR-137OE, tCplx1(5.43) = −6.46, ***P < 0.01, r = 0.94; tNsf(6.47) = −3.43, *P = 0.0123, r = 0.80; tSyn3(9.89) = −3.00, *P = 0.0135, r = 0.69; tSyt1(7.21) = −2.47, *P = 0.0418, r = 0.68; n, dorsal DG-CA3 region of at least three animals. Right, cropped western blot images. Full-length blots are presented in Supplementary Figure 9. ns, not significant. Error bars, s.e.m.
Figure 3
Figure 3. Morphological and functional alterations are evident at the mossy fiber synapse of miR-137OE
(a,b) Ultrastructural analysis of the mossy fiber presynaptic terminal. (a) Representative images of virus-transduced synapse. Black arrowhead, gold-particles labeling mCherry; orange arrowhead, gap in the vesicle pool in miR-137OE synapse; *, active zone; scale bar, 100 nm. (b) Vesicle distribution for ΔmiR-137OE (black, n = 84) and miR-137OE (orange, n = 112), V = 0.26, F(11,184) = 5.81, ***P < 0.001; with post hoc analysis shown: FDocked(1,194) = 2.91, nsP = 0.0892; F50nm(1,194) = 6.83, *P = 0.0097; F100nm(1,194) = 37.7, ***P < 0.001; F150nm(1,194) = 32.5, ***P < 0.001; F200nm(1,194) = 12.4, ***P < 0.001; F250nm(1,194) = 0.87, nsP = 0.3517; F300nm(1,194) = 1.57, nsP 0.211; F350nm(1,194) = 4.00, *P = 0.0471; F400nm(1,194) = 27.3, ***P < 0.001; F450nm(1,194) = 7.46, **P = 0.0069; n, number of analyzed synapses of at least three animals. (c) Schematic overview of the electrophysiological paradigm for acute hippocampal slice recording; magenta, presumptive mCherry virus expression. (d) fEPSP amplitude for 1-Hz sustained stimulation, H(1) = 67.34, ***P < 0.001. Representative traces embedded; gray traces, response to first stimulation; n, number of analyzed hippocampal slice preparation from at least three animals. ns, not significant. Error bars, s.e.m, V, multivariate analysis of variance.
Figure 4
Figure 4. miR-137 overexpression in the dentate gyrus causes impairment in hippocampus-dependent learning
(a) LTP recording for miR-137OE and control ΔmiR-137OE, F(1,1060) = 144.6, ***P < 0.001. Arrows indicate application of either high frequency stimulation or DCG-IV. Representative fEPSP traces inset; gray traces, baseline levels before stimulation. Right bar chart, LTP magnitude calculated by averaging fEPSP amplitude of the last 10 min (50–60 min) recording; W = 7283, ***P < 0.001, r = −0.42. (b) Input-output curve from ΔmiR-137OE (black, n = 12) and miR-137OE (orange, n = 14), H(1) = 0.02, nsP = 0.8774. Shaded area, 95% confidence interval; n, number of analyzed hippocampal slice preparation from at least three animals. (c,d) Fear conditioning. Percentage freezing for contextual (c; t(17.76) = 3.87, **P = 0.0011, r = 0.68) and cue response (d; t(22) = 1.90, nsP = 0.0709, r = 0.38). (e–g) Morris water maze. (e) Escape latency, F(1,117) = 14.32, ***P < 0.001; post hoc analysis shown: WDay1 = 30, nsP = 0.5535, r = −0.14; WDay2 = 28.5, nsP = 0.495, r = −0.16; WDay3 = 29, nsP = 0.5309, r = −0.15; WDay4 = 17.5, nsP = 0.0831, r = −0.41; WDay5 = 14, *P = 0.0380, r = −0.50; WDay6 = 16.5, nsP = 0.0673, r = −0.43; WDay7 = 7, **P = 0.061, r = −0.65. (f) No difference in swim velocity, t(13.51) = −0.66, nsP = 0.5224, r = 0.18. (g) Probe trial, ΔmiR-137OE mice prefer target quadrant, F(3,28) = 10.16, ***P < 0.001. This effect was not observed for miR-137OE. A significant main effect exists for the target quadrant between ΔmiR-137OE and miR-137OE, F(7, 60) = 7.24, *P = 0.0438; n, number of animals. ns, not significant. Error bars, s.e.m.
Figure 5
Figure 5. Sequestration of endogenous miR-137 leads to phenotype reversal. SpongeControl (black), SpongemiR-137 (blue)
(a) Relative mRNA levels of miR-137 target genes in transfected N2a cells, tCplx1(8.80) = 3.02, *P = 0.0149, r = 0.71; tNsf(2.46) = 9.00, *P = 0.036, r = 0.64; tSyn3(7.70) = −3.24, *P = 0.0125, r = 0.76; tSyt1(7.96) = 3.00 *P = 0.0173, r = 0.73; n, number of experiments. (b) Relative mRNA levels in transduced induced minor allele SNP neurons, WCPLX1 = 27, **P = 0.0064, r = −0.53; WNSF = 13, ***P < 0.001, r = −0.70; WSYN3 = 117, ***P < 0.001, r = −0.71; WSYT1 = 66.5 *P = 0.0209, r = −0.39; tPCLO(4.82) = 0.52 nsP = 0.6282, r = 0.23; tSTX8(5.63) = 1.54 nsP = 0.1782, r = 0.54; tSYNJ1(5.56) = 1.06 nsP = 0.3338, r = 0.41; SpongeControl, n = 11; SpongemiR-137, n = 18; number of transduced minor allele SNP fibroblast lines with either construct from three reprogramming. (c) FM4-64 imaging analysis, H(1) = 152.06, ***P < 0.001; n, number of analyzed transduced induced neurons of the two minor allele fibroblast lines from three reprogramming. (d) miR-137 target genes protein level in mossy fiber-CA3 pathway, tCplx1(21.97) = −2.69, *P = 0.0140, r = 0.5; t Nsf(29.0) = −2.36, *P = 0.0251, r = 0.40; tSyn3(16.11) = 3.43, **P = 0.0034, r = 0.65; tSyt1(21.41) = −2.17, *P = 0.0415, r = 0.42; n, number of dissected dorsal DG-CA3 regions from at least three animals. Right, cropped western blot image. Full-length blots are presented in Supplementary Figure 9. (e,f) Ultrastructural analysis of mossy fiber presynaptic terminal. (e) Representative images of virus-transduced synapse labeled with gold particles (arrowhead); *, active zone; scale bars, 100 nm. (f) Vesicle distribution from the synaptic release site for SpongeControl (n = 50) and SpongemiR-137 (n = 43), V = 0.25, F(11,91) = 2.40, *P = 0.0125, post hoc analysis: FDocked(1,91) = 4.01, *P = 0.0483; F50nm(1,91) = 4.13, *P = 0.045; F100nm(1,91) = 1.68, nsP = 0.1977; F150nm(1,91) = 3.04, nsP = 0.0845; F200nm(1,91) = 2.18, nsP = 0.1429; F250nm(1,91) = 0.09, nsP = 0.7687; F300nm(1,91) = 0.29, nsP = 0.5886; F350nm(1,91) = 3.22, nsP = 0.0759; F400nm(1,91) = 0.55, nsP = 0.4619; F450nm(1,91) = 1.53, nsP = 0.2188; n, number of analyzed synapses from at least three animals. (g) fEPSP amplitude for 1 Hz sustained stimulation, F(1,305) = 77.73, ***P < 0.001. Representative traces embedded; gray trace, response to first stimulation; n, number of analyzed hippocampal slices from at least three animals. (h) LTP recording in DG-CA3 mossy fiber pathway, H(1) = 125.92, ***P < 0.001. Arrows, application of either high frequency stimulation or DCG-IV. Inset, representative fEPSP traces; gray traces, baseline before stimulation. Right bar chart, LTP magnitude for the last 10 min (50–60 min) recording, W = 341, ***P < 0.001, r = −0.67; n, number of analyzed hippocampal slices from at least three animals. (i,j) Fear conditioning. Freezing percentage for context (i; t(17.0) = −1.43, nsP = 0.1707, r = 0.33) and cue (j; t(16.21) = 0.16, nsP = 0.873, r = 0.04). n, number of animals. ns, not significant. Error bars, s.e.m.
Figure 6
Figure 6. Impact of alteration of synaptotagmin-1 (Syt1) expression under miR-137 gain of function
ΔmiR-137OE-Venus (gray), miR-137OE-Venus (red), miR-137-Syt1-Venus (green) and ΔmiR-137OE-Syt1-Venus (purple), (a) Schematic overview of bicistronic expression vectors. LTR, long terminal repeat. (b,c) Ultrastructural analysis of the mossy fiber terminal. (b) Representative image of Venus-immunopositive synapse (black arrowhead). Red arrowheads. gap in the vesicle pool in miR-137OE-Venus synapse; *, active zone; scale bar, 100 nm. (c) Vesicle distribution from the synaptic release site for ΔmiR-137OE-Venus (n = 46), miR-137OE-Venus (n = 47), miR-137-Syt1-Venus (n = 70) and ΔmiR-137OE-Syt1-Venus (n = 58); n, number of analyzed synapses of at least three animals, Vgray-red = 0.72, F(11,97) = 22.9, ***P < 0.001, Vgray-green = 0.66, F(11,100) = 17.7, ***P < 0.001, Vgray-purple = 0.57, F(11,102) = 12.3, ***P < 0.001. (d) fEPSP amplitude during 1 Hz sustained stimulation, H(3) = 217.81 ***P < 0.001. Multiple comparison test after Kruskal-Wallis showed *P < 0.05 for all combinations. Inset, representative traces; gray traces, baseline before stimulation; ngray = 5, nred = 7, ngreen = 4, npurple = 4; number of hippocampal slices from at least three animals. (e) Right, mossy fiber LTP recording; arrows, application of high frequency stimulation or DCG-IV. Insets, representative traces; gray, baseline before stimulation. Left, magnitude of potentiation during the last 10 min (50–60 min) recording, H(3) = 106.41, ***P < 0.001, multiple comparison two-tailed test after Kruskal-Wallis, *P < 0.05; n, number of analyzed hippocampal slices from at least 3 animals. (f) Input-output curve of fEPSP against fiber volley amplitude at the mossy fiber-CA3 synapse, H(3) = 3.85, nsP = 0.2776. Shaded area, 95% confidence interval; ngray = 15, nred = 15, npurple = 15, ngreen = 15); n, number of analyzed hippocampal slices from at least three animals. (g) Freezing level % for contextual fear conditioning, F(3,34) = 4.53, **P = 0.0089; post hoc Tukey analysis: tmiR-137-miR137-Syt1 = 3.57, **P = 0.0060; tΔmiR-137-miR137 = −2.28, nsP = 0.1236, tΔmiR-137-miR137-Syt1 = 1.03, nsP = 0.7317, tΔmiR-137-ΔmiR137-Syt1 = −0.93, nsP = 0.789, tmiR-137-ΔmiR137-Syt1 = 1.37, nsP = 0.5278, tmiR-137-Syt1-ΔmiR137-Syt1 = −2.07, nsP = 0.1825; n, number of animals. ns, not significant. Error bars, s.e.m.

Comment in

Similar articles

Cited by

References

    1. Smoller JW, et al. Identification of risk loci with shared effects on five major psychiatric disorders: a genome–wide analysis. Lancet. 2013;381:1371–1379. - PMC - PubMed
    1. Ripke S, et al. Genome-wide association analysis identifies 13 new risk loci for schizophrenia. Nature Genetics. 2013;45:1150–U1282. - PMC - PubMed
    1. Bartel DP. MicroRNAs: target recognition and regulatory functions. Cell. 2009;136:215–233. - PMC - PubMed
    1. Kosik KS. The neuronal microRNA system. Nature Reviews Neuroscience. 2006;7:911–920. - PubMed
    1. Esquela-Kerscher A, Slack FJ. Oncomirs - MicroRNAs with a role in cancer. Nature Reviews Cancer. 2006;6:259–269. - PubMed

Publication types

MeSH terms