. 2015 Jun;21(6):572-80.
doi: 10.1038/nm.3867. Epub 2015 May 25.

The Cyclophilin A-CD147 complex promotes the proliferation and homing of multiple myeloma cells

Affiliations

The Cyclophilin A-CD147 complex promotes the proliferation and homing of multiple myeloma cells

Di Zhu et al. Nat Med. 2015 Jun.

Erratum in

Abstract

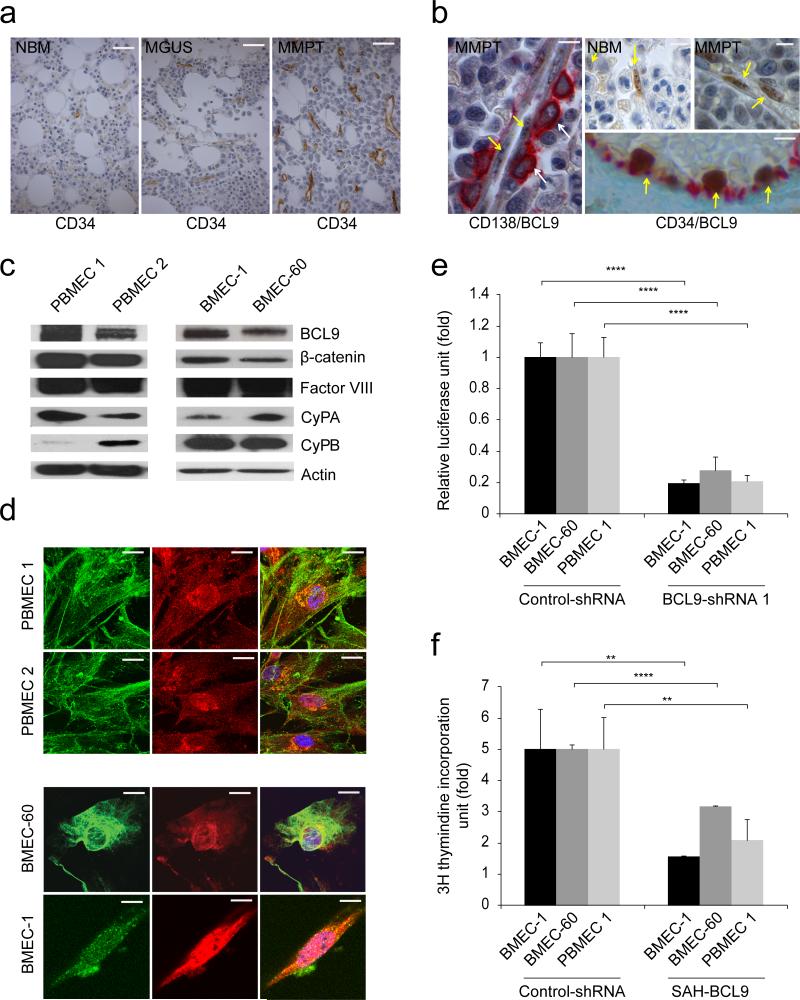
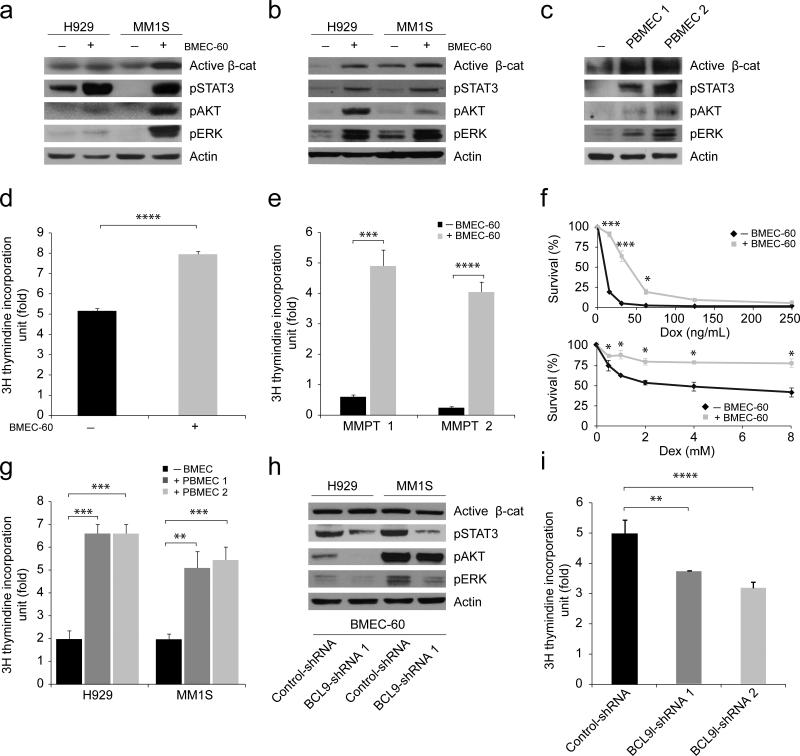
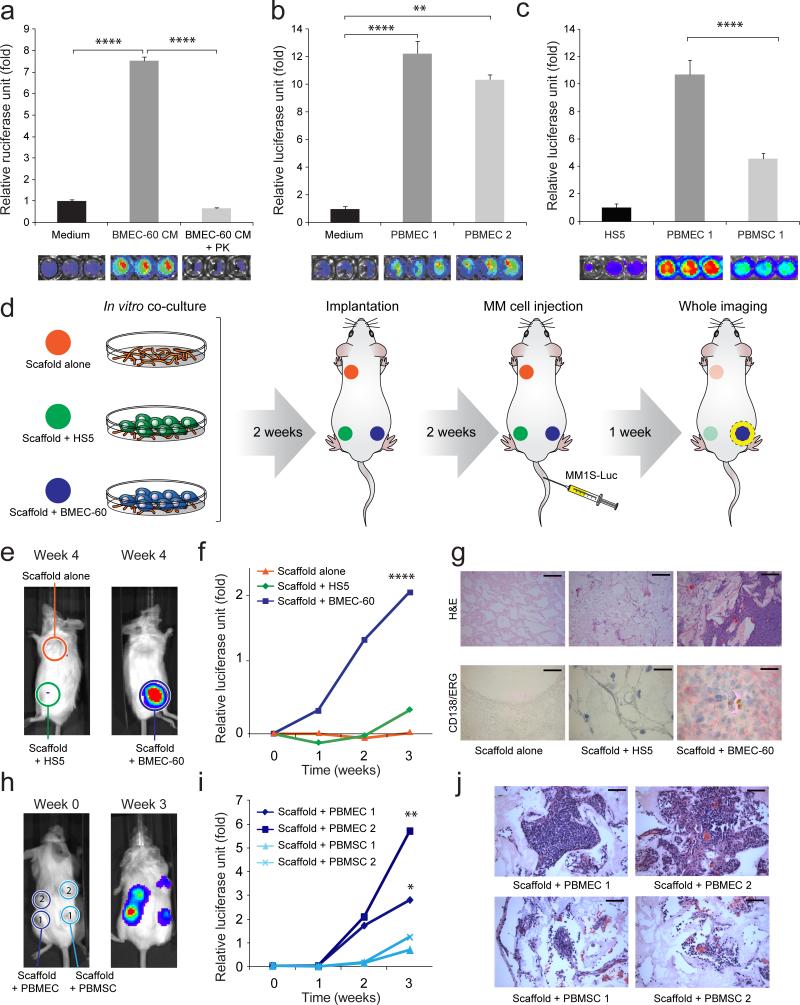
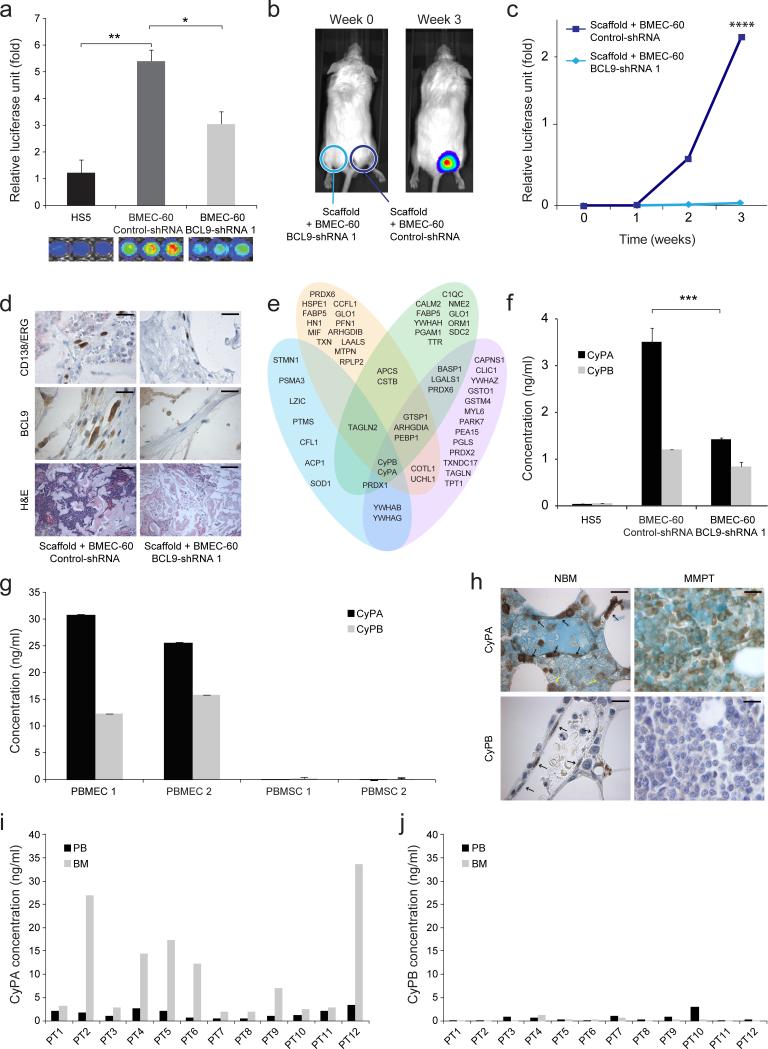
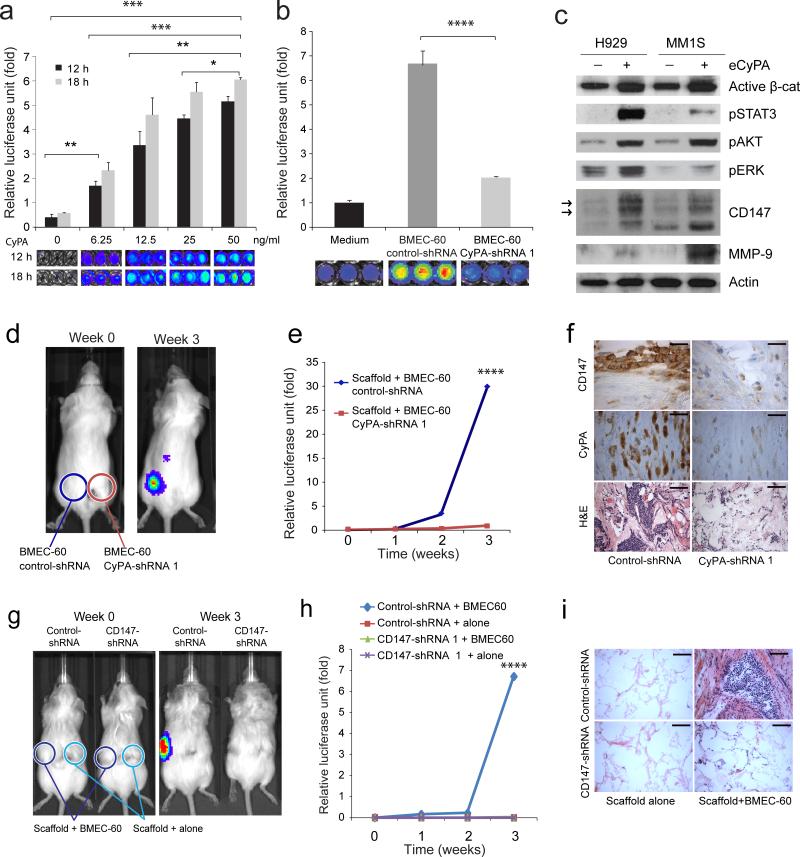
B cell malignancies frequently colonize the bone marrow. The mechanisms responsible for this preferential homing are incompletely understood. Here we studied multiple myeloma (MM) as a model of a terminally differentiated B cell malignancy that selectively colonizes the bone marrow. We found that extracellular CyPA (eCyPA), secreted by bone marrow endothelial cells (BMECs), promoted the colonization and proliferation of MM cells in an in vivo scaffold system via binding to its receptor, CD147, on MM cells. The expression and secretion of eCyPA by BMECs was enhanced by BCL9, a Wnt-β-catenin transcriptional coactivator that is selectively expressed by these cells. eCyPA levels were higher in bone marrow serum than in peripheral blood in individuals with MM, and eCyPA-CD147 blockade suppressed MM colonization and tumor growth in the in vivo scaffold system. eCyPA also promoted the migration of chronic lymphocytic leukemia and lymphoplasmacytic lymphoma cells, two other B cell malignancies that colonize the bone marrow and express CD147. These findings suggest that eCyPA-CD147 signaling promotes the bone marrow homing of B cell malignancies and offer a compelling rationale for exploring this axis as a therapeutic target for these malignancies.


Figures

Figure 1
Figure 1. Analysis of BCL9 expression and canonical Wnt activity in BMECs
(a) Representative CD34 immunostains in BM biopsies from normal individuals (NBM) (n=20) as well as MGUS (n=20) and MM persons (MMPT) (n=60). Bars: 50μm. (b) Representative BCL9 immunostains (brown color) in endothelial cells (arrows) in BM biopsies from MM persons (MMPT) or normal bone marrow (NBM) from otherwise healthy subjects. Selected representative cases are shown. Anti-CD138 staining (red color) is used as a marker of plasma cells on the left panel (arrows). Anti-CD34 staining (red color) is used as a marker of endothelial cells (right bottom panel). Bars: 10μm. Immunoblots (c) and immunofluorescence (d) analysis of BCL9 and β-catenin expression in primary endothelial cells derived from BM from two MM persons (PBMEC 1, PBMEC 1) and two BM endothelial cell lines (BMEC-1, BMEC-60). Note co-expression of BCL9 (Red color) and β-catenin (Greed color) by immunoblotting and by nuclear co-localization immunofluorescence. Factor VIII is used as marker of endothelial cells in immunoblots. Bars: 5μm. (e) Wnt reporter activity of BMEC-1, BMEC-60 and PBMEC 1 cells lentivirally transduced with BCL9-shRNA compared with cells lentivirally transduced with scrambled shRNAs (Control-shRNA). (f) Proliferation of BMEC-1, BMEC-60 and PBMEC 1 cells treated with medium alone (Vehicle) or in the presence of 10 uM SAH-BCL9. Proliferation and Wnt reporter data was normalized based on control or vehicle data. Results are means ± SD for assays performed in triplicate. Statistical significance of differences between groups was determined by applying the unpaired Student's t-test. (***P<0.001).
Figure 2
Figure 2. Biochemical and functional analysis of MM cells upon interaction with BMECs
Immunoblots of H929 and MM1S cells incubated in the absence (-) or presence (+) of BMEC-60 cells in the same (a) or separate (b) chambers. (c) Immunoblots of MM1S cells incubated in the absence (-) or presence (+) of endothelial cells derived from BM from two different MM persons (PBMEC 1, PBMEC 2) using transwell chambers. Proliferation of MM1S cells (d) and MM cells from two different MM persons (e, MMPT 1 MMPT 2), and incubated in the absence (-) or presence (+) of BMEC-60 cells using transwell chambers. (f) Cell viability using the tumor cell-specific in vitro bioluminescence imaging (CS-BLI) assay of MM1S-luc cells incubated in the presence or absence of increasing concentrations of doxorubicin (Dox) or dexamethasone (Dex), without (-) or with (+) BMEC-60 cells. (g) Proliferation of MM1S and H929 cells in the absence (-) or presence (+) of endothelial cells from BM of two different MM persons (PBMEC 1, PBMEC 2). (h). Immunoblots H929 and MM1S cells incubated in transwell chambers in the presence of γ-irradiated BMEC-60 cells lentivirally transduced with either Control-shRNAs or BCL9-shRNAs. (i) BCL9 knockdown in γ-irradiated BMEC-60 cells was associated with reduced proliferation of co-cultured MM1S cells. Proliferation data was normalized based on control data. Results are means ± SD for assays performed in triplicate. Statistical significance of differences between groups was determined by unpaired Student's t-test. (*P<0.05, **P<0.01, ***P<0.001).
Figure 3
Figure 3. In vitro and in vivo migration of MM cells toward BMECs
Transwell migration of MM1S-luc cells incubated under different growth conditions: (a) in medium alone (Medium), conditioned medium from BMEC-60 cells (BMEC-60-CM) or conditioned medium derived from BMEC-60 cells and treated with proteinase K (BMEC-60-CM + PK); (b) in the absence or presence of endothelial cells derived from BM from two different MM persons (PBMEC 1, PBMEC 2); (c) in the presence of HS5 cells or PBMEC 1 and PBMSC 1 isolated from same person. Migration data was normalized based on data of Medium alone. Results are means ± SD for assays performed in triplicate. Statistical significance of differences between groups was determined by unpaired Student's t-test. (d) Diagram of the three-dimensional poly-ε-caprolactone scaffold xenograft mouse model. Xenogen data (e), time course (f), and histologic and immunohistochemical analysis (g) of MM1S-luc cell growth within non-coated scaffolds or within scaffolds coated with HS5 or BMEC-60 cells. ERG (Ets-related gene): Endothelial cell marker. Bars: Top 100μm, Bottom 20μm. Xenogen data (h), time course (i), and histologic analysis (j) of MM1S-luc cell growth within scaffolds coated with primary BM endothelial cells (PBMEC 1 and PBMEC 2) or primary BM stromal cells (PBMSC 1 and PBMEC 2) isolated from same person with MM. Bars: 50μm. Statistical analysis of tumor burden were done using factorial analysis in SPSS 13.0. The results of two representative experiments of three are shown. (*P<0.05, **P<0.01, ***P<0.001, ****P<0.0001).
Figure 4
Figure 4. Secretion of eCyPA by BMEC and eCyPA levels in BM serum from MM persons
(a) Migration of MM1S-luc cells incubated in the presence of HS5 cells or BMEC-60 cells transduced with Control-shRNA or BCL9-shRNA. Xenogen data (b), time course (c), and immunohistochemical and histologic analysis (d) of MM1S-luc cell growth within scaffolds coated with BMEC-60 cells transduced with Control-shRNA or BCL9-shRNA. Bars: Top and midle 20μm, Bottom 100μm. Statistical analyses of tumor burden were done using factorial analysis in SPSS 13.0. (e) Histogram of proteins identified by mass spectrometry of excised bands (blue) and whole protein supernatants from BMEC-60 transduced with Control-shRNA (pink), as well as PBMEC 1 (yellow) and PBMEC 2 (green) cells. At the intersection are eCyPA and eCyPB identified by both procedures. (f) ELISA levels of eCyPA and eCyPB in CM from HS5 and BMEC-60 cells transduced with Control-shRNAs or BCL9-shRNA. (g) ELISA of eCyPA and eCyPB in CM from PBMEC 1 and PBMEC 2 or PBMSC 1 and PBMSC 2 cells isolated from same person with MM. Results are means ± SD for assays performed in triplicate. Statistical significance of differences between groups was determined by unpaired Student's t-test. (h) Representative immunostains of CyPA and CyPB expression in BM from healthy subjects (NBM) (n=20) and MM persons (n=60) (MMPT). Black and yellow arrows indicate expression of CyPA or CyPB in BMECS and myeloid cells, respectively, in a NBM. Bars: 30μm. ELISA quantification of eCyPA (i) and eCyPB (j) levels in serum from BM and PB isolated from same MM persons (n= 12). (**P<0.01, ***P<0.001, ****P<0.0001).
Figure 5
Figure 5. eCyPA promotes signaling changes, migration, and proliferation of MM cells through the CD147 receptor
Transwell migration assays of MM1S-luc cells incubated under different conditions: (a) increased concentrations of recombinant eCyPA.; (b) medium alone or BMEC-60 cells lentivirally transduced with Control-shRNA or shRNAs against CyPA (CyPA-shRNA). Migration data was normalized based on data of medium alone. Results are means ± SD for assays performed in triplicate. Statistical significance of differences between groups was determined by unpaired Student's t-test. (c) Immunoblot of total protein extracts from H929 and MM1S cells incubated in the absence (-) or presence (+) of eCyPA at 50ng per ml. Xenogen data (d), time course (e), and histologic analysis (f) of MM1S-luc cell growth within scaffolds coated with BMEC-60 lentivirally transduced with ControlshRNAs or CyPA-shRNA. Bars: Top and midle 20μm, Bottom 100μm. The results of one representative of three independent experiment is shown Xenogen data (g), time course (h), and histologic analysis (i) of cell growth of MM1S-luc transduced with Control-shRNA or CD147-shRNA within empty scaffolds or scaffolds coated with BMEC-60 cells. Bar: 100μm. Statistical analyses of tumor burden were done using factorial analysis in SPSS 13.0. (*P<0.05, **P<0.01, ***P<0.001, ****P<0.0001).
Figure 6
Figure 6. Targeting eCyPA-CD147 complex is associated with anti MM activity. Decreased CD147 expression in circulating MM cells
(a) Time course of Xenogen imaging of MM1S-luc cell growth in scaffolds implanted inCB17.Cg-PrkdcscidLystbg-J-Crl mice and treated with local injections of isotype control or anti-CD147 Abs. Xenogen data (b) of MM1S-luc cell growth within scaffolds coated with BMEC-60 cells and implanted subcutaneously in CB17.Cg-PrkdcscidLystbg-J-Crl mice. Groups of 4 mice were subsequently treated with either isotype Ab or anti-CD147 Ab, and tumor growth within the scaffolds was evaluated by Xenogen imaging every five days. (c) Left panel, Immunofluorescence analysis of CD147 expression in MM plasma cells from BM (top) and PB (bottom) from one person with MM (Case 1). Right panel, Immunofluorescence analysis of CD147 expression in normal plasma cells from BM (top) and lymph node (LN) (bottom) in two different normal donors (Case 3 and 4). Bars: 5μm. (d) Proposed model of BM homing of MM cells based on eCyPA secreted by BMECs and on CD147 expression by MM cells. Statistical analysis of tumor burden were done using factorial analysis in SPSS 13.0. (*P<0.05, **P<0.01).

Comment in

Similar articles

Cited by

References

    1. Talmadge JE, Fidler IJ. AACR centennial series: the biology of cancer metastasis: historical perspective. Cancer Res. 2010;70:5649–5669. - PMC - PubMed
    1. Valastyan S, Weinberg RA. Tumor metastasis: molecular insights and evolving paradigms. Cell. 2011;147:275–292. - PMC - PubMed
    1. Kuehl WM, Bergsagel PL. Molecular pathogenesis of multiple myeloma and its premalignant precursor. The Journal of clinical investigation. 2012;122:3456–3463. - PMC - PubMed
    1. Muller-Hermelink HK ME, Catovsky D, Campo E, Harris NL, Stein H. Chronic lymphocytic leukemia/small lymphocytic lymphoma. World Health Organization Classification of Tumor, Pathology and Genetics of Tumours of Haematopoietic and Lymphoid Tissues. 2008:180–182.
    1. Anderson KC. Oncogenomics to target myeloma in the bone marrow microenvironment. Clinical cancer research : an official journal of the American Association for Cancer Research. 2011;17:1225–1233. - PubMed

Publication types

MeSH terms